Investor Presentation - February 2021 - InterContinental Hotels Group PLC

Page created by Geraldine Taylor
 
CONTINUE READING
Investor Presentation - February 2021 - InterContinental Hotels Group PLC
voco Hangzhou Binjiang Minghao, Greater China

                                       Investor Presentation
                                                February 2021
Investor Presentation - February 2021 - InterContinental Hotels Group PLC
CAUTIONARY NOTE REGARDING FORWARD-LOOKING STATEMENTS

    This presentation may contain projections and forward looking-statements. The words “believe”, “expect”, “anticipate”,
    “intend” and “plan” and similar expressions identify forward-looking statements. All statements other than statements of
    historical facts included in this presentation, including, without limitation, those regarding the Company’s financial
    position, potential business strategy, potential plans and potential objectives, are forward-looking statements. Such
    forward-looking statements involve known and unknown risks, uncertainties and other factors which may cause the
    Company’s actual results, performance or achievements to be materially different from any future results, performance
    or achievements expressed or implied by such forward-looking statements. Such forward-looking statements are
    based on numerous assumptions regarding the Company’s present and future business strategies and the
    environment in which the Company will operate in the future. Further, certain forward-looking statements are based
    upon assumptions of future events which may not prove to be accurate. The forward-looking statements in this
    document speak only as at the date of this presentation and the Company assumes no obligation to update or provide
    any additional information in relation to such forward-looking statements.

    The merits or suitability of investing in any securities previously issued or issued in future by the Company for any
    investor’s particular situation should be independently determined by such investor. Any such determination should
    involve, inter alia, an assessment of the legal, tax, accounting, regulatory, financial, credit and other related aspects of
    the transaction in question.

2
Investor Presentation - February 2021 - InterContinental Hotels Group PLC
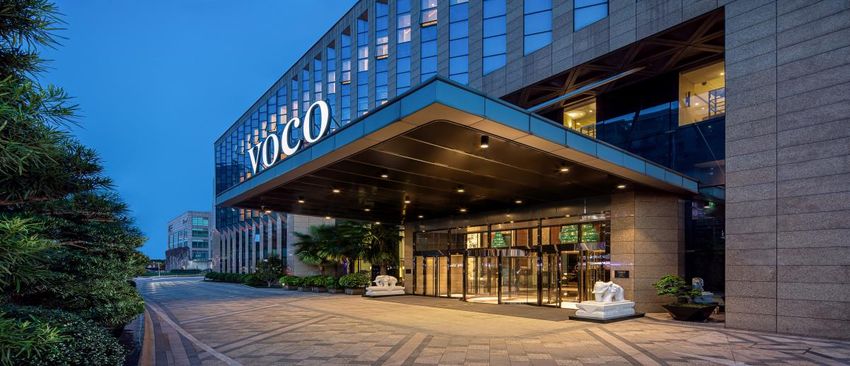
Continued focus on industry-leading net rooms growth, underpinned
    by our strategic priorities
                   Our Purpose                                    Our Priorities

                   True Hospitality for Good
                                                                             Build loved
                                                                             and trusted brands

                   Our Ambition
                                                                             Customer centric
                   To deliver industry-leading net rooms growth              in all we do

                   Our Strategy                                              Create digital
                                                                             advantage
                   Use our scale and expertise to create the
                   exceptional guest experiences and owner
                   returns needed to grow our brands in the
                   industry’s most valuable markets and                      Care for our people,
                   segments. Delivered through a culture that                communities and planet
                   attracts the best people and has a positive
                   impact on the world around us.

3
Investor Presentation - February 2021 - InterContinental Hotels Group PLC
Strong portfolio of preferred brands, geographically diverse and
    asset light
                                 Suites                          Essentials                          Premium                       Luxury & Lifestyle

    Strong portfolio
       of brands

                                          Owned, Leased                                     Luxury
                                           & Managed         144K                            10%
                       Managed               Leases          16%                                                  Midscale/Upper     93k
    Asset light and     28%                    1%                                                                    Midscale        34%                    103k
                                                                     Total                                             68%
    geographically                Total                                                                   Total                             Pipeline        38%
                                                                    rooms:              Upscale
                                 rooms:                                                                  rooms:                             rooms:
       diverse                                            228K
                                                                     886k
                                                                                         22%
                                  886k                    26%                                             886k                               272k
                                                                                 514K
                                                                                 58%                                                  76k
                                           Franchised
                                              71%                                                                                     28%

                                                                 ~95% of profits from fee business                                               Americas
    High quality fee                                      ~80% of fee revenue linked to hotel revenues                                           EMEAA
        stream                                             ~10% of fee revenue linked to hotel profits
                                                                                                                                                 Greater China
4
Investor Presentation - February 2021 - InterContinental Hotels Group PLC
IHG is well positioned to benefit from strong industry fundamentals
                                                    Industry
            Industry                •     Sector growth outpaced global economy for a                                                 Market share               •    Accelerated net rooms growth from ~3% to 5.6%
             growth                       decade pre Covid-191                                                                           gains                        in three years pre Covid-19

                                                                                                                                        System                   •    Opened 285 hotels; includes brand launches
         Shift to scale             •     Branded share2: 53% open rooms, 80% pipeline
                                                                                                                                                                      into new markets
           brands                   •     Top 3 share2: 17% open rooms, 43% pipeline                                                   expansion
                                                                                                                                                                 •    Pace of conversions increasing

        Upper Midscale •                  Contributed ~40% of total branded industry                                               Strong weighting
                                                                                                                                                    •                 Represents 68% system and 61% pipeline
          & Midscale                      growth over the past four years3                                                            in midscale
                                                                                                                                                    •                 Industry leading share of system and pipeline
           strength    •                  RevPAR declined less than overall industry4                                                  segments

            Desire to               •     Growing populations, desire to travel and                                                    Enhanced                  •    Broadened portfolio to target guest needs
             travel                       experience, inherent need to physically interact                                           brand portfolio             •    Five new brands launched or acquired

                                                                                                                                       Cloud-based               •    Digital-first approach enabling seamless guest
                                    •    Integral to the guest journey
          Technology                                                                                                                                                  experiences
                                    •    Drives owner value through data and insights                                                  capabilities
                                                                                                                                                                 •    Next phase of GRS on track by end 2021

                                   •     Increasingly informing guest preferences                                                     Responsible •                   Continuous focus on sustainable solutions
        Sustainability
                                   •     Scale helps owners seeking support                                                          Business focus •                 Sustainability credentials facilitate owner needs

    1   Source: WTTC and Oxford Economics. 2 Source: 2020 STR census data; based on room share. 3 Source: STR US Upper Midscale and Midscale supply growth 2015-19; 4 Source: 2020 STR US Upper Midscale and Midscale vs US total industry.

5
Investor Presentation - February 2021 - InterContinental Hotels Group PLC
Why owners choose to partner with IHG

                                                  Trust and track record

    Global Sales organisation                                              Strength of brands
                                                                           • Breadth and depth of brand portfolio
    • Developed a leading global sales                                     • Includes Holiday Inn Brand Family,
      enterprise to drive higher quality, lower                              the largest global hotel brand and
      cost revenue to our hotels                                             InterContinental, the largest luxury
    • Drives ~25% of Group gross revenue                                     hotel brand
                                                                           • Deliver RevPAR premiums
                                                                           • Strong owner ROI

    Technology Leadership                                                  Strong loyalty and
    • Roll out of cloud-based IHG Concerto                                 enterprise contribution
      including Guest Reservation System
    • Revenue management for hire tools
    • IHG Connect and IHG Studio enhance
                                                      Trust                • Normally ~50% loyalty contribution1
                                                                           • >100m IHG Rewards Club members
                                                                           • Significant portion of room revenue
      guest experience                                                       booked through IHG’s direct channels

     Investment in hotel lifecycle
                                                                           Procurement
     management and operations                                             • Programs for hotel operating goods and
    • Accelerating hotel signings into openings                              services
      and maximising owner ROI                                             • IHG Marketplace - hotel procurement
    • Faster ramp up of new hotel openings                                   buying programme / platform
    • Extensive infrastructure for franchise
      support                                                                               1   Loyalty contribution on a room revenue

6
Investor Presentation - February 2021 - InterContinental Hotels Group PLC
Strong competitive position in an industry where branded players
    are gaining market share
          IHG has over 4% share of global                 With a larger share of the active                         In an industry where branded
                   room supply                                        pipeline                                        players have gained share

             Share of global room supply (%)                  IHG share of global rooms and                           Global share of top 5 branded
                                Marriott                           active pipeline (%)                                           players

                              7.1%     Hilton
                                                                                              10.9%
                                   5.2% IHG
                                                                                                                                             24.7%
                                      4.3%
                                             Wyndham                                                                    20.2%
                                        4.0%
                                         3.6% Accor
                                                              4.3%

                  75.8%
           Other                                    Share of global room supply   Share of global active pipeline        2015                 2019

          IHG is largely asset-light and weighted                                                                      Strong conversion opportunity
                                                         ~40% of IHG pipeline under construction
            towards mainstream select service                                                                       potential to drive further share gains
    Source: STR

7
Investor Presentation - February 2021 - InterContinental Hotels Group PLC
Progress on system size quality and pipeline for future growth

    Focus on quality and removing hotels which aren’t representative of our brand standards                                                    Net rooms growth              Gross openings            Gross exits
                                    5.9%                                                                                                                                               5.6%
                      5.2%                                                                                           4.8%                                             4.8%
                                           4.3%                                                                                                       4.0%
         3.5%                                                                                       3.4%                             3.1%
                                                                           2.7%                                                                                                                        2.2%
                                                                   1.7%               1.6%
                                    10%             0.1%
                      10%                  9%
          8%                                                       7%                                                                                                  7%               8%
                                                    6%                     5%          5%           6%                6%               5%              6%
                                                                                                                                                                                                        4%

                                                                           -3%                      -3%               -3%             -2%              -2%             -2%              -2%             -2%
         -5%          -4%           -4%    -5%                     -5%                 -4%
                                                    -6%

         2006         2007          2008   2009     2010           2011    2012       2013          2014             2015             2016            2017            2018              2019          20201

     A strong pipeline providing a runway for future growth
                                                                          Composition of pipeline
    Number of rooms (‘000)                                 272                                                                                                                                       272
                                            22                                                                                                                                  44
                               84                                                                                                                        44
                166

                                                                             ~30%
                                                                              Current system size
                                                                                                                                  158

                                                                                                           26

          Midscale/          Upscale       Luxury          Total                                         Suites               Essentials             Premium                Luxury &                Total
        Upper Midscale                                                                                                                                                      Lifestyle
                                                                                                          12020   excludes the removal of 16.7k rooms relating to the termination of a portfolio of hotels owned by SVC

8
Investor Presentation - February 2021 - InterContinental Hotels Group PLC
IHG’s System Fund supports our brand marketing and our revenue
    delivery system
         Brands               Sources of Income              Sources of Spend

                           Marketing & Reservations            IHG Rewards Club
                                 Assessment
                         ~3.0% of gross rooms revenue

                                                            Advertising & Marketing

                         IHG Rewards Club Point Sales
                         ~4.75% IHG Rewards Club bill
                                                                  Distribution
                                                            (Reservation & Channels)

                        Other fees for value add services
                      e.g. pay for performance programmes    Systems & Technology

9
Investor Presentation - February 2021 - InterContinental Hotels Group PLC
Our mix places us well to benefit from the expected shape of
     demand recovery
              The midscale segments                                                                                                                                       Groups is toughest
                                                                                                                                         Non-urban1 areas
             our largest weighting and                                                     Domestic travel is                                                            area of demand; IHG’s
                                                                                                                                              strongly
             outpacing overall industry                                                  leading the recovery                                                               lowest exposure
                                                                                                                                        outperforming urban
                      RevPAR
                        US rooms distribution                                                  US demand mix                             US rooms distribution               2020 US guest stays

                     78%

                                                                                                              International                                      Business transient
                                                                                                                                                         Urban

                                                                                                                                                                                                Leisure

                                        18%

                                                            4%

                  Midscale/          Upscale             Luxury
                   Upper                                                                                                               Non Urban                                       Groups
                                                                                            Domestic
                  Midscale

     1Non-urban   regions includes hotels located in small metro towns, suburban districts, interstate, airport and resort locations

10
The Upper Midscale segment, which accounts for ~70% of our rooms
     in the US, has historically recovered faster than other segments
              US RevPAR Performance 2008 - 2015 (12m rolling)          US Industry Chain Scale RevPAR Change (12m rolling)
                                                                30%

                                                                20%

                                                                10%

                                                                 0%

                                                                       1989
                                                                       1990
                                                                       1991
                                                                       1992
                                                                       1993
                                                                       1994
                                                                       1995
                                                                       1996
                                                                       1997
                                                                       1998
                                                                       1999
                                                                       2000
                                                                       2001
                                                                       2002
                                                                       2003
                                                                       2004
                                                                       2005
                                                                       2006
                                                                       2007
                                                                       2008
                                                                       2009
                                                                       2010
                                                                       2011
                                                                       2012
                                                                       2013
                                                                       2014
                                                                       2015
                                                                       2016
                                                                       2017
                                                                       2018
                                                                       2019
                                                                       2020
                                                                -10%

                                                                -20%

                                                                -30%
                                                                             Luxury Chains           Upper Upscale Chains
                                                                             Upper Midscale Chains   Midscale Chains
                                                                             Total Industry
Source: STR

11
A strong platform in the US from which to drive growth
              US estate heavily weighted towards midscale segments…                                                                                 …where we have continued to outperform
                                                  US rooms by chain scale                                                                            Q4 2020 US RevPAR change – IHG vs industry (%)
                                  78%
                                                                                                                                                                                                                               IHG1
                                                                                                                                                                                                                               Industry2
                                                                                                                                                                                                       -37.3%
                                                                                                                                                                                                                -41.4%

                                                           18%                                                                                        -47.4%                   -47.4%
                                                                                                                                                                                        -48.7%
                                                                                    4%                                                                         -52.2%
                                                                                                                                                        Total US               IHG Weighted           Holiday Inn
                             Midscale/                  Upscale                   Luxury                                                                                         Segments           Express / Upper
                           Upper Midscale                                                                                                                                                          Midscale segment

                            ~30% of hotels have over 50% occupancy…                                                                              …driven by exposure to essential business travel
                December 2020 US occupancy distribution by brand segment (% of estate)                                                                                     US demand mix
                                                                                        0%
                                                                                       26%                                                                                                                               Business transient
                          29%                 29%                  33%
                                                                                                                                                                        45%                                              Leisure
                                                                                                                                                                                                 48%
                                                                                                                                                                                                                         Groups
                                                                                                            Occ: >50%
                          45%                 46%                  34%                                      Occ: 30% - 50%
                                                                                       74%                  Occ:
Europe, Middle East, Asia & Africa
     A clear strategy for growth: building scale in key markets
                                  A wide geographic footprint….                                 …with strong structural growth potential
                                   Rooms by geography (‘000 rooms)                                        Branded hotel penetration1
                                                                                 3-year                                                     66%
                                                                                 CAGR                                  60%
                 Europe                                                  127     +3.9%

India, Middle East                                                                                41%
          & Africa
                                               48                                +5.5%

 South East Asia
                                        29                                       +5.9%
        & Korea

          Australasia
                                       24                                        +5.0%
            & Japan

                                                                                                EMEAA              Greater China          Americas
                            Pipeline rooms by geography (‘000 rooms)
           % of current           20%           48%          70%          32%
           open rooms
                                  25                                                      •   Highly attractive structural drivers in numerous emerging
                                                 23
                                                              20                              markets in the region

                                                                                          •   High-value growth opportunities across Luxury & Lifestyle
                                                                           7
                                                                                          •   Developing and improving brand formats - opened first
                                                                                              Holiday Inn & Suites in Japan; signed first all-suites for
                             Europe             India,      South      Australasia            voco in Qatar; expanded Kimpton to resort destinations
                                             Middle East   East Asia    & Japan
     1Source:   STR Census data               & Africa     & Korea

13
Our leading position in Greater China
             Growing in locations with attractive demand drivers…                                                                                 …with a strong share of the branded pipeline
                       FY 2020: system and pipeline distribution (‘000 rooms)                                                                                        IHG share of branded market1

                                               110                                                                                                                                                24%
                                                                                                                                                                           21%                                     22%
                                                                                                                                                     19%
                                                45
                                                                                                                                                                                                                                16%

                                                                                           46                                                                                                                                          11%
                          42                                                                                                                                                                                 8%
                                                                                                                                                                    8%
                          12                                                               22                                                 7%                                          6%
                                                65                   25
                                                                     12                                       14
                          30                                                               24                      1
                                                                     13                                      13
                        Tier 1                Tier 2               Tier 3                Tier 4          Hong Kong,                             Tier 1                Tier 2                 Tier 3            Tier 4          Hong Kong,
                                                                                                        Macau, Taiwan                                                                                                         Macau, Taiwan 2
                                                Pipeline       System Size                                                                         Market Share (STR data; includes domestic brands)
                                                                                                                                                   Pipeline Share (STR data; international brands only)

                            Our brands deliver guest preference3                                                                     Strong market fundamentals from a growing middle class
                                                                                                                                                                            China income mix (%)
                                                                                                                                                                                                      75%
                                                                                                                                                                                      60%

            #1                           #1                             #1                                   #2                                 37%

                                                                                                                                                             10%
                                                                                                                                                                                                                                   15%
                      preferred brand in its competitive set                                                                                                                                                             3%
                                                                                                                                                   Low Income                          Middle Income                     High Income
     1 Market share per Q4 2020 STR data; pipeline data only available for international branded operators
     2 Market share includes 5k rooms from InterContinental Alliance Resorts partnership with Sands                     Source: EIU, Accenture Chinese Consumer Digital Trends Research (n=4060); IMF, UNWTO /Ministry
     3 Based on Serious Consideration as per 2019 Millward Brown brand survey of International brands                   of Tourism, Tourism Economics;                                                                         2015      2030

14
Cash generative business, driving shareholder returns
         • Strong cash flows driving consistent
             shareholder returns
                                                                                                                       Ordinary dividend progression 2014-2019 (¢ per share)
         • Total returns of ~$13.6bn since
             2003, ~40% from operations                                                             Final        Interim
                 • $2.4bn ordinary dividend                                                                                                        +10% CAGR                                            114
                                                                                                                                                                                104
                 • $11.2bn additional returns                                                                                    85
                                                                                                                                                         94
                                                                                                         77
         • Strong financial position:                                                                                                                                            71
                                                                                                                                                                                                         78
                                                                                                                                                         64
             • $2.90bn Bonds1                                                                            52
                                                                                                                                 58
                                                                                                                                                                                                                                 40
             • $1.35bn          RCF2
                                                                                                                                                                                 33                      36                      40
             • $2.1bn PF available liquidity3                                                            25                      28                      30

                                                                                                                                                                                                                                       5
                                                                                                       2014                    2015                    2016                     2017                    2018                    2019

       Strong free cash flow generation ($m)4
                                                                611                                                                        Shareholder returns 2003-19 ($bn)                                   13.6
                                   551
                                                 516                          509
                     466
                                                                                                                                                                    5.8
                                                                                                                         7.9
       321

                                                                                             29                   Asset disposals                       Operational cash flows                                Total

      2014          2015          2016           2017          2018          2019          2020
 1Next bond maturity in November 2022 (£173m); 2 Maturity of the $1.35bn RCF extended by 18 months to September 2023; 3 Consists of $2.9bn total available liquidity as of 31 December 2020 and pro forma for the payment of £600m ($0.8bn) of CCFF
 maturing in March 2021. 4 2017 and 2018 Free Cash Flow Restated for the adoption of IFRS 16; 5 2019 final dividend recommendation withdrawn in response to Covid-19

15
Substantial liquidity maintained with optimised bond maturity profile

                                Liquidity profile                                                     Bond maturity profile                                                         Net debt composition

             •     ~$2.1bn pro forma total available                                    •     Staggered bond maturity with no
                                                                                                                                                                                                           $(2,529)m
                   liquidity1, comprising ~$0.8bn of net                                      significant maturity until Q4 2022
                   cash on deposit and undrawn RCF                                      •     Issued €500m 1.625% bonds and
                   of $1.35bn                                                                 £400m 3.375% bonds maturing in                                        Cash & cash equivalents                    1,675
             •     Repayment of £600m commercial                                              2024 and 2028 respectively
                   paper in March 2021 issued under                                     •     Concurrently repaid early £227m of
                   UK Government’s CCFF scheme                                                our £400m 3.875% bonds maturing                                                    Short-term debt                (869)

             •     Secured covenant waivers for                                               in November 2022
                   $1.35bn RCF up to and including                                       Bond maturity ($m)
                   December 20212
                                                                                                              611                        618
             •     Covenant relaxations secured for                                                                                               542                            Long-term debt3              (2,885)
                                                                                                                                479
                   June 2022 and December 2022                                                                         413

                                                                                            235

                                                                                                                                                                                              Leases            (450)
                                                                                                       0                                                                                              31 December 2020
                                                                                            2022     2023     2024     2025     2026     2027     2028
 1Consists of $2.9bn total available liquidity as of 31 December 2020 and pro forma for the payment of £600m ($0.8bn) of CCFF maturing in March 2021. 2 Our customary interest cover and leverage ratio covenants have been replaced by a $400m
 minimum liquidity covenant (defined as unrestricted cash and undrawn facilities with a remaining term of 6 months) tested at 30 June 2021 and 31 December 2021. Details of covenant levels and performance against these is provided in note 10 to the
 Group Financial Statements. 3 Includes value of currency swaps hedging long-term debt.

16
Our strategy for uses of cash remains unchanged

                                  Invest in the                Restore an ordinary                Return surplus
                                   business to                    dividend when                      funds to
                                  drive growth                 responsible to do so                shareholders

                                             Objective of maintaining an investment grade credit rating
                                           2.5x – 3.0x Net Debt : EBITDA1 under normalised conditions

     1   On a post IFRS16 basis

17
Conclusions
     - Confident on future growth prospects and our strategic priorities

     •   Recognition and thanks to all of our colleagues and owners for their efforts in the most challenging conditions and for
         their dedication to our purpose of True Hospitality for Good

     •   Delivered outperformance; demonstrated resilience of our business model; launched brands in new markets; continued
         to invest for future growth

     •   Long-term confidence reflected in 285 hotel openings and 360 signings

     •   Industry fundamentals remain strong and IHG is well-placed with preferred brands in attractive markets and segments,
         together with our strong technology and loyalty platforms

     •   Clear strategic priorities to achieve our ambition of industry-leading net rooms growth as the market recovers

18
Holiday Inn – Dubai

        Overview of FY 2020 and our strategic objectives
Navigating the Covid-19 crisis effectively, whilst positioning the
      business for growth
      Our response to Covid-19                                                                                                       Rooms & RevPAR
                       •     Decisive cost action; cash preservation; robust liquidity
                                                                                                                                                        •    +0.3% net growth YoY1 to 886k rooms (5,964 hotels)
                       •     Offering assistance to colleagues and communities                                                                          •    Conversion activity increasing
                       •     Providing guests with the confidence to stay through the IHG                                                               •    (52.5)% Global RevPAR decline; (53.2)% in Q4
                             Clean Promise and flexible booking options
                                                                                                                                                        •    Continued outperformance in key markets
                       •     Supporting owners to help keep hotels open, lower their
                             costs and manage their cash

 Results                                                                                                                         Focusing on growth
                       •     (75)% underlying operating profit decline                                                                             •        Opened 285 hotels

                       •     $29m free cash flow                                                                                                   •        Signed 360 hotels; ~25% conversions
                       •     $2.1bn available liquidity2                                                                                           •        213 ground breaks
                       •     No final dividend proposed                                                                                            •        ~40% of pipeline under construction
                       •     Resilient fee-based business model                                                                                    •        Evolved purpose and strategic priorities

 1   +2.2% excluding the impact of SVC portfolio termination; 2 On a pro forma basis for repayment of £600m UK Government CCFF at March 2021 maturity

20
Weekly RevPAR performance demonstrates the path of recovery for
     each of our regions

                                              IHG 2020 weekly RevPAR performance by region
      20%

       0%

      -20%

      -40%

      -60%

      -80%

     -100%
         Jan 20   Feb 20   Mar 20   Apr 20        May 20       Jun 20         Jul 20    Sep 20   Oct 20   Nov 20   Dec 20

                                             Americas      EMEAA        Greater China   Group

21
Cost reductions whilst continued investment in growth

                             Cost actions                                                          Owner payment profile

                                                                                      Americas invoices paid within 90 days of due date
     •   $150m of temporary Fee Business cost savings in 2020
     •   Reduction in cost base of owned, leased and managed          Unpaid
         lease hotels
     •   Targeting ~$75m to be sustainable into 2021

                                                                        Paid 92%                             85%      87%     90%     90%   91%
                                                                                      81%    78%      75%

                   Continued investment in growth

     •   Maintained investment in our five newest brands through               Jan    Feb    Mar      Apr     May     Jun     Jul     Aug   Sept

         2020, which will contribute to future growth as they build
         scale                                                            •    We have 2,250+ owners across our ~4,300 Americas hotels
     •   Ongoing deployment of key money                                  •    ~85% of invoices paid within 45 days of due date and ~90%
                                                                               within 75 days of due date

22
Build loved and trusted brands
     - Expanding and enhancing our portfolio to drive growth
                         2017                                         2020

•    Broadened our brand portfolio with five targeted additions
     since 2017:

       -   High-quality midscale brand avid launched in 2017
       -   Acquisition of Regent Hotels & Resorts in March 2018
       -   Conversion focussed brand voco launched June 2018
       -   Six Senses Hotels Resorts Spas acquired in early 2019
       -   New all-suites brand Atwell Suites launched in late 2019

•    IHG Hotels & Resorts Masterbrand, IHG Rewards branding,
     and strengthened positioning of each brand within its segment

23
Build loved and trusted brands
     - Scaling up our newest brands

 •       89 properties under construction or with    •   Signed nine hotels into our newest           •   Brand established in 20+ countries
         plans approved                                  all-suites Upper Midscale brand
                                                                                                      •   Signed 18 properties; 12 conversions,
 •       17 openings and 19 signings in the year     •   Properties secured in attractive locations       six new builds
                                                         such as Denver, Austin and Charlotte
 •       Expansion beyond US with first opening in                                                    •   Signed and opened first properties in US,
         Mexico and first ground break in Canada     •   Ground broken for first hotel in Miami           including two conversions in New York

 •       Strongest guest satisfaction across our                                                      •   First opening in Greater China
         portfolio in the Americas

System1                                    24                                -                                              21
Pipeline1                                  192                              19                                              30
Chain scale2                             Midscale                     Upper Midscale                                      Upscale

     1   Hotels. 2 STR classification.
24
Build loved and trusted brands
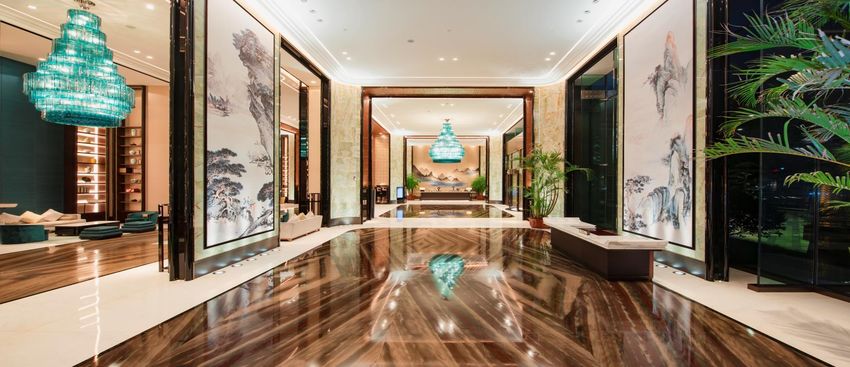
     - Global roll out of voco continues

     voco Hangzhou Binjiang Minghao, Greater China   voco The Franklin New York, US

     voco Paris Montparnasse, France                 voco Villach, Austria

25
Build loved and trusted brands
     - Holiday Inn Express driving outperformance and strong
     returns for owners
                                                                           •   Launched updated Formula Blue 2.0 in Americas with procurement-ready design and
                                                                               delivering >10% cost savings for owners

                                                                           •   177 hotels with new room designs across Europe, delivering ~5pt premium in guest
                                                                               satisfaction

                                                                           •   Outperformed against the Upper Midscale segment throughout 2020

                                                                           •   Opened 136 hotels, bringing total estate to 2,966

                                                                           •   Signed 132, bringing total pipeline to 683 or >20% of current estate

                                                                           FY20 RevPAR outperformance1                             4.3%pts
                                                                                                                                                      4.1%pts
                                                                                                          3.6%pts

                                                                                    1.3%pts

                                                                                      Q1                    Q2                       Q3                 Q4

     1 Source:   US Holiday Inn Express vs Upper Midscale segment (STR).
26
Build loved and trusted brands
     - Continue to invest in and grow across other established brands

 •       ~60% occupancy and high                   •   Opened three HUALUXE                •   New build prototype                    •   Renovations delivering uplifts
         guest satisfaction through 2020               properties, including the               implemented in ~90 hotels                  in guest satisfaction
                                                       rebranding of HUALUXE                   across the Americas, delivering
 •       New prototype design                          Shanghai Twelve at Hengshan;            5pt uplift in guest satisfaction       •   10 openings in Greater China
         committed in >80 Candlewood                   signed a further six                                                               to reach portfolio of over 100
         Suites and >100 Staybridge                                                        •   ‘Open Lobby’ new public space
         Suites                                    •   Opened an EVEN Hotel in                 already implemented or                 •   Signed 27 properties, ~25%
                                                       Greater China, marking the first        committed to in 90% hotels                 from conversions
 •       Opened 20 Candlewood Suites                   outside of the Americas                 across Europe
         and 24 Staybridge Suites
         properties
                                                                                           Continued focus on quality and consistency of estates; ~200 hotels (~10-15% of
                                                                                           global estate) being reviewed; focused on those that are below where would like
                                                                                          them to be in areas such as customer satisfaction and property condition; working
                                                                                          closely with owners to help raise overall guest experience, including implementing
                                                                                                                 service or property improvement plans

System1                    366            303            12                   16                          1,248                                        429
Pipeline1                   73            155            25                   31                           262                                          89
Chain
                       Midscale          Upscale       Upscale             Upscale                   Upper Midscale                                  Upscale
scale2

     1   Hotels. 2 STR classification.
27
Build loved and trusted brands
     - Expanding our Luxury & Lifestyle offering

 •    Signed seven hotels                 •   Four signings since      •   Largest global luxury   •   Global presence             •   Opened 10 properties
      and opened a                            acquisition taking           hotel brand with            secured in 15 countries,        in 2020, including five
      property in Turkey in                   pipeline to six              presence in over 60         including new openings          in the US
      2020                                    properties                   countries                   in Mexico, Thailand and
                                                                                                       Japan                       •   Firsts for the brand in
 •    New locations include               •   Conversion of Regent     •   Entering its 75th                                           Japan and Cyprus
      Italy, Japan and Saudi                  Shanghai Pudong              anniversary year        •   Growth of resort
      Arabia                                  completed in 45 days                                     portfolio with signing of   •   Signed entry of the
                                                                       •   Return to Italy and         Mallorca                        brand in Australia
 •    Commitment to                       •   Regent Hong Kong             Morocco
      community,                              renovation progressing                               •   Signed eight hotels,
      sustainability and                                               •   Chiang Mai and Fiji         including four in
      wellness                                                             key conversions             the US

 System1                            16                7                            205                         73                              125
 Pipeline1                          31                6                            69                          32                              104
 Chain scale2                   Luxury             Luxury                        Luxury                  Upper Upscale                   Upper Upscale
      1   Hotels. 2 STR classification.
28
Build loved and trusted brands
      - Continuing to enhance our Luxury & Lifestyle offer to guests
      and owners

     Six Senses Kocatas Mansions, Istanbul   Regent Shanghai Pudong, Greater China       Hotel Indigo Bath, UK

     Hotel Indigo Larnaca, Cyprus            InterContinental Chongqing, Greater China   Kimpton Hotel Fontenot, New Orleans, US

29
Customer centric in all we do
                              Guests                                                    Owners

                                                                                •   Updated operating standards to offset
      Cleanliness •      IHG Clean Promise                        Operating
                                                                                    higher safety and cleaning costs, and
       & Safety •        New protocols and standards              standards
                                                                                    to focus on maximising returns

       Booking       •   Book Now, Pay Later policies             Payment       •   Case-by-case consideration of
       flexibility   •   Free booking cancellations               flexibility       payment plans

                     •   Provides corporate bookers greater                     •   Centralised procurement helping to
       Meet with                                                 Procurement
                         flexibility and assurance                                  deliver savings and protect owner
      Confidence
                     •   Virtual and hybrid meetings solutions                      cash flow

                                                                  Revenue       •   Enhancements to provide further pricing
       Loyalty       •   Dynamic pricing for Reward Nights
                                                                 Management         and returns protection during periods of
                     •   Enhancing value through partnerships
                                                                                    volatile demand

      Personalisation • Targeted promotions informed by                         •
                                                                   IHG              Automating front desk operations such
                        data-driven capabilities                 Concerto           as Contactless Check-in

30
Create digital advantage
     - Continuing to invest in our digital-first approach
          GRS       • Attribute pricing initial pilot conducted in each region in
                      2020; full roll-out expected by end 2021
                    • Pilots demonstrating to owners the ability to generate
                      maximum value from their hotel’s unique attributes

                    • Digital check-in at >1,000 hotels and receiving strong
          Guests      guest satisfaction scores; targeting 4,500 live hotels by
                      end 2021; digital check-out already in 4,000 hotels
                    • IHG Studio integrated in-room entertainment and guest
                      service live in ~100 hotels

                    • Owner portal providing real-time scorecard metrics,
         Owners       allowing owners to rapidly respond
                    • Hotel Lifecycle System enabling enhanced reporting and
                      maximising owner returns by accelerating signings to
                      openings

31
Care for our people, communities and planet
     - 2030 Responsible Business ambitions and commitments

     Champion a diverse             Improve the lives of          Reduce our energy use and        Pioneer the transformation       Conserve water and help
     culture where everyone         30 million people in our      carbon emissions in line with    to a minimal waste               secure water access in those
     can thrive                     communities around the        climate science                  hospitality industry             areas at greatest risk
                                    world

     • Drive gender balance         • Drive economic and social   • Implement a 2030 science      • Eliminate single use           • Implement tools to reduce
       and a doubling of under-       change through skills         based target that delivers:     items, or move to                the water footprint of our
       represented groups             training and innovation       - 15% absolute reduction        reusable or recyclable           hotels
       across our leadership        • Support our communities         in our direct operations      alternatives across the        • Mitigate water risk through
     • Cultivate an inclusive         when natural disasters                                        guest stay                       stakeholder collaboration to
                                                                    - 46% per   m2reduction in
       culture for our                strike                          franchise operations        • Minimise food going to           deliver water stewardship at
       colleagues, owners and       • Collaborate to aid those                                      waste through a “prevent,        basin level
                                                                  • Target 100% new build
       suppliers                      facing food poverty                                           donate, divert” plan           • Collaborate to ensure
                                                                    hotels to operate at very
     • Support all colleagues to                                    low / zero carbon             • Collaborate to achieve           adequate water, sanitation,
       prioritise their wellbeing                                   emissions by 2030               circular solutions for major     and hygiene (WASH)
       and the wellbeing of                                                                         hotel commodity items            conditions for our operating
                                                                  • Maximise / optimise the
       others                                                                                                                        communities
                                                                    role of renewable energy
     • Drive respect for and
       advance human rights

32
voco Hangzhou Binjiang Minghao, Greater China

                                                Appendices
Financial performance

         Results from reportable segments1                                                                                                      Reported                                                                      Underlying2

         $ million                                                                                      FY 2020                                  FY 2019                               % Change                                  FY 2020

         Revenue3                                                                                         $992m                                 $2,083m                                    (52)%                                   (52)%

         Operating profit                                                                                 $219m                                   $865m                                    (75)%                                   (75)%

         Revenue from fee business                                                                        $823m                                 $1,510m                                    (45)%                                   (45)%

         Operating profit from fee business                                                               $278m                                   $813m                                    (66)%                                   (65)%

         Fee margin4                                                                                      34.1%                                   54.1%                                (20.0)%pts

         Adjusted interest5                                                                               $130m                                   $133m                                     (2)%

         Reported tax rate6                                                                                 38%                                     24%                                   14%pts

         Adjusted EPS7                                                                                     31.3¢                                  303.3¢                                   (90)%

         Total dividend                                                                                        -                                   39.9¢                                  (100)%

 1 Reportable  segments excludes System Fund results, hotel cost reimbursements and exceptional items. 2 Reportable segment results excluding significant liquidated damages, current year disposals and stated at constant 2020 exchange rates (CER).
 3 Comprises the Group’s fee business and owned, leased and managed lease hotels. 4 Excludes owned, leased and managed lease hotels, significant liquidated damages and the results of the Group’s captive insurance company. 5 Adjusted interest adds
 back $4m of interest charges in relation to the System Fund and excludes exceptional items. 6 The Group’s reported effective tax rate, before exceptional items and the System Fund results. 7 Calculated using results from Reportable Segments and Adjusted
 interest, and excluding changes in fair value of contingent purchase consideration.

34
Fee-based business model shows relative resilience in
     spite of RevPAR downturn

                                                                                        FY 2020 fee revenue: $823m, down 45%1 and 45% underlying2
                      RevPAR                                                                   FY 2020 Group comparable RevPAR                                   FY 2020 system growth (%YoY)
                                                                                                            growth

                              X
                                                                                                                                                                     4.5%                                   • 39k rooms opened
                       Rooms                                                                        -17.0%                                                                                                  • 37k3 rooms removed

                                                                                                                 -29.5%pts
                              X
                                                                                                                                                                                             0.3%

                 Royalty Rate                                                                                                       -52.5%                           Gross                     Net
                                                                                                    ADR        Occupancy            RevPAR

                                                                                                     (52.7)% Total RevPAR growth4                                        +3.6% Growth in available rooms4

 ¹ Growth stated at AER. ² Underlying fee revenue excludes owned, leased and managed lease hotels, significant liquidated damages, current year disposals and stated at constant 2020 exchange rates (CER). 3 Removals include 2.1k rooms relating to a
 previously flagged hotel portfolio in Germany and 16.7k rooms relating to the termination of a portfolio of hotels owned by SVC. 4 Growth stated for underlying fee business.

35
Americas
     US RevPAR outperformance in the segments in which we compete
         •      RevPAR down 48.5%; US down 46.9%                                                                                                                   FY 2020 growth in fee revenue drivers1
         •      Q4 US RevPAR down 47.4%
               -     Franchised estate down 43% and Managed estate down 79%                                                                                                                            -2.0%
               -     Midscale/Upper Midscale and Extended Stay most resilient segments

         • YoY net rooms growth (2.0)% (gross: +3.2%)
               -     Net rooms growth +1.1% (before 16.7k rooms from SVC termination)
                                                                                                                                                                       -48.5%                                                     -46.1%
               -     Development continued with 136 ground breaks, 24 in Q4
                                                                                                                                                                      RevPAR                      Net rooms                   Fee revenue

         • Underlying fee revenue1 down 46% ($391m), underlying fee operating profit2 down 51%
           ($336m):
               -    Impact from lower demand across Managed estate resulting in $8m lower                                                                                FY 2020 net rooms growth (‘000s)
                    incentive management fees largely offset by fee business cost savings, an $8m                                                                          525
                    payroll tax credit benefit and a $4m litigation settlement benefit
                                                                                                                                                                                                                                      514
         • Owned, leased and managed lease profit down $64m to a loss of $27m, impacted by
                                                                                                                                                                                                27
             the temporary closure of a number of hotels
                                                                                                                                                                                                                     17

         • Pipeline: 103k rooms; 14k signed
         • Signings include 50 Holiday Inn Express, 19 avid, 9 Atwell Suites and 3 voco hotels
                                                                                                                                                                       FY 2019                Exits            Openings            FY 2020
     1 Underlying
                fee revenue excludes owned, leased and managed lease hotels, significant liquidated damages, current year disposals and stated at constant 2020 exchange rates (CER).   2 Underlying   fee operating profit excludes owned, leased and
     managed lease hotels, significant liquidated damages and current year disposals at CER.

36
Europe, Middle East, Asia & Africa
     Difficult trading conditions with closures and travel restrictions
        • RevPAR down 64.8% (Q4 down 70.5%)
                                                                                                                                                                   FY 2020 growth in fee revenue drivers1
        • Q4: Impacted by lockdown measures, particularly UK (down 74%) and Continental                                                                                                                2.0%
          Europe (down 86%); Middle East down 56%; Australasia & Japan down 53%

        • 83% of the estate open as of the end of January

                                                                                                                                                                      -64.8%                                                     -67.5%
        •    YoY net rooms growth +2.0% (gross: +5.1%)
                                                                                                                                                                     RevPAR                      Net rooms                  Fee revenue1
        •    Removals include 2.1k rooms relating to a previously flagged hotel portfolio in
             Germany

        • Underlying fee revenue1 down 67% ($220m) and underlying fee operating profit2 down
                                                                                                                                                                      FY 2020 net rooms growth (‘000s)
          $211m to a loss of $19m, impacted by $76m lower incentive management fee income
                                                                                                                                                                                                                                    228
        • Owned, leased and managed lease loss of $32m; hotel closures partially offset by:
          significant cost reduction measures; rent reductions; $3m of disposal gains                                                                                       223
        • Rental payments relating to UK and German leased hotels now fully variable through                                                                                                                        11
          the income statement; no lease liability or right-of-use asset on the balance sheet                                                                                                   (7)

        • Pipeline: 76k rooms; 14k signed
        • Signings include 5 Six Senses, 1 Regent, 10 Hotel Indigo and 10 voco hotels                                                                                   FY 2019               Exits           Openings           FY 2020
     1 Underlying
               fee revenue excludes owned, leased and managed lease hotels, significant liquidated damages, current year disposals and stated at constant 2020 exchange rates (CER).   2 Underlying   fee operating profit excludes owned, leased
     and managed lease hotels, significant liquidated damages and current year disposals at CER.

37
Greater China
     Occupancy levels recovered to ~60% in Q4
          • RevPAR down 40.5% (Q4 down 18.2%)                                                                                                                         FY 2020 growth in fee revenue drivers1
              • Mainland China down 37% (Q4 down 15%)                                                                                                                                                          6.4%
                       • Tier 1 RevPAR down 48% (Q4 down 28%)
                       • Tier 2-4 RevPAR down 31% (Q4 down 8%)
              • Hong Kong SAR down 78% (Q4 down 52%)
                                                                                                                                                                          -40.5%                                                        -43.8%
                                                                                                                                                                         RevPAR                          Net rooms                 Fee revenue1
          • YoY net rooms growth 6.4% (gross: up 8.4%)

          • Underlying fee revenue1 down 44% ($60m) and operating profit2 down $38m to $35m,                                                                              FY 2020 net rooms growth (‘000s)
            driven by $32m lower incentive management fee income                                                                                                                                                                         144

          • Pipeline: 93k rooms; 28k rooms signed                                                                                                                                                                        11
              • 85 franchise agreements signed across Crowne Plaza, Holiday Inn and Holiday Inn                                                                                   136
                Express                                                                                                                                                                                  (3)
              • Opened first voco hotel with two further signings
                                                                                                                                                                              FY 2019               Exits             Openings        FY 2020
     1 Underlying fee revenue excludes owned, leased and managed lease hotels, significant liquidated damages, current year disposals and stated at constant 2020 exchange rates (CER).   2 Underlying   fee operating profit excludes owned, leased and managed
     lease hotels, significant liquidated damages and current year disposals at CER.

38
Growth rate analysis

                                           RevPAR growth %                               Net rooms growth %
                                                                                                                                    Underlying Fee
                                                                                                                                                                                                      Comments
                                                                                                                                  Revenue1 Growth %
            FY 2020                  Comparable                  Total2                  YoY                 Available2

                                                                All hotels                                   Aggregate
                                    Hotels that have
                                                             that were open                                  number of
                                       traded in all
                                                            in FY 2020 and          30 December           rooms available
                                     months being
                                                              FY 2019 (incl         2020 vs 2019             for sale in
                                     compared (i.e.
                                                             hotels that are                                FY 2020 vs
                                      steady state)
                                                              ramping up)                                     FY 2019

            Americas                    (48.5)%                 (48.0)%                 (2.0)%                  2.1%                        (46.1)%

            EMEAA                       (64.8)%                 (65.0)%                  2.0%                   3.1%                        (67.5)%                 • Fee revenue growth impacted by lower levels of incentive
                                                                                                                                                                      management fee income

            Greater
                                        (40.5)%                 (44.0)%                  6.4%                  10.7%                        (43.8)%
            China

            Total                       (52.5)%                 (52.7)%                  0.3%                   3.6%                        (45.0)%

     1 Underlying   fee revenue and excludes owned, leased and managed lease hotels, significant liquidated damages, current year disposals, System Fund results and hotel cost reimbursements at constant 2020 exchange rates (CER).
     2   Underlying fee business Total RevPAR and available rooms.

39
Fee margin1 by region

         Americas                                                                                                                       Europe, Middle East, Asia and Africa

       FY 2020                                                                 70.7%                                                    FY 2020 -17.9%

       FY 2019                                                                       77.7%                                              FY 2019                                                                                      58.6%

         Greater China                                                                                                                    Total IHG

       FY 2020                                                             45.5%                                                          FY 2020                                               34.1%

       FY 2019                                                                       54.1%                                                FY 2019                                                                      54.1%

     1 Fee  margin excludes owned, leased and managed lease hotels, significant liquidated damages and the results of the Group’s captive insurance company; is stated at AER.
     For Americas, consists of fee business revenue and operating profit of $457m (2019: $853m) and $323m (2019: $663m) respectively. For Europe, Middle East, Asia and Africa consists of fee business revenue and operating profit as adjusted for
     significant liquidated damages of $106m (2019: $326m) and $(19)m (2019: $191m) respectively. For Greater China consists of fee business revenue and operating profit of $77m (2019: $135m) and $35m (2019: $73m) respectively.

40
Revenue and operating profit 2019-2020

                                                  Total Revenue         Total Operating Profit
                             Actual US$                 Full Year                Full Year
                                                  2020         2019       2020          2019

                 Fee Business                     457            853       323           663
                 Owned, Leased & Managed Leases    55            187       (27)           37
                 Total Americas                   512           1,040      296           700

                 Fee Business                     107           337        (18)          202
                 Owned, Leased & Managed Leases   114           386        (32)           15
                 Total EMEAA                      221           723        (50)          217

                 Fee Business                      77           135         35               73
                 Total Greater China               77           135         35               73

                 Central Results                  182            185       (62)          (125)
                 Total Reportable Segments        992           2,083      219            865

                 Reimbursement of Costs           637           1,171        -             -
                 System Fund                      765           1,373      (102)         (49)

                 Total IHG                        2,394         4,627      117           816

41
Currency translation

                                                                     Reportable Segments                                                                        Reportable Segments
                                                               Reported FY 2020 vs FY 2019 rates2                                               FY 2020 at average Jan 2021 rate vs reported FY 20203
     Region1
                                                               Revenue                                           EBIT                                        Revenue                                              EBIT

     Americas                                                     $(1)m                                              -                                           $1m                                                  -

     EMEAA                                                         $1m                                           $(1)m                                          $10m                                                  -

     Greater China                                                 $2m                                            $2m                                            $4m                                               $1m

     Central Overheads                                                -                                              -                                           $2m                                              $(3)m

     Total IHG                                                     $2m                                            $1m                                           $17m                                              $(2)m

 1Major non USD currency exposure by region (Americas: Canadian Dollar, Mexican Peso; EMEAA: British Pound, Euro, Russian Rouble, Japanese Yen, Singapore Dollar; Greater China: Chinese Renminbi; Central: British Pound). 2 Based on
 monthly average exchange rates each year. 3 Jan average rates: 0.73 USD:GBP; 0.82 USD:EUR.

42
2020 notable items
             2020 items
             Payroll tax credits                                                                                                                                            Americas                                                   $8m

             Litigation settlement in relation to a single hotel                                                                                                            Americas                                                   $4m

             Individually significant Liquidated Damages1                                                                                                                     EMEAA                                                    $1m

             Gain on disposal of Holiday Inn Melbourne Airport                                                                                                                EMEAA                                                    $3m

     1 In   February 2018, IHG received liquidated damages totalling $15m relating to the termination of a portfolio of 13 open hotels (2k rooms) and 6 pipeline hotels (1k rooms) in Germany, which exited IHG’s system in Q1 2020.

43
Exceptional items
     Category          Detail                                 Rationale                                                                                         Charge ($m)
                                                              • Primarily, discounted value of deposits and loans held by owners in connection to managed
                       Trade deposits and loans                                                                                                                    (48)
                                                                hotels
                                                              • Predominantly, the carrying book value of owned, leased and managed leased assets in the
                       Property, plant and equipment                                                                                                               (90)
                                                                Americas and EMEAA
                       Intangible assets                      • Acquired open and pipeline management agreements                                                   (48)
       Impairment      Contract assets                        • Key money and remaining undiscounted amount of trade deposits and loans                            (53)
                                                              • Stakes in associates held by IHG; shown net of a $4m fair value gain on a put option over
                       Investment in associates                                                                                                                    (19)
                                                                part of IHG’s investment in the New York Barclay associate
                       Right-of-use assets                    • Relates to an individual leased hotel and US corporate headquarters                                (16)
                       Derecognition of right of-use-assets                                                                                                        (49)
                                                              • Resulting from leases now being recognised as fully variable
                       Derecognition of lease liabilities                                                                                                           71

     Cost of sales &   Onerous expenditure provision          • In respect of committed contractual expenditure                                                    (10)
         admin         Acquisition and integration costs      • Relates to Six Senses acquisition                                                                   (6)
       expenses
                       Reorganisation costs                   • Relate to the UK portfolio, other owned and leased hotels and corporate reorganisation             (27)
                                                              • Cost of settlement relating to a lawsuit in EMEAA, offset by release of prior year amounts in
                       Litigation                                                                                                                                   (5)
                                                                Americas
                       Gain on lease termination              • Related to the termination of a lease agreement with Services Properties Trust                      30
     Total operating exceptional items                                                                                                                             (270)

     Non-operating     Fair value gains on contingent purchase consideration                                                                                        21
       expenses        Financial expenses arising from the premium on early repayment of £227m on bonds due in 2022                                                (14)
     Total exceptional items before tax                                                                                                                            (263)

44
FY20 Cash flow and net debt

                                                          44
               329                                                            (87)
                                    21

                                                                                                  (171)

                                                                                                                        136                                                                                                                            136

                                                                                                                                            (107)                                                                                 125
                                                                                                                                                                   29
                                                                                                                                                                                       (35)                  17
           EBITDA1           System    Fund2         Working        Exceptional              Interest & tax        Free cash            Maintenance         Free cash flow          System              Recyclable             Lease                Decrease
                                                  capital & other cash flow items4                                flow before           capex & key                               Fund capex              capex           movements, FX            in net debt
                                                   movements 3                                                    maintenance             money                                                                           and other items5
                                                                                                                   capex and
                                                                                                                   key money

         • Decrease in free cash flow to $29m driven by the impact of Covid-19 on EBITDA; free cash inflow of $95m in H2
         • Reduction in net debt driven by derecognition of lease liabilities from the balance sheet, partially offset by FX movements
     1 Before exceptional items and System Fund result. 2 System Fund inflow reflects $102m in-year deficit adding back $20m reorganisation costs, $41m impairment charges, $62m of depreciation and amortisation. 3 Includes working capital & other movements
     ($68m), loyalty programme deferred revenue net movement ($12m), Equity-settled share-based cost ($32m), retirement benefit contributions, net of cost ($(3)m) and principal element of lease payments ($(65)m). 4 $45m relating to reorganisation costs ($15m
     relating to the System Fund). 5 Includes $230m lease movements and $101m adverse foreign exchange and other adjustments.

45
Free cash flow generation
         $m                                                                                                           12 months to 31 Dec 2020                    12 months to 31 Dec 2019

         Operating profit from reportable segments1                                                                                               219                                         865
         System Fund result2                                                                                                                     (82)                                        (21)
         Depreciation & amortisation3                                                                                                             172                                         170
         System Fund impairment charges                                                                                                            41                                               -

         Working capital & other movements                                                                                                         68                                        (82)

         Loyalty programme deferred revenue net movement                                                                                           12                                             52
         Equity-settled share-based cost                                                                                                           32                                             42
         Retirement benefit contributions, net of cost                                                                                             (3)                                            (3)
         Purchase of shares by employee share trusts                                                                                                 -                                            (5)
         Cash flows relating to exceptional items4                                                                                               (87)                                        (55)
         Net interest paid & similar charges                                                                                                    (130)                                       (107)
         Tax paid5                                                                                                                               (41)                                       (141)

         Principal element of lease payments                                                                                                     (65)                                        (59)

         Capital expenditure: key money                                                                                                          (64)                                        (61)

         Capital expenditure: maintenance                                                                                                        (43)                                        (86)

         Free cash flow                                                                                                                            29                                         509

         1.   Before System Fund result and exceptional items.
         2.   System Fund result stated before exceptional cost of $20m relating to the Group reorganisation. 2019 includes $28m in relation to efficiency programme.
         3.   Includes System Fund depreciation & amortisation of $62m (12 months to 31 December 2019 $54m).
         4.   Includes $45m relating to reorganisation ($15m in relation to the System Fund). 2019 includes $46m in relation to the efficiency programme ($28m in relation to the System Fund).
         5.   Excludes tax paid on disposals.

46
Uses of free cash flow

                                                                                 12 months to 31   12 months to 31
                    $m                                                                 Dec 2020          Dec 2019
                    Free cash flow                                                           29               509

                    Capital expenditure: Recyclable investments                              (6)              (19)

                    Capital expenditure: System Fund investment                             (35)              (98)

                    Acquisitions                                                               -             (292)

                    Payment of contingent purchase consideration                               -               (8)

                    Distributions from associates and joint ventures                          5                  -

                    Disposal receipts and repayments of other financial assets               18                 4

                    Ordinary dividend                                                          -             (211)

                    Special dividend                                                           -             (510)

                    Dividends paid to non-controlling interests                                -               (1)

                    Currency swap proceeds                                                    3                  -

                    Transaction costs relating to shareholder returns                          -               (1)

                    Net cash inflow/(outflow)                                                14              (627)

                    Exchange, lease repayments & other non-cash items                       122               (73)

                    Opening net debt                                                     (2,665)           (1,965)

                    Closing net debt                                                     (2,529)           (2,665)

47
Reduction in gross capital expenditure for FY 2020

                                                          $m                                                           FY 2020                     FY 2019                       • Key money: used to secure hotel
                 Maintenance capex,                       Maintenance capex                                               (43)                         (86)                        signings
               key money and selective
                                                          Key money1                                                      (64)                         (61)                      • Maintenance: relates to owned,
                    investments                                                                                                                                                    leased and managed lease hotels and
                                                          Total                                                          (107)                        (147)
                                                                                                                                                                                   corporate infrastructure

                                                          $m                                                           FY 2020                      FY 2019
                                                                                                                                                                                 • Investment behind growth initiatives
                                                          Gross out                                                        (6)                         (19)
                          Recyclable                                                                                                                                             • Profile can vary year to year, but
                         investments                      Gross in                                                         23                            4                         expected to be broadly neutral over
                                                          Net total                                                        17                          (15)                        time

                                                          $m                                                           FY 2020                     FY 2019
                                                                                                                                                                                 • Invested into projects that benefit our
                                                          Gross out                                                       (35)                        (98)                         hotel network e.g. GRS
                  System Fund capital
                      investments                         Gross in2                                                        58                           49                       • Repaid when depreciation charged to
                                                          Net total                                                        23                         (49)                         System Fund

                                                          Gross total3                                                   (148)                        (265)
                Total capital investments
                                                          Net total                                                       (67)                        (211)
 1   Key money presented net of repayments of $nil (2019: $1m); 2 Consists of deprecation and amortisation of $62m in 2020 and $54m in 2019, adjusted to exclude right of use assets. 3 Includes gross key money payments of 2020: $64m and 2019: $62m.

48
CAUTIONARY NOTE REGARDING FORWARD-LOOKING STATEMENTS

     This presentation may contain projections and forward looking-statements. The words “believe”, “expect”, “anticipate”,
     “intend” and “plan” and similar expressions identify forward-looking statements. All statements other than statements of
     historical facts included in this presentation, including, without limitation, those regarding the Company’s financial
     position, potential business strategy, potential plans and potential objectives, are forward-looking statements. Such
     forward-looking statements involve known and unknown risks, uncertainties and other factors which may cause the
     Company’s actual results, performance or achievements to be materially different from any future results, performance
     or achievements expressed or implied by such forward-looking statements. Such forward-looking statements are
     based on numerous assumptions regarding the Company’s present and future business strategies and the
     environment in which the Company will operate in the future. Further, certain forward-looking statements are based
     upon assumptions of future events which may not prove to be accurate. The forward-looking statements in this
     document speak only as at the date of this presentation and the Company assumes no obligation to update or provide
     any additional information in relation to such forward-looking statements.

     The merits or suitability of investing in any securities previously issued or issued in future by the Company for any
     investor’s particular situation should be independently determined by such investor. Any such determination should
     involve, inter alia, an assessment of the legal, tax, accounting, regulatory, financial, credit and other related aspects of
     the transaction in question.

49
You can also read