Title: Circadian control of lung inflammation in influenza infection - bioRxiv
←
→
Page content transcription
If your browser does not render page correctly, please read the page content below
bioRxiv preprint first posted online Aug. 21, 2018; doi: http://dx.doi.org/10.1101/396556. The copyright holder for this preprint
 (which was not peer-reviewed) is the author/funder, who has granted bioRxiv a license to display the preprint in perpetuity.
                                    All rights reserved. No reuse allowed without permission.

        Title: Circadian control of lung inflammation in influenza infection
        Shaon Sengupta1,5, Soon Yew Tang2,5, Jill Devine1, Soumyashant Nayak6, Shirley
        Zhang3, Alex Valenzuela4, Carolina B. Lopez4, Gregory Grant6, Garret A. FitzGerald2

        Author affiliation:
        1- Department of Pediatrics, University of Pennsylvania Perelman School of Medicine
        2- Soon Yew Tang: Systems Pharmacology University of Pennsylvania Perelman School
        of Medicine
        3 - Department of Neuroscience, University of Pennsylvania Perelman School of
        Medicine
        4 - University of Pennsylvania Veterinary School
        5- Institute of Translational Medicine and Therapeutics (ITMAT)
        6- Department of Genetics, University of Pennsylvania Perelman School of Medicine

        Abstract
        Influenza is a leading cause of respiratory mortality and morbidity. While inflammation is
        necessary for fighting infection, a fine balance of anti-viral defense and host tolerance is
        necessary for recovery. Circadian rhythms have been known to modulate inflammation.
        However, the importance of diurnal variability in the timing of influenza infection is not
        well understood. Here we demonstrate that endogenous rhythms influence the cellular
        response to infection in bronchoalveolar lavage (BAL), the pulmonary transcriptomic
        profile and lesional histology. This time dependent variability does not reflect alterations
        in viral replication. Rather, we found that better time-dependent outcomes were
        associated with a preponderance of NK and NKT cells and lower proportion of
        monocytes in the lung. Thus, host tolerance, rather than viral burden underlies the
        diurnal gating of influenza induced lung injury.
        Significance statement:
        Our work demonstrates the importance of circadian rhythms in influenza infection -- a
        condition with significant public health implications. Our findings, which establish the role
        of the circadian rhythms in maintaining the balance between host tolerance pathways
        and anti-viral responses confers a new framework for evaluating the relevance of
        circadian influences on immunity.
        \body
        Introduction
        Circadian rhythms constitute an innate anticipatory system with a 24-hr periodicity that
        helps the organism adapt to its surroundings and hence improve survival. At the
        molecular level, circadian rhythms are controlled by oscillating core clock genes, which
        regulate rhythmic expression of their downstream targets(1). Many physiological
        processes including immune responses(2-5) are under circadian regulation.
        Inflammation is a critical part of the immune response to influenza. An ineffective
        inflammatory response hinders viral clearance; however a high level of inflammation
        injures the host(6).(7) Due to its role in maintaining overall homeostasis, the circadian
        regulatory system may act to provide the host such a balance.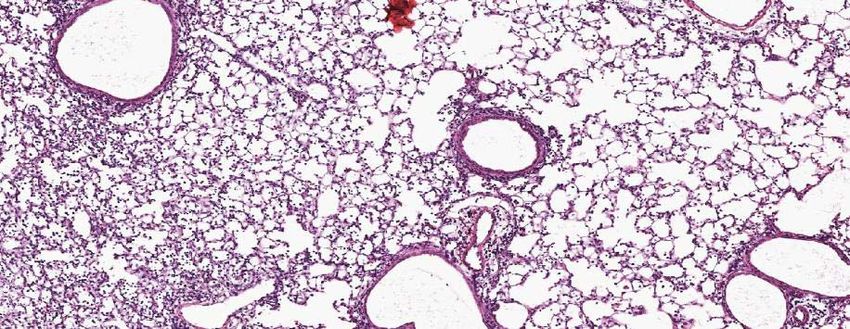
bioRxiv preprint first posted online Aug. 21, 2018; doi: http://dx.doi.org/10.1101/396556. The copyright holder for this preprint
 (which was not peer-reviewed) is the author/funder, who has granted bioRxiv a license to display the preprint in perpetuity.
                                    All rights reserved. No reuse allowed without permission.

        Although the role of circadian regulation in systemic viral infections(8) has been
        described using Murid herpes virus (MHV)(9) and Vesicular Stomatis Virus (VSV)(10), its
        purview for respiratory viruses is limited(11). Some in vitro work(9) and results of a
        cluster-randomized study testing the efficacy of influenza vaccine in older adults(12)
        have suggested a role for circadian rhythms in influenza A infection. Influenza infection
        is a leading cause of respiratory morbidity and mortality. However, the role of circadian
        rhythms in lung inflammation induced by influenza infection has yet to be systematically
        evaluated.
        In this study, we tested whether the outcome of influenza A infection (IAV) was
        influenced by the time of infection, to understand whether the molecular clock might help
        balance host tolerance and the anti-viral response to IAV.
        Results
        Time of infection determines disease progression and survival. To ascertain
        whether the time of infection determines mortality and morbidity from influenza A
        infection, C57BL/6J mice (male and females in approximately equal numbers) were
        infected either just before the onset of their active phase/ lights off (active phase: ZT11)
        or just prior to the onset of their rest phase/lights-on (ZT23) with same dose of IAV (PR8
        strain) intranasally (i.n.) (Fig. 1A). Animals were weighed and monitored daily for 2
        weeks to record disease progression. Mice infected at ZT11 had significantly higher
        mortality (71% in ZT11 vs 15% at ZT23) than mice infected at ZT23 (Fig. 1B).
        Furthermore, after day 4 post-infection (p.i.) mice infected at ZT11 had more weight loss
        than mice infected at ZT23 (Fig 1C). These results were confirmed with mice on inverted
        light-dark cycle, where we were able to infect both groups simultaneously (data not
        shown). We also recorded clinical scores based on activity level, behavior and
        respiratory distress (Table. S1) and found higher scores consistent with increased
        morbidity and mortality (Fig. 1D) in mice infected at ZT11.
        These data are consistent with the hypothesis that the susceptibility to IAV induced
        mortality and morbidity depends on the time of day at infection.
        The temporal gating of IAV induced disease is circadian: To show that the diurnal
        differences in mortality and morbidity were due to endogenous circadian regulation as
        opposed to the effect of light:dark cycles, we repeated the above experiment in mice
        housed in constant darkness. The mice were infected with IAV at either CT23 or CT11
        (which corresponds to the beginning of the rest phase and of the active phases
        respectively) with the same dose of IAV as above. We found that mice infected at CT11
        had significantly higher mortality than the mice infected at CT23 (Fig. 1E), consistent
        with endogenous circadian rhythms controlling the outcome of the IAV infection.
        The time of day at infection affects viral clearance but not viral replication. To test
        if the difference in the outcomes were driven by a varying rate of viral replication, we
        measured viral titers in the lungs on days 2, 4, 6, 8 p.i. The titers were not different in the
        two groups at the earlier time points (Fig. 2A) when viral replication is known to peak
        (days 2,4 and 6). By day 8 p.i., more mice infected at ZT23 had cleared the virus than
        those infected at ZT11. Therefore, it is unlikely that the differences in mortality and
        weight trajectories can be attributed to viral replication, because clearance follows rather
        than precedes the mortality and morbidity observed. Thus, despite inciting higher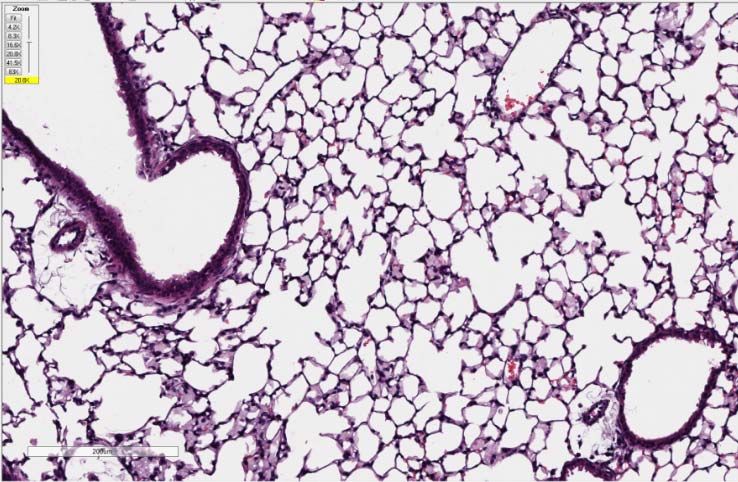
bioRxiv preprint first posted online Aug. 21, 2018; doi: http://dx.doi.org/10.1101/396556. The copyright holder for this preprint
 (which was not peer-reviewed) is the author/funder, who has granted bioRxiv a license to display the preprint in perpetuity.
                                    All rights reserved. No reuse allowed without permission.

        inflammation in the ZT11 group, viral clearance is delayed. Further, since several
        previous studies have reported higher morbidity and mortality in females(13, 14), we
        also stratified the experiment by gender but observed no difference in viral kinetics. (Fig.
        2B).
        Circadian gating of IAV-induced mortality and morbidity is associated with lung
        inflammation. Since there were no differences in the pulmonary viral loads between the
        groups infected at ZT11 and ZT23, we compared the extent of inflammation in these two
        groups. Mice infected at ZT11 had higher total BAL cell counts as early as 2 p.i. but this
        persisted even on day 6 (Fig. 3A & D). Further, we also collected BAL at 4-8hr intervals
        across 24 hrs from day 2 to day 3 p.i.. The total BAL cell counts were higher in the ZT11
        group across all time points, proving that infection at ZT11 promoted more inflammation
        and this was not a function of time of dissection (Fig. 3A). However, there were no
        significant differences in the differential counts between the two time points (Fig. 3A &
        C). At baseline however, the BAL cell count did not oscillate across time (Fig. S2),
        although circadian oscillations in CD45+ cells have been reported in dissociated whole
        lung preperations(15).
        Mice infected at ZT11 had more lung injury on both days 2 and 6 p.i. (Fig.3B & 3D)
        based on more peri-bronchial inflammation, peri-vascular inflammation, inflammatory
        alveolar exudates and epithelial necrosis. Similar effects were also seen with X31 strain
        of influenza virus, suggesting that these effects are not restricted to one strain but rather
        reflect the circadian control of influenza infection overall (Fig S3). We assayed for a
        cytokine panel in the BAL on day 6 that correlates with peak viral load in the lung. There
        were no significant differences in the levels of cytokines Il6, Tnfα, Ccl5 or Ccl2 (Fig S4,
        3E). However, the levels of Il4 were higher in the group infected at ZT11 than those
        infected at ZT23 (Fig. 3E). Il4 is associated with the development of type-2 adaptive
        immunity which is suboptimal for viral clearance in other respiratory viruses, such as
        rhinovirus(16). Thus, higher Il4 in the ZT11 group would be expected with the worse
        outcomes observed. IL10, a cytokine that suppresses inflammation in acute
        influenza(17), was higher in ZT23 group than ZT11. We speculate that the cytokines
        may peak later; we were not able to detect difference in other cytokines at this point.
        Interestingly, when we challenged mice with i.n. polyinosinic:polycytidylic acid (Poly I:C),
        a TLR3 ligand, at either ZT23 or ZT11, the results were reversed (Fig. S5), with mice
        infected at ZT23 exhibiting worse lung injury and higher total BAL cell counts. This
        finding suggests that the difference in outcomes in mice injected with IAV at different
        time points is not likely due to pathways downstream of TLR3. Considered together, our
        results are consistent with the hypothesis that endogenous circadian rhythms determine
        mortality and pathology in IAV infection by modulating the inflammatory response, rather
        than through an impact on viral load in the lung.
        The circadian gating of IAV infection is associated with a distinct transcriptomic
        signature: To determine whether the circadian control of IAV infection might be
        regulated at the transcriptomic level, we performed RNA sequencing of the whole lungs
        from mice infected with either IAV or PBS at ZT23 or ZT11 on day 6 p.i.. We chose this
        time point for transcriptomic analysis because the weight loss trajectories had clearly
        diverged but the levels of cytokines were not significantly different between the two
        groups. This would allow us to identify pathways that might explain the difference in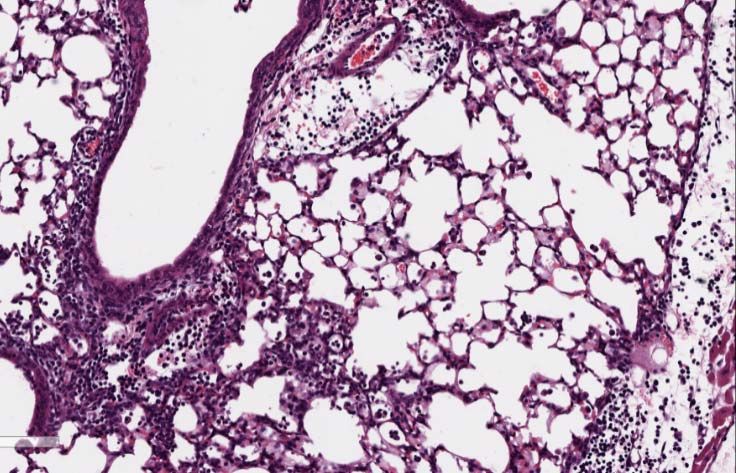
bioRxiv preprint first posted online Aug. 21, 2018; doi: http://dx.doi.org/10.1101/396556. The copyright holder for this preprint
 (which was not peer-reviewed) is the author/funder, who has granted bioRxiv a license to display the preprint in perpetuity.
                                    All rights reserved. No reuse allowed without permission.

        outcomes.
        Of a total 29,114 genes, 4667 had a ≥ 2-fold difference between the two IAV-infected
        groups. Although our experimental design was not set up to detect circadian rhythms in
        gene expression, 184 genes had a ≥ 2-fold difference from the control groups at ZT23
        and ZT11 (Fig. 4A). Mice infected at ZT11 had a distinct transcriptomic profile compared
        to all other groups (Fig. 4B). As expected, innate immune pathways involving cell
        migration and pattern recognition are among the most enriched and are consistent with
        innate immunity-mediated circadian gating of the flu infection (Table 1). Further
        pathways enriched in the transcriptomic analyses, included various aspects of innate
        immunity and the “Role of hypercytokinemia/hyperchemokinemia in pathogenesis of
        Influenza”. Consistent with our other results and the literature (18, 19), the transcriptomic
        analyses provide further evidence that a state of hyper-inflammation is induced by
        infection at ZT11, to which the host eventually succumbs (Fig. 4B & 4C).
        NKT cells and NK cells are associated with the temporal gating on influenza
        infection. To identify which cell types mediate the circadian difference in the response
        to IAV, we determined the proportion of CD45+ populations in the lungs of mice infected
        at either ZT11 or ZT23 on days, 1, 2, 4, 6 and 8. First, similar to our results from BAL
        analyses, we found that mice infected at ZT11 had a higher total CD45+ cell count in the
        early phase of infection (days 1-4) (Fig. 4D). There were no significant differences in the
        numbers or percentage of macrophages, neutrophils or CD11b+ DCs in the lungs,
        between the two groups (Fig. 4E & 4F). The percentage of CD45+ NK1.1+LysG- cells
        was higher in the ZT23 group than the ZT11 on days 1-4 p.i.. While both NK cells
        (CD45+LysG--Nk1.1+CD3-) and NKT cells (CD45+LysG--Nk1.1+CD3+) were higher in the
        ZT23 group, the latter seemed more significantly associated with time of infection. (Fig.
        4G; p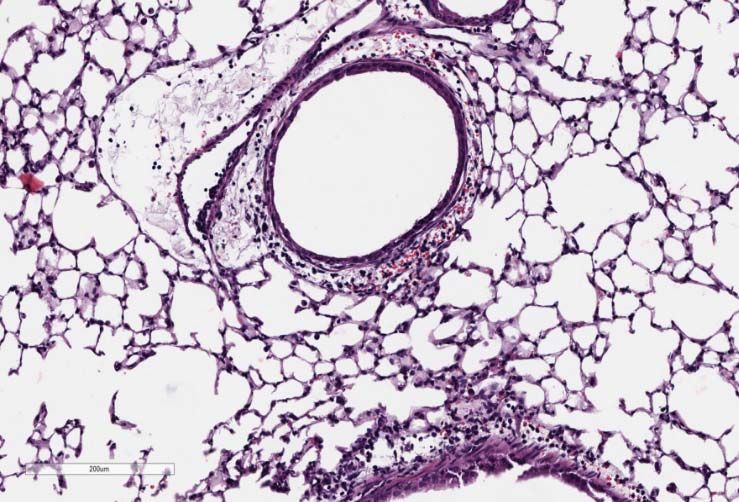
bioRxiv preprint first posted online Aug. 21, 2018; doi: http://dx.doi.org/10.1101/396556. The copyright holder for this preprint
 (which was not peer-reviewed) is the author/funder, who has granted bioRxiv a license to display the preprint in perpetuity.
                                    All rights reserved. No reuse allowed without permission.

        of total lung CD45+ cells – evidence for increased inflammation. Pathway analyses of
        whole lung transcriptomic data are also consistent with higher inflammation causing the
        disparity in outcomes between infection at ZT11 vs ZT23. Moreover, early in infection,
        when the weight loss and mortality trajectories have diverged in the ZT11 and ZT23
        groups, there is no significant difference in viral titers. This contrasts with prior studies of
        other pathogens that attribute the cause of circadian variability in response to variation in
        abundance of pathogen or its direct replication in the host(9, 11). Gibbs et al, reported a
        difference in the bacterial load within 24-48 hrs of infection with Streptococcus
        pneumonia. More relevant to viral replication in vivo- Ehlers et al reported that antiviral
        activity tracked with viral nucleic acid abundance in Sendai virus infection in Bmal1-/-
        mice where the clock is disrupted. Similarly, viral replication in the host was responsible
        for the circadian control of infection by a luciferase-expressing Murid Herpes strain(9) in
        mice and for influenza in Bmal1-/- fibroblasts.(25)
        We determined viral load by infectivity assay(26), which is directly determines viral
        activity. This is preferable to the determination of viral loads through viral RNA
        expression, which may be confounded by other factors, such as the presence of
        defective viral genomes (DVG). Overall, our results are consistent with existing reports
        that mortality in influenza infection may be caused the extensive activation of immune
        pathways(27), rather than just viremia or extra-pulmonary effects(27-29).
        The temporal gating of the host’s response to influenza infection is also supported by
        some recent trials where the antibody response correlated with the time of
        vaccination(12, 23). IAV, in turn, seems may influence host circadian rhythms (30, 31).
        In our study, NK and NKT cells were higher in the ZT23 group than in the ZT11 group,
        early in the infection’s course. NK cells have direct cytolytic activity towards virally
        infected cells and accumulate at the site of infection, peaking around days 4-5 p.i. which
        is consistent with our results. Mice lacking NCR1, the predominant activating NK cell
        receptor succumbed to IAV early on, supporting the protective role of activating NK
        receptors in IAV(32). Further, NK cells and cytolytic function has been shown to be
        under circadian control in both humans(33) and animal models(34-36). In splenocytes
        obtained from Per1-/- mutant mice the rhythms of cytolytic activity, cytokines and cytolytic
        factors (such as granzyme B and perforin) and gene expression was significantly
        altered(35, 36). In the lungs of rats exposed to chronic jet lag, NK cytolytic activity was
        suppressed and tumor growth was stimulated(34). Thus, the existing literature is
        consistent with a role for NK cells in the circadian regulation of immune system, although
        not much is known about NKT cells in this context. However, given that the expression
        of gzmb and prf1 were not significantly different between the two groups [Fig S8], we
        speculate that in our model NK cells may be acting primarily through non-cytolytic or
        immunosuppressive pathways. The second possibility is that the augmented balance
        between NK cells and Ly6Chi monocytes in the ZT23 group may favor a milieu conducive
        to efficient viral clearance and a well-contained state of inflammation. Our results are
        consistent with other reports where monocytes have been shown to induce excessive
        inflammation by different agents (Listeria and VSV) in other organs(3, 10). In one model,
        the core clock gene Bmal1 induced Ccl2(3) while in another Rev-erbα suppressed
        Ccl2(10, 37). The exact mechanisms underlying the role of both NK and NKT cells in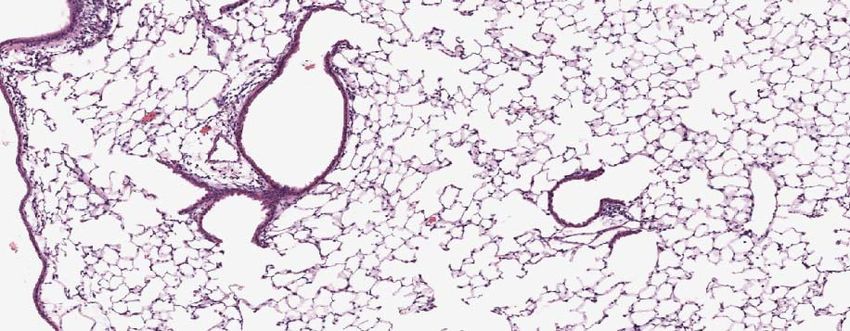
bioRxiv preprint first posted online Aug. 21, 2018; doi: http://dx.doi.org/10.1101/396556. The copyright holder for this preprint
 (which was not peer-reviewed) is the author/funder, who has granted bioRxiv a license to display the preprint in perpetuity.
                                    All rights reserved. No reuse allowed without permission.

        mediating circadian regulation of lung inflammation may be specific to influenza. This
        remains to be elucidated.
        Several studies aiming to link the circadian clock with inflammation use disruption of the
        non-redundant core clock gene, Bmal1 (5, 9, 11, 30, 31, 38, 39) to implicate the
        molecular clock. However, Bmal1 has a wide range of “non-circadian” effects(40). We
        suspect that some of these off-target effects specific to Bmal1 may have resulted in the
        differences between our conclusions and those of other reports. Although weight loss
        was more profound in both models of Bmal1 deficiency (vs WT), but not in Per2-/- mice,
        the effect was larger in magnitude in the embryonic Bmal1-/- mice than in the adult-
        inducible model (Bmal1fl/flERcre) supporting a confounding role of non-circadian functions
        of Bmal1(11).
        There is an abnormally high neutrophilic response in response to LPS mediated by
        Cxcl5, in mice where Bmal1 was deleted specifically in the ciliated club cells of the lung
        (CCSP-Bmal1). However, in response to Listeria, Nyugen et al(3) noted a
        preponderance of inflammatory Ly6chi monocytes in the spleen of Bmal1lLoxp/LoxPLyz2Cre
        mice. More recently, Poullaird et al, noted increased neutrophils in response to LPS in
        Rev-erbα-/- mice at ZT0 but not at ZT4(41). While it is probable that neutrophils may
        serve as the effector cells for the circadian regulation of TLR4 signaling pathways(39,
        41, 42) this mechanism does not underlie the response to viruses. In fact, in a global
        Bmal1-/- mice, there was no significant differences between the cellular responses to
        Sendai Virus(11).In other studies, the effect of Bmal1 on viral nucleic acid expression(9)
        or mortality(30) was described, but specific cellular mediators in the host’s immune
        repertoire were not examined. In mechanisms specific to circadian regulation of viral
        infections, oscillations of the pattern recognition receptor, TLR9 has been reported(43).
        In conclusion, our work demonstrates that time dependent regulation of influenza
        infection and its consequences are mediated by circadian regulation of host tolerance
        pathways and not directly through viral replication. Most therapeutic strategies for
        influenza are directed towards elimination of the virus. Targeting host tolerance via
        circadian-controlled pathways, may provide novel therapeutic possibilities. Although the
        circadian system may regulate the host response to many pathogens, it seems that the
        nature of the interaction varies with each dyad. Specific elucidation of how each
        infectious agent intersects with the host circadian machinery may be necessary to
        uncover therapeutic opportunities to modulate the relevant immune response.
        Methods
        Mice, Virus and Infection: Specific pathogen-free 8-12 week old C57bl/6J mice were
        purchased from Jackson lab. For influenza infections, mice were lightly anesthetized
        with isoflurane and infected intranasally (i.n.) with 30-70 PFU (based on body weight;
        LD50 is 100PFU) of PR8 strain or 104 PFU of X31 strain of influenza virus, respectively,
        in a volume of 40 µl. For serial evaluations (for weights, scores, titers and cell counts)
        animals were assessed at the same interval from the time of infection. All animal studies
        were approved by the University of Pennsylvania animal care and use Committee and
        met the stipulations of the Guide for the care and Use of Laboratory animals. For
        experiments described in Fig 1 (A-C), animals were kept under 12hr LD cycles.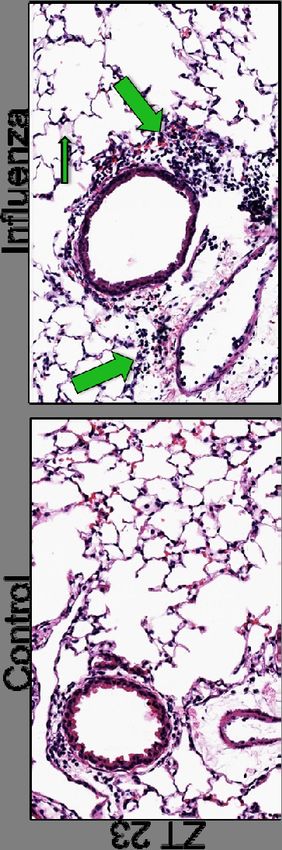
bioRxiv preprint first posted online Aug. 21, 2018; doi: http://dx.doi.org/10.1101/396556. The copyright holder for this preprint
 (which was not peer-reviewed) is the author/funder, who has granted bioRxiv a license to display the preprint in perpetuity.
                                    All rights reserved. No reuse allowed without permission.

        Viral Titration: Lungs were harvested at different time points following infection, as
        indicated in the specific experiment. Lungs were extracted, homogenized in PBS-gelatin
        (0.1%), and frozen for preservation. The presence of influenza virus was evaluated using
        MCDK cells with 1:10 dilutions of the lung homogenates at 37oC. After 1 h of infections,
        175 µl of media containing 2µg/ml trypsin was added and the cells were further
        incubated for 72h at 37oC. A total of 50 µl of medium was then removed from the plate
        and tested by hemagglutination of chicken red blood cells (RBCs) for the presence of
        virus particles. The hemagglutination of RBCs indicated the presence of the virus.
        Flow cytometry: Lungs were harvested after PBS perfusion through the right ventricle.
        The lungs were digested using DNAse II (Roche) and Liberase (Roche) at 37oC for 30
        mins. Dissociated lung tissue was passed through a 70 um cell strainer, followed by
        centrifugation and RBC lysis. Cells were washed and re-suspended in PBS with 2%
        FBS. (Details of the antibodies in table S1). 2-3 x 10⁶ cells were blocked with 1ug of anti-
        CD16/32 antibody and were stained with indicated antibodies on ice for 20-30 minutes.
        No fixatives were used. Flowcytometric data was acquired using FACS Canto flow
        cytometer and analyzed using FlowJo software (Tree Star, Inc.). All cells were pre-gated
        on size as singlet live cells. All subsequent gating was on CD45+ in lung only.
        Neutrophils were identified as live, CD45+, Ly6G+ cells. Ly6Chi monocytes were identified
        as live, CD45+Ly6G-Ly6ChiCD11b+ cells. NK cells were identified as CD45+Ly6G-LysC-
        NK1.1+ cells. In some experiments where indicated in the figure legend, an exclusion
        gate for neutrophils and T, cells (Ly6G, CD4 and CD8) was applied. Alveolar
        macrophages were identified as CD45+ Ly6G- Siglec F+; DCs were identified as live,
        CD45+Ly6G-SiglecF-CD11c+MHCII+ cells and further classified into CD103+ conventional
        DCs or CD11b+ DCs. Day 6 onwards, T cells were identified in mediastinal LNs as
        CD45+, either CD4+ or CD8+ cells. Activated cells were further differentiated as CD44+,
        CD62Llo. Gating strategy shown in Fig S5 and S6.

        Histology and BAL cytology: Flu infected and control mice were euthanized by CO2
        asphyxiation and their tracheas cannulated with a 20 G flexible catheter (Surflo, Terumo,
        Philippines). The lungs were gently lavaged with 600ul of PBS in four passes. The
        supernatant from the first pass was collected and used for cytokine analyses. The cells
        from all four passes was pooled and re-suspended in 1 ml of PBS and counted using a
        Nexcelcom cell counter. Lungs were fixed by inflation with 10% buffered formalin at 20
        mm H2O of pressure, paraffin embedded and stained with HE stain and PAS. Stained
        slides were digitally scanned at 63 x magnification using an Aperio CS-O slide scanner
        (Leica Biosystems, Chicago IL). Representative images were taken from scanned slides
        using Aperio ImageScope v12.2.2.5015 (Leica Biosystems, Chicago IL)
        BAL cytokine quantification: Customized panels of chemokine/cytokine were
        designed using MILLIplex Multiplex Assay and measured using Luminex (EMD Millipore)
        using the RIA core at the Institute for Diabetes, Obesity and Metabolism, University of
        Pennsylvania.
        Statistics: All statistical analyses were performed using STATA 11.0. Unpaired t-test or
        ANOVA was used for normally distributed data while Mann-Whitney as used for data
        without a normal distribution and for discrete scores (for lung histology).
        PCRs and Primers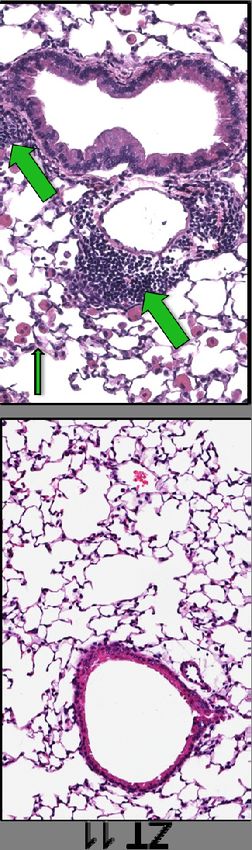
bioRxiv preprint first posted online Aug. 21, 2018; doi: http://dx.doi.org/10.1101/396556. The copyright holder for this preprint
 (which was not peer-reviewed) is the author/funder, who has granted bioRxiv a license to display the preprint in perpetuity.
                                    All rights reserved. No reuse allowed without permission.

        RNAseq: RNA was extracted from whole lung homogenate using the RNA MiniElute kit
        as per the manufacturer’s protocol. QC was performed and only samples with RINs > 7
        were used for sequencing. Library preparation was performed on 400 ng DNAse-treated
        RNA using the Illumina Truseq kit. Sequencing was done using HiSeq 2500 sequencer
        (Illumina) housed at BGI, CHOP to generate 2X100 strand specific paired-end reads.
        We obtained 30-50 mi pairs of reads per sample. Samples were aligned to a mouse
        reference genome on an in-house resampling-based normalization & quantification
        pipeline(44) and compared to existing gene annotations (ENSEMBL) to identify novel
        loci and isoforms. Differentially expressed genes were identified using a false discovery
        rate-based control for multiple testing. Finally, Ingenuity & GSEA were used to assess
        fully effects on key pathways and mediators.
        Quantitative PCR:
        TaqMan gene-expression assays were used to measure mRNA levels for genes of
        interest. Eukaryotic 18S rRNA or GAPDH (both from Life Technologies) was used as an
        internal control. The samples were run on a LightCycler480 real-time PCR thermal cycler
        (Roche), and the relative ratio of the expression of each gene was calculated using the
        2ΔΔCt method.

        Transcriptomic Analysis:
        The RNA-Seq reads were aligned to the mouse genome mm10.GRCm38.p5 using
        STAR version 2.5.3a (Dobin et al., 2013). Following alignment, the normalization and
        quantification procedures were performed with the PORT version 0.8.2a-beta pipeline
        (http://github.com/itmat/Normalization). Gene level quantification was done by PORT
        with Ensemblv90 annotation. The goal of the transcriptomic analysis was to evaluate
        differential response to the IAV infection in the ZT23 group vs the ZT11 group. Since the
        comparison is across different time points, several genes are differentially expressed
        simply by virtue of the circadian rhythms or other time-dependent effects. To account for
        this, we normalized the differential expression in the IAV infected group at each time
        point for the control group from the same time point.
        A p-value based two-way ANOVA analysis to extract interaction effects is generally
        considered unreliable with just three replicates per condition. However, achieving a
        meaningful ranking of genes that informs a powerful pathway enrichment analysis is
        sufficient for our purposes. A detailed study outlining our systematic approach is
        described to find the optimal value of pseudo-count (≈20) for an adjusted fold-change
        measure to rank genes by expression values in RNA-Seq data is currently under review
        as a methods based paper. The top 900 genes with difference of adjusted log10 fold-
        change greater than 0.67 (corresponding to about 5-fold change in the adjusted fold-
        changes) were used for pathway enrichment analysis. Pathway analyses were
        performed with Ingenuity IPA.
        REFERENCES:
        1.         Partch CL, Green CB, & Takahashi JS (2014) Molecular architecture of the
                   mammalian circadian clock. Trends Cell Biol 24(2):90-99.
        2.         Man K, Loudon A, & Chawla A (2016) Immunity around the clock. Science
                   354(6315):999-1003.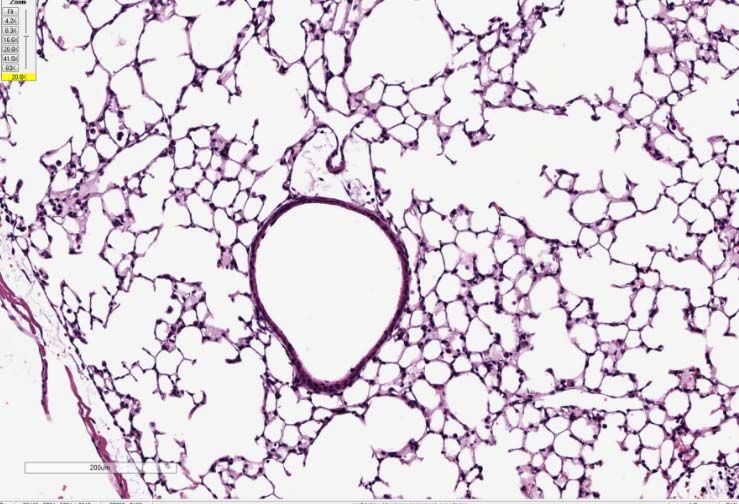
bioRxiv preprint first posted online Aug. 21, 2018; doi: http://dx.doi.org/10.1101/396556. The copyright holder for this preprint
 (which was not peer-reviewed) is the author/funder, who has granted bioRxiv a license to display the preprint in perpetuity.
                                    All rights reserved. No reuse allowed without permission.

        3.         Nguyen KD, et al. (2013) Circadian gene Bmal1 regulates diurnal oscillations of
                   Ly6C(hi) inflammatory monocytes. Science 341(6153):1483-1488.
        4.         Cermakian N, et al. (2013) Crosstalk between the circadian clock circuitry and
                   the immune system. Chronobiol Int 30(7):870-888.
        5.         Curtis AM, Bellet MM, Sassone-Corsi P, & O'Neill LA (2014) Circadian clock
                   proteins and immunity. Immunity 40(2):178-186.
        6.         Iwasaki A & Pillai PS (2014) Innate immunity to influenza virus infection. Nat Rev
                   Immunol 14(5):315-328.
        7.         de Jong MD, et al. (2006) Fatal outcome of human influenza A (H5N1) is
                   associated with high viral load and hypercytokinemia. Nat Med 12(10):1203-
                   1207.
        8.         Zhuang X, Rambhatla SB, Lai AG, & McKeating JA (2017) Interplay between
                   circadian clock and viral infection. J Mol Med (Berl) 95(12):1283-1289.
        9.         Edgar RS, et al. (2016) Cell autonomous regulation of herpes and influenza virus
                   infection by the circadian clock. Proc Natl Acad Sci U S A 113(36):10085-10090.
        10.        Gagnidze K, et al. (2016) Nuclear receptor REV-ERBalpha mediates circadian
                   sensitivity to mortality in murine vesicular stomatitis virus-induced encephalitis.
                   Proc Natl Acad Sci U S A.
        11.        Ehlers A, et al. (2018) BMAL1 links the circadian clock to viral airway pathology
                   and asthma phenotypes. Mucosal Immunol 11(1):97-111.
        12.        Long JE, et al. (2016) Morning vaccination enhances antibody response over
                   afternoon vaccination: A cluster-randomised trial. Vaccine 34(24):2679-2685.
        13.        Quandelacy TM, Viboud C, Charu V, Lipsitch M, & Goldstein E (2014) Age- and
                   sex-related risk factors for influenza-associated mortality in the United States
                   between 1997-2007. Am J Epidemiol 179(2):156-167.
        14.        Torcia MG, et al. (2012) Sex differences in the response to viral infections: TLR8
                   and TLR9 ligand stimulation induce higher IL10 production in males. PLoS One
                   7(6):e39853.
        15.        Allen IC, et al. (2009) The NLRP3 inflammasome mediates in vivo innate
                   immunity to influenza A virus through recognition of viral RNA. Immunity
                   30(4):556-565.
        16.        Contoli M, et al. (2015) Th2 cytokines impair innate immune responses to
                   rhinovirus in respiratory epithelial cells. Allergy 70(8):910-920.
        17.        Sun J, Madan R, Karp CL, & Braciale TJ (2009) Effector T cells control lung
                   inflammation during acute influenza virus infection by producing IL-10. Nat Med
                   15(3):277-284.
        18.        Lin KL, Suzuki Y, Nakano H, Ramsburg E, & Gunn MD (2008) CCR2+ monocyte-
                   derived dendritic cells and exudate macrophages produce influenza-induced
                   pulmonary immune pathology and mortality. J Immunol 180(4):2562-2572.
        19.        Lee N, et al. (2011) Cytokine response patterns in severe pandemic 2009 H1N1
                   and seasonal influenza among hospitalized adults. PLoS One 6(10):e26050.
        20.        Sutton CE, et al. (2017) Loss of the molecular clock in myeloid cells exacerbates
                   T cell-mediated CNS autoimmune disease. Nat Commun 8(1):1923.
        21.        Druzd D, et al. (2017) Lymphocyte Circadian Clocks Control Lymph Node
                   Trafficking and Adaptive Immune Responses. Immunity 46(1):120-132.
        22.        Hemmers S & Rudensky AY (2015) The Cell-Intrinsic Circadian Clock Is
                   Dispensable for Lymphocyte Differentiation and Function. Cell Rep 11(9):1339-
                   1349.
        23.        Phillips AC, Gallagher S, Carroll D, & Drayson M (2008) Preliminary evidence
                   that morning vaccination is associated with an enhanced antibody response in
                   men. Psychophysiology 45(4):663-666.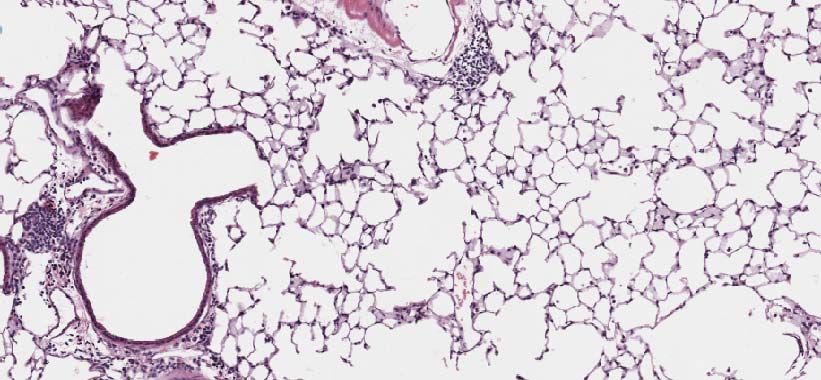
bioRxiv preprint first posted online Aug. 21, 2018; doi: http://dx.doi.org/10.1101/396556. The copyright holder for this preprint
 (which was not peer-reviewed) is the author/funder, who has granted bioRxiv a license to display the preprint in perpetuity.
                                    All rights reserved. No reuse allowed without permission.

        24.        Kirby T (2016) Influenza vaccination in the morning improves response. Lancet
                   Respir Med 4(6):435.
        25.        Majumdar T, Dhar J, Patel S, Kondratov R, & Barik S (2017) Circadian
                   transcription factor BMAL1 regulates innate immunity against select RNA viruses.
                   Innate Immun 23(2):147-154.
        26.        Hermesh T, Moltedo B, Moran TM, & Lopez CB (2010) Antiviral instruction of
                   bone marrow leukocytes during respiratory viral infections. Cell Host Microbe
                   7(5):343-353.
        27.        Wong SS, et al. (2018) Severe Influenza Is Characterized by Prolonged Immune
                   Activation: Results From the SHIVERS Cohort Study. J Infect Dis 217(2):245-
                   256.
        28.        Mauad T, et al. (2010) Lung pathology in fatal novel human influenza A (H1N1)
                   infection. Am J Respir Crit Care Med 181(1):72-79.
        29.        Kuiken T, van den Brand J, van Riel D, Pantin-Jackwood M, & Swayne DE
                   (2010) Comparative pathology of select agent influenza a virus infections. Vet
                   Pathol 47(5):893-914.
        30.        Sundar IK, et al. (2015) Influenza A virus-dependent remodeling of pulmonary
                   clock function in a mouse model of COPD. Sci Rep 4:9927.
        31.        Sundar IK, et al. (2014) Serotonin and corticosterone rhythms in mice exposed to
                   cigarette smoke and in patients with COPD: implication for COPD-associated
                   neuropathogenesis. PLoS One 9(2):e87999.
        32.        Gazit R, et al. (2006) Lethal influenza infection in the absence of the natural killer
                   cell receptor gene Ncr1. Nat Immunol 7(5):517-523.
        33.        Kervezee L, Cuesta M, Cermakian N, & Boivin DB (2018) Simulated night shift
                   work induces circadian misalignment of the human peripheral blood mononuclear
                   cell transcriptome. Proc Natl Acad Sci U S A.
        34.        Logan RW, et al. (2012) Chronic shift-lag alters the circadian clock of NK cells
                   and promotes lung cancer growth in rats. J Immunol 188(6):2583-2591.
        35.        Arjona A & Sarkar DK (2005) Circadian oscillations of clock genes, cytolytic
                   factors, and cytokines in rat NK cells. J Immunol 174(12):7618-7624.
        36.        Arjona A & Sarkar DK (2006) Evidence supporting a circadian control of natural
                   killer cell function. Brain Behav Immun 20(5):469-476.
        37.        Sato S, et al. (2014) A circadian clock gene, Rev-erbalpha, modulates the
                   inflammatory function of macrophages through the negative regulation of Ccl2
                   expression. J Immunol 192(1):407-417.
        38.        Curtis AM, et al. (2015) Circadian control of innate immunity in macrophages by
                   miR-155 targeting Bmal1. Proc Natl Acad Sci U S A.
        39.        Gibbs J, et al. (2014) An epithelial circadian clock controls pulmonary
                   inflammation and glucocorticoid action. Nat Med 20(8):919-926.
        40.        Yang G, et al. (2016) Timing of expression of the core clock gene Bmal1
                   influences its effects on aging and survival. Sci Transl Med 8(324):324ra316.
        41.        Pariollaud M, et al. (2018) Circadian clock component REV-ERBalpha controls
                   homeostatic regulation of pulmonary inflammation. J Clin Invest.
        42.        Gibbs JE, et al. (2012) The nuclear receptor REV-ERBalpha mediates circadian
                   regulation of innate immunity through selective regulation of inflammatory
                   cytokines. Proc Natl Acad Sci U S A 109(2):582-587.
        43.        Silver AC, Arjona A, Walker WE, & Fikrig E (2012) The circadian clock controls
                   toll-like receptor 9-mediated innate and adaptive immunity. Immunity 36(2):251-
                   261.
        44.        Grant GR, et al. (2011) Comparative analysis of RNA-Seq alignment algorithms
                   and the RNA-Seq unified mapper (RUM). Bioinformatics 27(18):2518-2528.
bioRxiv preprint first posted online Aug. 21, 2018; doi: http://dx.doi.org/10.1101/396556. The copyright holder for this preprint
(which was not peer-reviewed) is the author/funder, who has granted bioRxiv a license to display the preprint in perpetuity.
All rights reserved. No reuse allowed without permission.
Figure legends
Fig.1. : Time of day of infection affects survival following influenza A virus (IAV)
infection by intranasal (i.n.) administration.
(A) Experimental design: Two groups of mice were maintained in 12 hrs Light: Dark
cycles. One group of mice was infected with 0.5LD50 at the start of the light cycle (ZT23),
and for the other group i.n. IAV was administered at the start of the dark cycle (ZT11).
(B) Survival curves are a composite of 3 independent experiments [total n = 17 per
group, log-rank (Mantel–Cox) test, p < 0.0001].
(C) Disease progression is expressed as the percent of weight change following IAV
infection. Compiled data are expressed as mean ± SEM.
(D) Disease progression was also measured as clinical scores. Data represented as
median ± SEM (total n = 17 per group; Student’s t test, *p < 0.05, **p < 0.01, ***p <
0.001).
(E) Two groups of mice were maintained in constant darkness for 72hrs. One group of
mice was infected with 0.5LD50 at the start of the light cycle (CT23), and for the other
group i.n. IAV was administered at the start of dark cycle (CT11). Survival curves [total
n = 8-12 per group, log-rank (Mantel–Cox) test, * p < 0.05].
Fig. 2. : The time of day at infection affects viral clearance
After infecting mice at ZT23 or ZT11, viral titers were determined in the lung on 2, 4, 6, 8
(days post-infection) d.p.i.
(A) Combined data. (n = 8-12 mice per group, student t test; *p < 0.05, **p < 0.01, ZT23
vs. ZT11).
(B) Stratified by gender.
Fig. 3. : Temporal gating of IAV-induced mortality and morbidity is associated with
lung inflammation.
(A) Broncho alveolar lavages (BAL) were collected at the indicated time points post-
infection from mice that received either IAV or PBS either at ZT23 and ZT11. Top Panel:
Total BAL cell count 48-72 hours p.i. Lower panel: Differential of the cells from 48 hrs
post-infection for both IAV infected groups.
Data were compiled from three independent experiments and expressed as mean ±
SEM (total n = 5-8 per time point, two-way ANOVA; *p < 0.05 for time of infection, NS for
time of dissection).
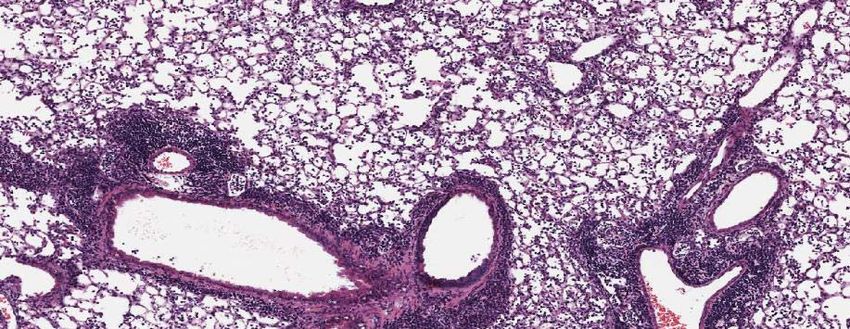
(B) Top Panel: Representative micrographs of H&E stained lung sections 2 days after
sham (PBS) or IAV (50 PFU) treatment. (photomicrograph bar=200µm). Lower Panel:
Severity of lung injury quantified using an objective histopathological scoring system.
((total n = 5-6 per group, student t test; *p < 0.05, ZT23 vs. ZT11)
(C) Right Panel: Total BAL cell count on day 6 p.i. from mice who received either IAV or
PBS at either ZT23 and ZT11. Data compiled from three independent experiments are
expressed as mean ± SEM (total n = 9-15 per time point, two-way ANOVA; *p < 0.05,
ZT23 vs. ZT11). Left Panel: Differential of the BAL cells from both IAV infected groups.
(D) Top Panel: Representative micrographs of H&E stained lung sections 6 days after
sham (PBS) or IAV (40 PFU) treatment. (photomicrograph bar=200µm). Lower Panel:bioRxiv preprint first posted online Aug. 21, 2018; doi: http://dx.doi.org/10.1101/396556. The copyright holder for this preprint
(which was not peer-reviewed) is the author/funder, who has granted bioRxiv a license to display the preprint in perpetuity.
All rights reserved. No reuse allowed without permission.
Severity of lung injury quantified using an objective histopathological scoring system.
((total n = 7-9mice/ group, student t test; **p < 0.01, ZT23 vs. ZT11)
(E) Cytokine levels in BAL. (n=6/group. student t test; *p < 0.05)
Fig. 4. : RNA samples from animals infected at ZT23 or ZT11, with either PBS or IAV, 6
days after infection were collected at ZT23 and ZT11 and used for RNA-Seq.
(A) Venn diagram (sizes not to scale) depicting the number of differentially expressed
genes.
(B) Heatmap of the top 900 differentially expressed genes.
(C) Plot of log adjusted fold change for ZT11 and ZT23, showing directionality of the
most differentially expressed genes. Flow cytometry-based enumeration of the different
innate immune cell populations in dissociated lungs following IAV infection at either
ZT23 or ZT11.
(D) CD45+ cells (as a % of live) and CD45+ cell numbers. 2-way ANOVA, pbioRxiv preprint first posted online Aug. 21, 2018; doi: http://dx.doi.org/10.1101/396556. The copyright holder for this preprint
(which was not peer-reviewed) is the author/funder, who has granted bioRxiv a license to display the preprint in perpetuity.
All rights reserved. No reuse allowed without permission.
Main figures
05-20-2018bioRxiv preprint first posted online Aug. 21, 2018; doi: http://dx.doi.org/10.1101/396556. The copyright holder for this preprint
(which was not peer-reviewed) is the author/funder, who has granted bioRxiv a license to display the preprint in perpetuity.
All rights reserved. No reuse allowed without permission.
Figure 1 (A)bioRxiv preprint first posted online Aug. 21, 2018; doi: http://dx.doi.org/10.1101/396556. The copyright holder for this preprint
(which was not peer-reviewed) is the author/funder, who has granted bioRxiv a license to display the preprint in perpetuity.
All rights reserved. No reuse allowed without permission.
Control_ZT23
Control_ZT11
Flu_ZT23
Flu_ZT11
**
15
*
Day of death
10
*
* *
5
*
0
100
50
0
P
u
n
a
v
v
s
e
c
e
r
r
t
l
i
% Weight loss
Figure 1
(C)
(B)bioRxiv preprint first posted online Aug. 21, 2018; doi: http://dx.doi.org/10.1101/396556. The copyright holder for this preprint
(which was not peer-reviewed) is the author/funder, who has granted bioRxiv a license to display the preprint in perpetuity.
All rights reserved. No reuse allowed without permission.
8 9 10 11 12 13 14
Days post-infection (dpi)
Figure 1
* *
* * *
Flu_ZT23
Flu_ZT11
6 7
5
4
3
4
3
2
1
0
-1
(D)
Clinical scorebioRxiv preprint first posted online Aug. 21, 2018; doi: http://dx.doi.org/10.1101/396556. The copyright holder for this preprint
(which was not peer-reviewed) is the author/funder, who has granted bioRxiv a license to display the preprint in perpetuity.
All rights reserved. No reuse allowed without permission.
CT23
CT11
*
15
Figure 1
10
Day of death
5
0
0
100
50
Percent survival
(E)bioRxiv preprint first posted online Aug. 21, 2018; doi: http://dx.doi.org/10.1101/396556. The copyright holder for this preprint
(which was not peer-reviewed) is the author/funder, who has granted bioRxiv a license to display the preprint in perpetuity.
All rights reserved. No reuse allowed without permission.
*
Figure 2
*
8
*
Days post-infection (dpi)
Viral Titers (Males)
6
4
ZT23
ZT11
2
8
6
4
2
0
(A) Viral Titers in the lung (in log10)
(B)bioRxiv preprint first posted online Aug. 21, 2018; doi: http://dx.doi.org/10.1101/396556. The copyright holder for this preprint
(which was not peer-reviewed) is the author/funder, who has granted bioRxiv a license to display the preprint in perpetuity.
All rights reserved. No reuse allowed without permission.
Control ZT23
Control ZT11
Flu ZT23
Flu ZT11
64
*
Hours post-infection
*
60
52
*
Figure 3 (A)
* 48
50
0
200
150
100
count
Total BAL count
% of total BAL cellbioRxiv preprint first posted online Aug. 21, 2018; doi: http://dx.doi.org/10.1101/396556. The copyright holder for this preprint
(which was not peer-reviewed) is the author/funder, who has granted bioRxiv a license to display the preprint in perpetuity.
All rights reserved. No reuse allowed without permission.
Flu
Control
ZT23 ZT11
*
Figure 3 (B)
Histology scorebioRxiv preprint first posted online Aug. 21, 2018; doi: http://dx.doi.org/10.1101/396556. The copyright holder for this preprint
(which was not peer-reviewed) is the author/funder, who has granted bioRxiv a license to display the preprint in perpetuity.
All rights reserved. No reuse allowed without permission.
Mononuclear
cells
PMN cells
count
% of total BAL cell
Control ZT23
Control ZT11
Flu ZT23
Flu ZT11
*
Figure 3 (C)
50
0
250
200
150
100
(in 104 cells/ml)
Total BAL cell countbioRxiv preprint first posted online Aug. 21, 2018; doi: http://dx.doi.org/10.1101/396556. The copyright holder for this preprint
(which was not peer-reviewed) is the author/funder, who has granted bioRxiv a license to display the preprint in perpetuity.
All rights reserved. No reuse allowed without permission.
Flu
Control
*
*
ZT23 ZT11
Figure 3 (D)
Histology scorebioRxiv preprint first posted online Aug. 21, 2018; doi: http://dx.doi.org/10.1101/396556. The copyright holder for this preprint
(which was not peer-reviewed) is the author/funder, who has granted bioRxiv a license to display the preprint in perpetuity.
All rights reserved. No reuse allowed without permission.
ZT11
ZT11
*
ZT23
ZT23
4000
3000
2000
1000
0
30
20
10
0
IL-4 (pg/ml) mcp1 (pg/ml)
ZT11
ZT11
*
ZT23
ZT23
80
60
40
20
0
0
200
150
100
50
TNFα (pg/ml)
IL10 (pg/ml)
Figure 3 (E)
ZT11
ZT11
ZT23
ZT23
8000
6000
4000
2000
0
80
60
40
20
0
RANTES (in pg/ml)
IL6 (pg/ml)bioRxiv preprint first posted online Aug. 21, 2018; doi: http://dx.doi.org/10.1101/396556. The copyright holder for this preprint
(which was not peer-reviewed) is the author/funder, who has granted bioRxiv a license to display the preprint in perpetuity.
All rights reserved. No reuse allowed without permission.
(B)
Flu ZT11 vs ZT23
4684
Figure 4
Control ZT11 vs ZT23
109 75
(A)(C)
bioRxiv preprint first posted online Aug. 21, 2018; doi: http://dx.doi.org/10.1101/396556. The copyright holder for this preprint
(which was not peer-reviewed) is the author/funder, who has granted bioRxiv a license to display the preprint in perpetuity.
Top Canonical Pathways Adjusted Overlap
p-value (list/background)
Granulocyte Adhesion and Diapedesis 6.08E-18 32/139
All rights reserved. No reuse allowed without permission.
Role of PRR in recognition of bacteria and viruses 2.70E-14 23/123
Agranulocyte Adhesion and Diapedesis 2.03E-11 28/150
Role of hypercytokinemia/hyperchemokinemia in 2.18E-10 11/23
pathogenesis of Influenza
Communication between innate & adaptive immune cells 8.82E-09 16/63
Nicotine Degradation II 7.93E-09 13/36
Differential Regulation of Cytokine Production in 1.45E-08 9/16
Intestinal Epithelial Cells by IL-17A and IL-17F
Differential Regulation of Cytokine Production in 8.12E-08 8/14
Macrophages and T Helper Cells by IL-17A and IL-17F
Th1 Pathway 1.21E-07 21/112
Th1 and Th2 Activation Pathway 1.71E-07 25/155bioRxiv preprint first posted online Aug. 21, 2018; doi: http://dx.doi.org/10.1101/396556. The copyright holder for this preprint
(which was not peer-reviewed) is the author/funder, who has granted bioRxiv a license to display the preprint in perpetuity.
All rights reserved. No reuse allowed without permission.
ZT23 (adjusted log fold change)
Oas3
Cxcl10
ISG15
Ccr5
Per3
Ccl7
Lrat
Gzmb Irg1
Ccl4
Ly6c2
Il1r2
Figure 4 (D)
o
o
n
h
d
d
u
d
1
1
e
e
T
a
a
Z
g
g
c
s
t
)
f
(
j
l
lbioRxiv preprint first posted online Aug. 21, 2018; doi: http://dx.doi.org/10.1101/396556. The copyright holder for this preprint
(which was not peer-reviewed) is the author/funder, who has granted bioRxiv a license to display the preprint in perpetuity.
All rights reserved. No reuse allowed without permission.
*
Time of infection p < 0.05
*
Day of dissection pbioRxiv preprint first posted online Aug. 21, 2018; doi: http://dx.doi.org/10.1101/396556. The copyright holder for this preprint
(which was not peer-reviewed) is the author/funder, who has granted bioRxiv a license to display the preprint in perpetuity.
All rights reserved. No reuse allowed without permission.
6
Days post-infection (dpi)
Days post-infection (dpi)
6
*
4
*
4
2
ZT23
ZT11
*
ZT23
ZT11
2
1
1
10
8
6
4
2
0
CD11b+DCs(as% of CD45+)
10
D40
o30
( 20
+ 10
%
D
b
C
iC
C
5
4
1
)+
sa
e
c
yL
f
sll
h
6
Days post-infection (dpi)
4
2
ZT23
ZT11
1
2.0
1.5
1.0
0.5
0.0
CD103+DCs (as % of CD45+)
Alveolar macrophages
6
Days post-infection (dpi)
4
2
ZT23
ZT11
Figure 4 (F)
1
8
6
4
2
0
AM (as % of CD45+ cells)bioRxiv preprint first posted online Aug. 21, 2018; doi: http://dx.doi.org/10.1101/396556. The copyright holder for this preprint
(which was not peer-reviewed) is the author/funder, who has granted bioRxiv a license to display the preprint in perpetuity.
All rights reserved. No reuse allowed without permission.
6
ZT23
6
ZT11
Days post-infection (dpi)
Days post-infection (dpi)
4
4
*
2
*
2
ZT23
ZT11
1
1
*
20
15
10
5
0
15
10
5
0
NK1.1+ (as % of CD45+ cells) Neutrophils (as % of CD45+ cells)
ZT11
Ly6G
ZT23
Figure 4 (G)
D1 NK1.1 D2 D4bioRxiv preprint first posted online Aug. 21, 2018; doi: http://dx.doi.org/10.1101/396556. The copyright holder for this preprint
(which was not peer-reviewed) is the author/funder, who has granted bioRxiv a license to display the preprint in perpetuity.
All rights reserved. No reuse allowed without permission.
Days post-infection (dpi)
Days post-infection (dpi)
4
4
*
*
2
2
ZT23
ZT11
ZT23
ZT11
*
*
1
1
0.8
0.6
0.4
0.2
0.0
6
4
2
0
NK cells (as % of all live cells)
NKT cells (as % of all live cells)
ZT11
CD3
ZT23
Figure 4 (H)
D1 NK1.1 D2 D4bioRxiv preprint first posted online Aug. 21, 2018; doi: http://dx.doi.org/10.1101/396556. The copyright holder for this preprint
(which was not peer-reviewed) is the author/funder, who has granted bioRxiv a license to display the preprint in perpetuity.
All rights reserved. No reuse allowed without permission.
ZT23
ZT11
Days post-infection (dpi)
6
4
Gmzb
2
1
3
2
1
0
Relative mRNA expression
ZT23
ZT11
ZT23
ZT11
Days post-infection (dpi)
6
Days post-infection (dpi)
6
4
perf1
4
ifng1
2
2
Figure S8
1
1
2.0
1.5
1.0
0.5
0.0
4
3
2
1
0
Relative mRNA expression Relative mRNA expressionbioRxiv preprint first posted online Aug. 21, 2018; doi: http://dx.doi.org/10.1101/396556. The copyright holder for this preprint
(which was not peer-reviewed) is the author/funder, who has granted bioRxiv a license to display the preprint in perpetuity.
All rights reserved. No reuse allowed without permission.
Supplemental figuresbioRxiv preprint first posted online Aug. 21, 2018; doi: http://dx.doi.org/10.1101/396556. The copyright holder for this preprint
(which was not peer-reviewed) is the author/funder, who has granted bioRxiv a license to display the preprint in perpetuity.
All rights reserved. No reuse allowed without permission.bioRxiv preprint first posted online Aug. 21, 2018; doi: http://dx.doi.org/10.1101/396556. The copyright holder for this preprint
(which was not peer-reviewed) is the author/funder, who has granted bioRxiv a license to display the preprint in perpetuity.
All rights reserved. No reuse allowed without permission.
Total BAL cell counts in controls
ZT11 ZT15
Time at sample collection
ZT3
Figure S2
ZT23
15
10
5
0
BAL cell count (104 cells/ml)bioRxiv preprint first posted online Aug. 21, 2018; doi: http://dx.doi.org/10.1101/396556. The copyright holder for this preprint
(which was not peer-reviewed) is the author/funder, who has granted bioRxiv a license to display the preprint in perpetuity.
All rights reserved. No reuse allowed without permission.
Figure S3
ZT11
Influenza
ZT23 ZT11
Control
ZT23
300
200
100
0
(104 cells/ml)
Total BAL cell countbioRxiv preprint first posted online Aug. 21, 2018; doi: http://dx.doi.org/10.1101/396556. The copyright holder for this preprint
(which was not peer-reviewed) is the author/funder, who has granted bioRxiv a license to display the preprint in perpetuity.
All rights reserved. No reuse allowed without permission.
ZT11
ZT11
ZT23
ZT23
0
15000
10000
5000
8000
6000
4000
2000
0
G-CSF (in pg/ml)
IFNγ (in pg/ml)
ZT11
ZT11
Figure S4
ZT23
ZT23
0
20000
15000
10000
5000
300
200
100
0
IL5 (in pg/ml)
ip10 (in pg/ml)bioRxiv preprint first posted online Aug. 21, 2018; doi: http://dx.doi.org/10.1101/396556. The copyright holder for this preprint
(which was not peer-reviewed) is the author/funder, who has granted bioRxiv a license to display the preprint in perpetuity.
All rights reserved. No reuse allowed without permission.
*
Figure S5
(in 104 cells/ml)
Total BAL cell countbioRxiv preprint first posted online Aug. 21, 2018; doi: http://dx.doi.org/10.1101/396556. The copyright holder for this preprint
(which was not peer-reviewed) is the author/funder, who has granted bioRxiv a license to display the preprint in perpetuity.
All rights reserved. No reuse allowed without permission.
Gating strategy
Figure S6bioRxiv preprint first posted online Aug. 21, 2018; doi: http://dx.doi.org/10.1101/396556. The copyright holder for this preprint
(which was not peer-reviewed) is the author/funder, who has granted bioRxiv a license to display the preprint in perpetuity.
All rights reserved. No reuse allowed without permission.
Gating strategy
Figure S5bioRxiv preprint first posted online Aug. 21, 2018; doi: http://dx.doi.org/10.1101/396556. The copyright holder for this preprint
(which was not peer-reviewed) is the author/funder, who has granted bioRxiv a license to display the preprint in perpetuity.
All rights reserved. No reuse allowed without permission.
Days post-infection (dpi)
Days post-infection (dpi)
10
10
8
ZT23
ZT11
ZT23
ZT11
8
6
4
3
2
1
0
40
30
20
10
0
Activated CD8(as % of CD45+) Activated CD8(as% of CD45+)
Mediastinal Lymph nodes
Days post-infection (dpi)
Days post-infection (dpi)
10
10
Lung
8
ZT23
ZT11
ZT23
ZT11
8
Figure S7
6
25
20
15
10
5
0
40
30
20
10
0
CD8 (as% of CD45+) CD8+(as% of CD45+)bioRxiv preprint first posted online Aug. 21, 2018; doi: http://dx.doi.org/10.1101/396556. The copyright holder for this preprint
(which was not peer-reviewed) is the author/funder, who has granted bioRxiv a license to display the preprint in perpetuity.
All rights reserved. No reuse allowed without permission.
ZT23
ZT11
Days post-infection (dpi)
6
4
Gmzb
2
1
3
2
1
0
Relative mRNA expression
ZT23
ZT11
ZT23
ZT11
Days post-infection (dpi)
6
Days post-infection (dpi)
6
4
perf1
4
ifng1
2
2
Figure S8
1
1
2.0
1.5
1.0
0.5
0.0
4
3
2
1
0
Relative mRNA expression Relative mRNA expressionYou can also read