PROBING STACKING CONFIGURATIONS IN A FEW LAYERED MOS2 BY LOW FREQUENCY RAMAN SPECTROSCOPY - NATURE
←
→
Page content transcription
If your browser does not render page correctly, please read the page content below
www.nature.com/scientificreports
OPEN Probing stacking configurations
oS2 by low
in a few layered M
frequency Raman spectroscopy
1 1,2 1*
Rhea Thankam Sam , Takayuki Umakoshi & Prabhat Verma
Novel two-dimensional (2D) layered materials, such as MoS2, have recently gained a significant
traction, chiefly due to their tunable electronic and optical properties. A major attribute that affects
the tunability is the number of layers in the system. Another important, but often overlooked aspect
is the stacking configuration between the layers, which can modify their electro-optic properties
through changes in internal symmetries and interlayer interactions. This demands a thorough
understanding of interlayer stacking configurations of these materials before they can be used in
devices. Here, we investigate the spatial distribution of various stacking configurations and variations
in interlayer interactions in few-layered MoS2 flakes probed through the low-frequency Raman
spectroscopy, which we establish as a versatile imaging tool for this purpose. Some interesting
anomalies in MoS2 layer stacking, which we propose to be caused by defects, wrinkles or twist
between the layers, are also reported here. These types of anomalies, which can severely affect the
properties of these materials can be detected through low-frequency Raman imaging. Our findings
provide useful insights for understanding various structure-dependent properties of 2D materials that
could be of great importance for the development of future electro-optic devices, quantum devices
and energy harvesting systems.
Abbreviations
2D Two-dimensional
TMDC Transition metal dichalcogenide
S Shear mode
B Breathing mode
Two-dimensional (2D) materials have attracted much research attention after single-layered graphene was
detached from graphite by adhesive-tape technique. Graphene exhibits many interesting properties that are
significantly superior than the bulk g raphite1,2. After the success with semi-metallic graphene, layered materials
with band gaps became widely sought after. Transition metal dichalcogenides (TMDCs) emerged as the new
class of 2D semiconductor materials that perfectly complement graphene with a tunable bandgap3. TMDCs,
represented by the formula MX2 (M = transition metal, X = chalcogen) are comprised of about 40 different layered
materials such as M oS2, WS2, WSe2, MoSe2, etc. Of the TMDC family, M oS2 is the most studied compound and
is considered as the archetypal TMDC. M oS2 is often used in electronic and optoelectronic devices as an active
media in the form of a few layers. In 2D devices, the number of layers and their orientations in layer stacking alter
the internal crystal symmetry, thereby modifying the band structure and the electronic properties of the device.
For instance, bilayer graphene can be transformed into a gate-tunable superconductor or into an insulator by
choosing the right twist angle between the layers4. It is also reported that in multilayered MoS2, the twist angle
between the layers can change the indirect bandgap5. Another example is the presence of a stacking-dependent
symmetry variation that leads to valley polarization, which can be utilized for valleytronics a pplications6. Natural
MoS2 is found in two different polytypes, 2H and 3R, depending on their stacking orders. In a 2H stacked M oS2
with more than one layer, the intrinsic inversion symmetry hinders valley polarization. However, a 3R stacked
MoS2 is found to exhibit a broken inversion symmetry that enhances strong inter-valley polarization, irrespec-
tive of the number of layers present. In MoS2 with broken inversion symmetry, such intervalley polarization
can be invoked by optical excitation using circularly polarized l ight7–9. Yet another stacking dependent property
present in MoS2 is the piezoelectricity, which arises from the broken inversion symmetry in the atomic structure
as well10. Since 3R stacked MoS2 always has a broken inversion symmetry, it is expected to show piezoelectricity.
1
Department of Applied Physics, Osaka University, Suita, Osaka 565‑0871, Japan. 2PRESTO, Japan Science and
Technology Agency, Kawaguchi, Saitama 332‑0012, Japan. *email: verma@ap.eng.osaka‑u.ac.jp
Scientific Reports | (2020) 10:21227 | https://doi.org/10.1038/s41598-020-78238-w 1
Vol.:(0123456789)
www.nature.com/scientificreports/
In addition to stacking dependent spin–orbit coupling and symmetry variations, it has a finite bandgap that can
be tuned from an indirect bandgap of 1.2 eV in the bulk sample to a direct one of 1.96 eV in the single-layer
regime3. While the electronic and optical properties of 2D M oS2 are still being explored, many prototypes for
nano-transistors11, electro-optic modulators12, detectors13, and L EDs14 have been developed. Since MoS2 has
many properties depending on the layer stacking and the number of l ayers15, a precise identification of various
layer stacking configurations and determination of the number of layers are essential.
Over the years, Raman spectroscopy has been proved to be one of the most versatile tools to characterize vari-
ous samples, as it provides both structural and chemical fingerprints. Since it provides a non-destructive method
for the determination of the number of layers, M oS2 has been extensively studied by Raman s pectroscopy16. Sev-
eral studies have emphasized the potential of Raman spectroscopy to study the effect of doping and d efects17,18,
19,20
as well as to measure strain in many 2D materials, including M oS2 . Even the subwavelength defects can be
characterized by tip-enhanced Raman s pectroscopy21–27, which enables Raman analysis with a nanoscale spatial
resolution, using near-field light generated at a metallic nanotip through plasmon resonance28–34. Widely studied
Raman modes of M oS2 are the high-frequency modes, E 2g and A
1g, which arise due to the in-plane and the out of
plane vibrations of atoms within each layer, respectively. When the number of layers increases, the frequencies
of E2g and A1g modes are found to shift in the opposite direction16,35. These frequency variations are often used
as indicators to identify the number of layers in M oS2 for up to a few layers. However, since the high-frequency
modes are primarily dominated by the chemical covalent bonds, van der Waals forces between the layers have
little effect on them, making them insensitive to interlayer coupling and hence to the stacking configuration of
the layers.
On the other hand, the low-frequency modes that solely originate from the interlayer interactions, could be
great tools to identify the stacking order and to probe interfacial qualities. In addition, they show a better response
than high-frequency modes to the number layers as well, and hence should be preferred over the high-frequency
modes. In the case of a few-layered M oS2, the reported low-frequency modes are the shear mode that originates
from the in-plane oscillations of each layer; and the layer breathing mode that results from their out of plane
oscillations36. The dependence of low-frequency modes on the number of layers was first reported in a few-layered
graphene in 201237. This was followed by various reports, which used the low-frequency modes to determine the
number of layers38–41, to identify the twist angle between the layers and various stacking configurations5,42–47,
to probe interlayer coupling48,49 and to determine the crystal orientation in various 2D materials and in van der
Waals heterostructures50,51. The development of this research over the last few years indicates the ability of the
low-frequency modes to characterize a wide range of 2D materials, including van der Waals heterostructures.
However, no extensive studies of the low-frequency modes to probe the stacking configurations of MoS2
are reported so far. Previous studies that probed stacking configuration in M oS2 had relied only on single point
spectroscopic measurements of Raman m odes5,44,52–54. While single point Raman measurements are sufficient to
measure the properties of a homogenous sample, they do not provide an accurate picture about the distribution of
any physical properties, such as the stacking configurations, within the MoS2 sample. A complete characterization
of spatially inhomogeneous sample like an M oS2 flake will require imaging over the entire sample surface. For
many applications, where the surface area of the active material is a crucial parameter, one needs to make sure
the entire sample surface is properly characterized and studied. Determining the stacking configuration becomes
even more crucial as different synthesis methods yields different degree of uniformity of stacking configuration.
With Raman imaging, it is possible to extend single point Raman spectroscopy to two dimensions, which will
yield much more information about the spatial variation of material properties and characteristics. In this context,
Raman imaging does not only give a more comprehensive information over single point Raman measurements,
but is also indispensable. As of now, no spatially resolved studies have pointed point out the subtle changes in
the stacking configuration across the M oS2 sample. Moreover, no studies have examined the spatial variation
of stacking configurations and the distribution of interfacial properties, such as twists or other defects in M oS2
samples. Here, we present a systematic study of few-layered MoS2 flakes by identifying the number of layers,
stacking configurations and their distributions, and the interfacial properties in two, three, and four-layered
MoS2 samples by analyzing the low-frequency modes through Raman imaging. Our low-frequency Raman
images provides an excellent approach to assess the quality of the M oS2 layers and their suitability for various
electronic and photonic applications.
Results and discussions
The effective restoring forces associated with the low-frequency modes are quite weak as they depend only on the
van der Waals interactions between the layers and are typically observed very close to the Rayleigh line. These
modes are often masked by the Rayleigh line and are therefore difficult to be observed with a conventional Raman
microscope. To measure the low-frequency modes, we used four different ultra-narrow band Bragg notch filters
(BNFs), which have a spectral bandwidth as narrow as 4 cm−1. BNFs are essentially diffractive gratings that are
recorded on a bulk photosensitive material by refractive index modulation through UV interference55. BNFs act
as angular and spectral filters by reflecting an ultra-narrow bandwidth of incident light that satisfies the Bragg
condition. Our experimental setup that utilizes BNFs to measure low-frequency Raman modes is illustrated in
Fig. 1. Further details are described in Methods section.
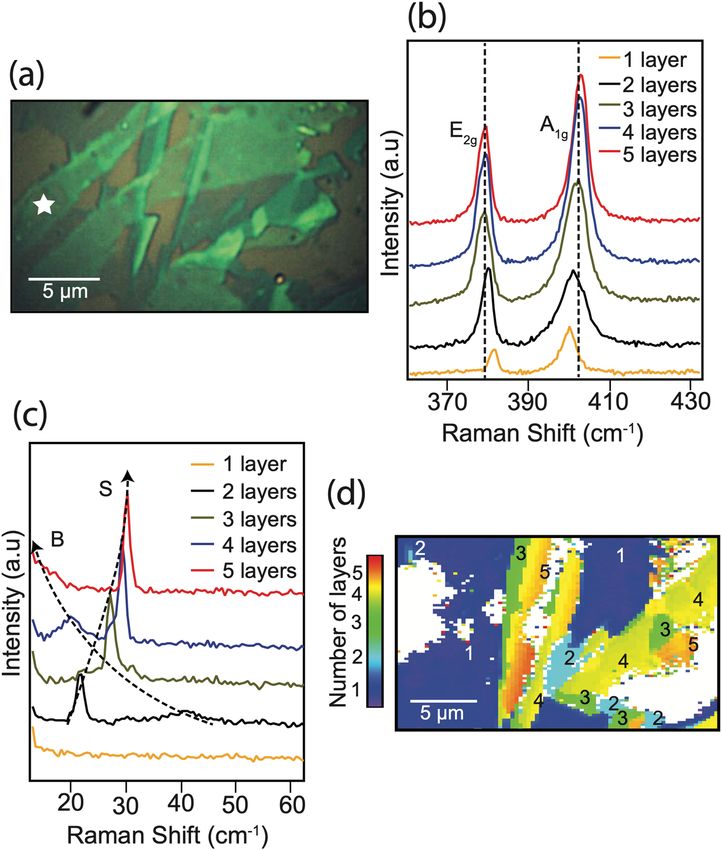
We used the gold-mediated tape exfoliation technique that enables exfoliation of M oS2 sample with the thick-
ness of a few layers in a relatively large lateral s ize56. Figure 2(a) shows an optical image of a few layered M oS2
sample on SiO2/Si substrate prepared by Au-mediated exfoliation process. The sample preparation process is
described in the Methods section. Prior to identifying the distribution of stacking configurations in the sample,
we first identified the number of layers present in the sample at different locations. The high-frequency modes,
E2g and A1g, shift away from each other with increasing number of layers, which is considered as a reliable tool to
Scientific Reports | (2020) 10:21227 | https://doi.org/10.1038/s41598-020-78238-w 2
Vol:.(1234567890)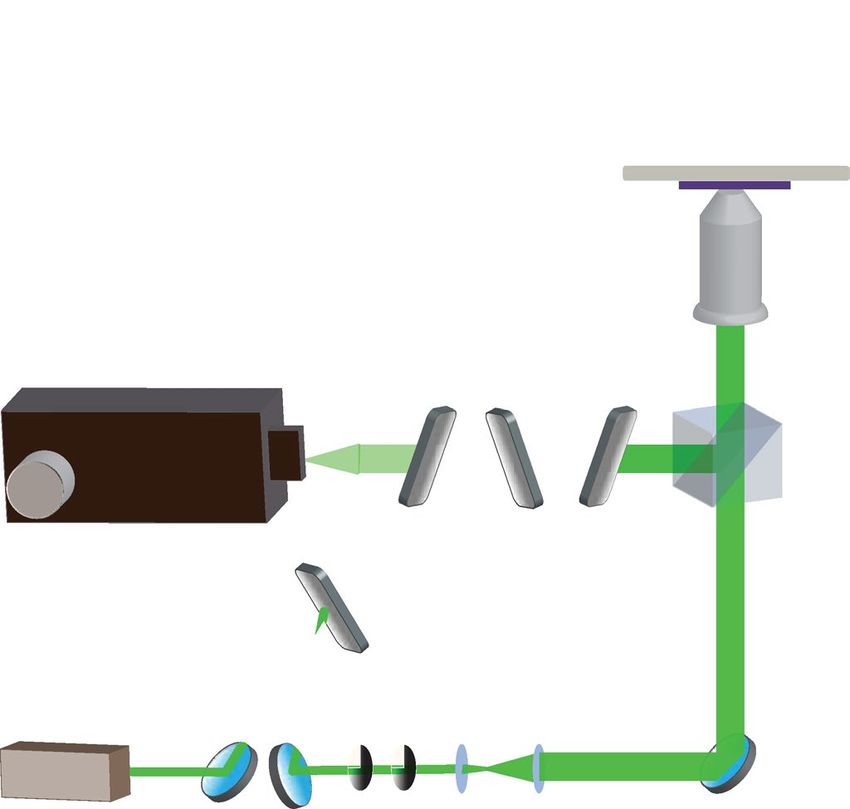
www.nature.com/scientificreports/
Piezo Stage
Sample
Objective
0.90 NA x 100
Spectrometer + CCD
BNF 2 BNF 4
Lens
Beam
Splitter
BNF 3
BNF 1
Beam
532 nm Expander
M1 M2 ND Filters M3
Figure 1. Experimental setup for low-frequency Raman measurement. M: Dielectric mirrors, BNF: Bragg
notch filter, ND Filters: Neutral density filter. One BNF is used to filter the laser line, and the others are used to
block Rayleigh scattered light from the sample.
determine the number of layers up-to a few layers. A Raman image showing the distribution of number of layers,
constructed by the frequency difference of A 1g and E2g modes across the area displayed in Fig. 2(a) is included
in the supplementary information (Fig. S1)). E 2g mode redshifts while A1g mode blueshifts with the increasing
number of layers. With each additional layer, the increasing inter-layer van der Waals forces suppress the atomic
vibrations, effectively increasing the force constants that result in the blueshift of A1g mode57. The redshift of the
E2g mode is attributed to surface effects due to neighboring layers58 and an increase in the dielectric screening
that reduces the long-range Coulombic interaction between the effective charges and thus the overall restor-
ing forces59. Figure 2(b) shows Raman spectra collected from the M oS2 sample shown in Fig. 2(a) at locations
containing different number of layers. For the number of layers up to three or four, strong signals from E 2g and
A1g with opposite shifts can be observed. However, as the number of layer increases beyond four, the changes in
high-frequency modes are insignificant and are often below the instrumental resolution as they converge to the
bulk value, making it difficult for an accurate estimation of the number of layers in multilayered samples. Unlike
the high-frequency modes, low-frequency modes that originate from the interlayer van der Waals interactions,
show higher sensitivity to the number of layers. While the frequency of the out of plane layer breathing mode
decreases, the frequency of the in-plane shear mode increases with increasing number of layers. In MoS2, the
shear mode shifts from 22 cm−1 in bilayer to about 32 cm−1 in bulk38. Figure 2(c) shows the low-frequency Raman
spectra, measured from the same location as in Fig. 2(b) from the MoS2 sample shown in Fig. 2(a). Since the
layers in a few-layered M oS2 are weakly bound as compared to the multilayer bulk M oS2, the overall restoring
forces increase when the number of layers increases, blue-shifting the shear m ode37. Therefore, the frequency
shift of the shear mode can be used to identify the number of layers in a few-layered M oS2 sample. Figure 2(d)
is a Raman image that shows the distribution of the number of layers in the same region as Fig. 2(a), where the
multilayered regions are constructed with the frequency shift of the shear mode, and the single-layer region is
constructed by the frequency differences of the two high-frequency modes A1g and E2g. It should be noted that
single-layered MoS2 does not have low-frequency modes because they arise from the interlayer interactions.
The white regions in the image represent the S iO2/Si substrate, where no MoS2 is present. After determining
the number of layers, we moved on to identify different stacking configurations present in 2-, 3-, and 4-layered
regions of MoS2 sample by utilizing the low-frequency imaging of the layer breathing mode and the shear mode,
which is discussed later.
Layer stacking in multi‑layered MoS2. Natural MoS2 is found to exist in two different polytypes, 2H
and 3R, depending on the sequence in which each layer is stacked. The 2H-MoS2 has a trigonal prismatic coor-
dination of Mo atoms with two S-Mo-S layers connected by van der Waals forces, yielding a hexagonal lattice
structure. In 2H stacking, S atoms of each layer reside directly above the Mo atoms of the lower layer masking the
bottom layer (Fig. 3(a)). The 3R-MoS2 also has a trigonal prismatic coordination of Mo atoms, but with a rhom-
bohedral symmetry and a different stacking order. In the case of 3R stacking, Mo and S atoms of the top layer
lie above the S and Mo atoms, respectively, of the bottom layer, while the S and Mo atoms of the top layer and
the Mo and S atoms of the bottom layer are situated at the center of the hexagons of the other layer (Fig. 3(b)).
Scientific Reports | (2020) 10:21227 | https://doi.org/10.1038/s41598-020-78238-w 3
Vol.:(0123456789)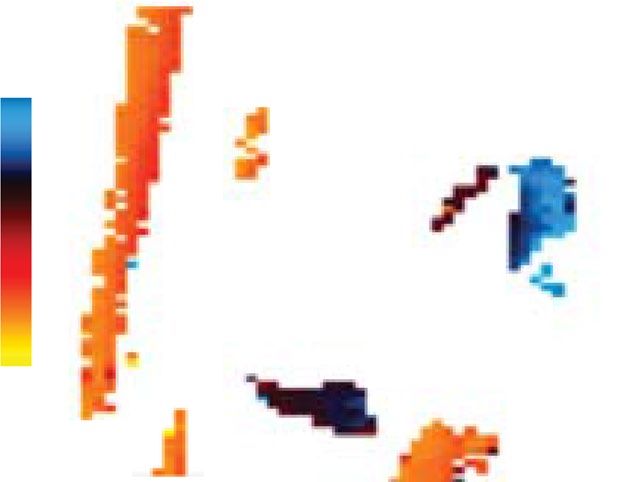
www.nature.com/scientificreports/
Figure 2. (a) optical image of the exfoliated MoS2 sample. A thin residue left by the scotch tape while
exfoliation process, as confirmed from Raman measurements, is also visible in the image. The star indicates such
an area, where the residues are present. (b) High-frequency Raman spectra collected from the M oS2 sample with
different number of layers. (c) Corresponding low-frequency Raman spectra, collected from the same positions
as the high-frequency spectra. The shear mode is indicated by S, while the breathing mode is indicated by B.
The dashed lines show the evolution of the breathing mode and the shear mode with the increase in the number
of layers. (d) Raman image that shows the distribution of number of layers, where the multilayered regions
are constructed by the frequency shift of the shear mode and the single-layered region is constructed by the
frequency differences of high-frequency modes. White regions in the image have no M oS2.
Two‑layered regions. While it is already reported that every stacking configuration has its own low-fre-
quency Raman signature and that any change in stacking configurations can affect the low-frequency Raman
spectra, there are a myriad of other effects that will modify low-frequency Raman modes. The causes for such
alterations include a change in the number of layers or the presence of defects. Therefore, it is made sure that
the changes in the low-frequency Raman modes originated only from the changes in stacking configuration, by
systematically ruling out the possibilities of the change in number of layers or the presence of defects. We have
confirmed this through our parallel analysis that the number of layers is unchanged, and that there are no defects
present in the sample at the measurement location. The experimental results in Fig. 3(c) show two low-frequency
Raman spectra from two different two-layered regions in the sample, and Fig. 3(d) shows two high-frequency
Raman spectra measured at the same location as the low-frequency modes in Fig. 3(c). While low-frequency
Raman modes shows clear shifts, the simultaneously measured high-frequency Raman modes show no notable
change, confirming that there is no change in the number of layers. Similarly, as reported in previous studies18,60,
the presence of defects is expected to result in the broadening of high-frequency Raman modes as well as in acti-
vation of defect induced peaks, both of which were not observed in our measurements. Since these possibilities
Scientific Reports | (2020) 10:21227 | https://doi.org/10.1038/s41598-020-78238-w 4
Vol:.(1234567890)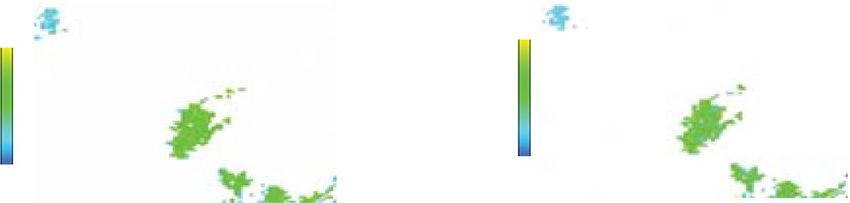
www.nature.com/scientificreports/
(a) (b)
Mo
2H - MoS 3R - MoS
S
side view side view
2H - MoS2 3R - MoS2
top view top view
(c) (d)
2H(1) 2H(1)
Intensity (a.u)
3R(2)
Intensity (a.u)
3R(2)
20 30 40 50 60 70 340 360 380 400 420 440
Raman Shift (cm ) -1 Raman Shift (cm-1)
(e) (f)
Peak Shift (cm-1)
41 7
2
Is/Ib
1
36 5 μm 2 5 μm
Figure 3. Illustrations of the side and the top views of (a) a 2H stacked and (b) a 3R stacked M
oS2 bilayer.
(b) Side and top views of a 3R-stacked two-layered M oS2. (c) Low-frequency Raman spectra representing 2H
and 3R stacking configurations in a two-layered MoS2. (d) High-frequency Raman spectra, taken at the same
positions as the low-frequency spectra. (e) Low-frequency Raman image of two-layered MoS2 constructed by
the frequency shift of the breathing mode. The green and the turquoise colors represent 2H and 3R stacking
configurations, respectively. Raman spectra in (c) and (d) are measured at the locations measured indicated by
the arrow-heads in areas 1 and 2 in (e). (f) Raman image constructed by the intensity ratio Is/Ib. The green and
the turquoise areas represent 2H and 3R stackings, respectively. A Gaussian blurring of 1 pixel was added to the
images using image processing software Fiji (https://fiji.sc/) for a better v iewing61.
are ruled out, we can confirm that any changes in low-frequency Raman spectra observed in our case must have
originated from a change in stacking configuration.
The spectra shown in Fig. 3(c) are identified to be originated from a 2H, and a 3R stacked bilayers, which is
consistent with a previous r eport58. In the 2H stacked region, the peak around 23 cm−1 is identified as the in-plane
shear mode, and the peak at 40 cm−1 corresponds to the out of plane breathing mode. In the 3R stacked region,
while the shear mode stays at 23 cm−1, the breathing mode is found to shift to 37.4 cm−1, which is in good agree-
ment with theoretical calculations52. The peak position of the breathing mode is red-shifted in 3R stacking, while
the shear mode shows almost no change. A red-shift in the breathing mode from 2H to 3R is due to a significant
decrease in the effective force constant. However for shear mode, the effective change in the force constant is
very small, hence its frequency remains almost the s ame58. In order to identify two-layered regions with differ-
ent stacking configurations, breathing mode can be used to construct a Raman image. The shift in the breathing
mode frequency can be used as a tool to identify the differences in stacking configurations. Figure 3(e) shows a
low-frequency Raman image constructed by the frequency shift of the breathing mode in the bilayered regions
within the same area used in Figs. 2(a) and (d). In order to focus on the bilayered regions, only the bilayered
Scientific Reports | (2020) 10:21227 | https://doi.org/10.1038/s41598-020-78238-w 5
Vol.:(0123456789)www.nature.com/scientificreports/
regions in Fig. 3(e) are displayed, and the rest of the area is shown in white color. Two different colors in the
image indicate the distribution of two different stacking configurations, 2H and 3R.
Further, in the two-layered region, the intensity of the shear mode is higher in the 2H stacked region as
compared to the 3R stacked region, as seen in Fig. 3(c), which is also in good agreement with theoretical
calculations52. The effect of stacking configuration on the shear mode intensity can be explained by the interlayer
bond-polarizability model62. When exposed to the applied electric field of the incident light, the charge accumu-
lation at the interlayer region induces dipole moments between the atoms across the layers. Raman intensities
resulting from this dipole moment depend on the direction of the bond. The bond direction is determined by the
atomic arrangement within each layer. When stacking configuration changes, the atomic arrangement and the
effective electronic environment gets altered, thereby changing the bond direction, and varying Raman intensi-
ties. The shear mode in 2H stacking creates larger changes in polarizability due to the relative atomic positions
and displacements compared to 3R stacking, hence has a higher intensity. We can, therefore, identify the 2H
and 3R sequences in the bilayer region by the intensity ratio of the shear mode to the breathing mode. Since our
measurements are diffraction-limited, where each measurement point is about 300 nm in diameter, the measured
areas may include a few nano-sized islands of stacking sequences. In such a case, the stacking configuration can
be estimated as the fraction of the two stacking sequences, 2H and 3R, for any given value of the intensity ratio.
This can be obtained by interpolating the measurement between the two known values. For the 2H region, the
estimated ratio of the intensity of shear mode to that of breathing mode, I s/Ib, is reported to be around 4, while it
was reported to be around 1 for the 3R region54. Any deviation from this value indicates areas with a combina-
tion of stacking sequences of 2H and 3R with certain fractions. Figure 3(f) is a Raman image of the two-layered
regions as in Fig. 3(e), constructed by the intensity ratio of the shear mode to the breathing mode. Here, the
green-colored region represents 2H stacking configuration (Is/Ib values close to 4), while the blue-colored region
represents the 3R stacking configuration (Is/Ib values close to 1). It should be noted that the measurement of
Raman intensity is associated with some measurement error, which brings in some experimental error in the
value of I s/Ib, resulting in an uncertainty in identifying the stacking configuration. Since our sample can have
mixed stacking configurations between 2H and 3R, the stacking configurations can be identified in terms of
fractions between the two configurations. For the red spectrum in Fig. 3(c), the value of the intensity ratio Is/
Ib, together with the possible error in measurement, is estimated 3.6 ± 3. This suggests that the measured area
contains 90 ± 7% of 2H stacking and 10 ± 7% of 3R stacking. Additional low-frequency Raman spectra obtained
from 2H and 3R regions are shown in Figs. S2(b) and (c), respectively, in Supplementary Information. Just as in
Fig. 3(e), all the other areas except the two-layered regions are shown in white color. It should be noted that for
twisted bilayers, the shear mode disappears when the twist angle is between 4—40 d egrees5,44. In such a case,
the twist angle range can be roughly estimated by the lack of shear mode and the frequency of breathing mode.
Hence, the frequency shift of the breathing mode along with the intensity ratio of shear mode to that of breathing
mode, Is/Ib, can be used as effective tools to probe different stacking orders in a naturally stacked MoS2 sample.
Three‑layered regions. For more than two layers, the sample can be basically considered as two-layered
oS2 stacked on top of each other. In a three-layered M
M oS2, there are two parallel stacking sequences, one
between layers 1 and 2, and the other between the layers 2 and 3, both of which can be the same or different at
any given point. The possible stacking configurations are the 2H-2H, the 2H-3R and the 3R-3R arrangements.
Depending on the position of each Mo and S atoms in every layer, 3R configuration can further have four differ-
ent sub-patterns as well42. Three-layered regions in our sample are indicated by a lime-green color in Fig. 2(d).
It should be noted that in case of a three-layered sample, DFT calculations predict two breathing modes (B1 and
B2) and two shear modes (S1 and S2). However, while B2 and S2 modes are Raman inactive for 2H stacked MoS2,
they are extremely weak for 3R stacked MoS2. Therefore, B1 and S1 are the only two low-frequency modes in a
three-layered area that are experimentally observed for either stacking configuration36. Similar to two-layered
regions, in three-layered areas also it is ensured that the changes in the low-frequency Raman modes are indeed
originating from changes in the stacking pattern, by systematically ruling out the possibilities of any change in
the number of layers and presence of defects.
In the case of the 2H-2H stacked region, the shear mode and the breathing mode have almost the same fre-
quency, so they appear to be merged at 27 cm−154. Similar to a two-layered region, the frequency of the breath-
ing mode changes when the stacking configuration changes, whereas the frequency of the shear mode has no
noticeable change. For locating regions with different stacking sequences, a Raman image is constructed by the
frequency shift of the breathing mode, which is shown in Fig. 4(a). Only three-layered regions in Fig. 2(d) are
displayed in Fig. 4(a) and the rest of the area is shown in white color. Regions with different colors in Fig. 4(a)
indicate different stacking configurations. In case of three- and more layered samples, one can estimate a volume
average of the fraction of stacking sequence within the diffraction-limited measurement area. Similar to the two-
layered regions, the Is/Ib value is expected to be around 4 for a perfect 2H-2H configuration and 1 for a perfect
3R-3R configuration52. The intensity of the shear mode decreases as the stacking order changes from 2H-2H to
2H-3R and then to 3R-3R. Therefore, in order to identify distinct stacking configurations, the intensity ratio of the
shear mode to the breathing mode, Is/Ib, can be used. The region where the breathing mode and the shear mode
are merged is identified as the 2H-2H stacked. The shear mode has maximum intensity in this region. However,
since the breathing mode and the shear mode are merged in the 2H-2H region, it is difficult to estimate the exact
value of the ratio, I s/Ib. Therefore, an image cannot be constructed by the intensity ratio of the shear mode to the
breathing mode in a three-layered sample. Figure 4(b) shows a set of low-frequency spectra taken from 3 regions,
marked in Fig. 4(a), with different stacking orders. By assuming I s/Ib ratio to be around 4 for 2H and 1 for 3R
stacking configurations, one can estimate an average fraction of the stacking sequence within the measurement
volume from the measured value of Is/Ib at a given point. From the golden brown-colored spectrum in Fig. 4(b),
Scientific Reports | (2020) 10:21227 | https://doi.org/10.1038/s41598-020-78238-w 6
Vol:.(1234567890)www.nature.com/scientificreports/
(a)
32 5 μm
Peak Shift (cm-1)
2
3
26 1
(b) (c)
2H2H(1) 2H2H(1)
2H3R(2) 2H3R(2)
Intensity (a.u)
Intensity (a.u)
3R3R(3) 3R3R(3)
25 30 35 40 45 50 360 380 400 420 440
Raman Shift (cm-1) Raman Shift (cm-1)
Figure 4. (a) Low-frequency Raman image of a three-layered MoS2 region constructed by the frequency shift
of the breathing mode. Three different colors indicate the presence of three different stacking configurations. A
Gaussian blurring of 1 pixel was added to the images using image processing software Fiji (https://fiji.sc/) for
better viewing61. (b) Low-frequency Raman spectra measured at three locations indicated by the arrow-heads
from three different areas, marked 1 to 3 in (a). While the region marked by number 1 indicates 2H-2H stacked
regions, 2 represents 2H-3R, and 3 denotes 3R-3R regions. (c) High-frequency Raman spectra measured from
the same positions, as the low-frequency spectra in (b).
the value of the intensity ratio Is/Ib, together with the possible error in measurement, is estimated as 1.29 ± 0.06.
This suggests that the measured area contains 90 ± 2% of 3R stacking and 10 ± 2% of 2H stacking. Similarly,
from the red-colored spectrum in Fig. 4(b), the value of the intensity ratio Is/Ib, together with the possible error
in measurement, is estimated 2.33 ± 0.1. This suggests that the measured area contains 56 ± 4% of 3R stacking
and 44 ± 4% of 2H stacking. It should be noted that Is/Ib value is the average value within the diffraction-limited
focal volume. For a better understanding, additional experimental low-frequency spectra obtained from 2H-2H,
2H-3R and 3R-3R regions are shown in Figs. S3(b), (c) and (d), respectively in Supplementary Information.
The breathing mode is found to undergo a clear blue-shift as the stacking configuration changes from 2H-2H
to 2H-3R. But as the configuration change from 2H-3R to 3R-3R, it is found to have red-shift, indicating a weaker
interlayer interaction. The intensity and the frequency of low-frequency Raman modes serve as a unique identi-
fication tool for probing the variation in the stacking configurations in three-layered M oS2 as well, whereas the
high-frequency Raman modes, as shown in Fig. 4(c) display little sensitivity to stacking configurations.
Four‑layered regions. Similar to the case of three layers, a four-layered region of the sample can be con-
sidered as three parallel stackings of two-layered M
oS2 on top of each other, which are between layers 1 and
2, between layers 2 and 3 and between layers 3 and 4. One can therefore find the possibility of multiple stack-
ing sequences at one point. The stacking sequences in a four-layered M oS2 are much more complex than a
two- or a three-layered MoS2. The possible stacking configurations include 2H-2H-2H, 2H-2H-3R, 2H-3R-2H,
2H-3R-3R, 3R-2H-3R, 3R-3R-3R, among many more. Since 3R can have different sub-patterns, the number of
effective stacking configurations increases even more. Therefore, one can only estimate a volume average of the
fraction of stacking sequence within the diffraction-limited measurement area. The four-layered region in our
sample is shown in yellow color in Fig. 2(d). The most widely found stacking configuration in a four-layered
Scientific Reports | (2020) 10:21227 | https://doi.org/10.1038/s41598-020-78238-w 7
Vol.:(0123456789)www.nature.com/scientificreports/
(a) (b)
32
Peak Shift (cm-1)
5 μm 2H2H2H (1)
Intensity (a.u)
1 2H&3R (2)
2 3
18
20 25 30 35 40 45
Raman Shift (cm-1)
(c) (d)
Defective area (3) 2H2H2H (1)
Intensity (a.u)
2H&3R (2)
Intensity (a.u)
Defective(3)
20 30 40 50 360 380 400 420 440
Raman Shift (cm )
-1
Raman Shift (cm-1)
Figure 5. (a) Low-frequency Raman image of four-layered MoS2 regions constructed by the frequency shift
of the breathing mode. Three different colors indicate the presence of three different stacking configurations.
A Gaussian blurring of 1 pixel was added to the images using image processing software Fiji (https://fiji.sc/)61.
(b) Low-frequency Raman spectra measured at the location of the arrowheads in the marked regions 1 and 2,
marked in (a). (c) Low-frequency spectrum measured at the location of the arrowhead in the area marked 3.
The dotted lines show different peaks present in the spectrum. (d) High-frequency spectra taken from the same
positions as the low-frequency spectra shown in (b) and (c).
MoS2 is 2H-2H-2H52,63. The shear mode for this configuration appears at 29.7 cm−1, and the breathing mode
is found at 21 cm−1. Therefore, it is easy to identify the 2H-2H-2H stacking configuration in a four-layered
MoS252,63. Similar to the two- and three-layered MoS2, the changes in stacking configuration can be correlated to
the frequency changes in the breathing mode. Figure 5(a) shows a Raman image constructed by the frequency
shift of the breathing mode in the four-layered region of the sample displayed in Fig. 2(d). For convenience, only
four-layered regions are displayed in Fig. 5(a) and the rest of the area is shown in white color. In the four-layered
region, three different stacking configurations were identified by the frequency shift of the breathing mode,
which is color-coded in Fig. 5(a).
Four-layered regions can have numerous stacking configurations, and we investigated each stacking configura-
tion present in our sample based on the value of the Is/Ib ratio. Figure 5(b) shows spectra taken from the regions
marked by 1 and 2 in Fig. 5(a), which have different stacking configurations. Similar to two- and three-layered
MoS2, based on the I s/Ib ratio (around 4 for 2H and 1 for 3R), one can estimate an average fraction of the stack-
ing sequence within the measurement volume at a given point. From the black-colored spectrum in Fig. 5(b),
the intensity ratio I s/Ib, together with the possible error in measurement, is estimated as 3.62 ± 0.2. This suggests
that the measured area contains 88 ± 6% of 2H stacking and 12 ± 6% of 3R stacking. Similarly, from the yellow-
colored spectrum in Fig. 5(b), the value of the intensity ratio I s/Ib, together with the possible error in measure-
ment, is estimated as 2.47 ± 0.2, suggesting the measured area contains 51 ± 6% of 2H stacking and 49 ± 6% of
3R stacking. Additional experimental low-frequency spectra obtained from 2H-2H-2H and the mixed stacking
(2H&3R) areas are shown in Figs. S4(b) and (c), respectively in the supplementary information. An interesting
observation here is the direction of the frequency shift of the breathing mode. In a two-layered sample, when
the stacking configuration changes from 2H to 3R, the breathing mode undergoes a red-shift. In a three-layered
sample, the breathing mode blue-shifts when the stacking configuration changes from a 2H-2H to a 2H-3R and
Scientific Reports | (2020) 10:21227 | https://doi.org/10.1038/s41598-020-78238-w 8
Vol:.(1234567890)www.nature.com/scientificreports/
then red-shifts as the stacking configuration changes from a 2H-3R to a complete a 3R-3R pattern. However,
in the case of a four-layered sample, the breathing mode blue-shifts as the stacking order changes from a 2H to
a 3R configuration. The reason for this behavior is presently unknown, and further investigation is required to
study this behavior of the breathing mode.
Unlike the other two regions, a spectrum taken from the red-colored area in the circled region 3 shows some
peculiar characteristics, which are not commonly observed in any stacking configuration. In this particular area,
the appearance of multiple peaks is observed, as shown by the dotted lines in Fig. 5(c). More experimental low-
frequency spectra obtained from this area is shown in Fig. S4(d) in the supplementary information. This could
be due to the presence of a twist between some layers. A twist between the layers alters the atomic arrangement
across the layers that causes a considerable change in the interlayer coupling. Various steps involved in the fab-
rication processes of the sample may cause shift and/or rotation of isolated small-sized layers, creating twisted
layers in small regions. A close inspection of the spectrum reveals the presence of two breathing modes and two
shear modes. The peak frequencies of these modes correspond to the peak frequencies of the low-frequency
modes that appear in a four-layered and in a two-layered M oS2. This anomalous behavior can be explained as
an overlap of two close-packed layers with another pair of close-packed layers (2 + 2) 46. The close-packed layers
act as a single unit and create a signature of bilayers, while the overall vibration of the four layers creates the
signature of four layers.
Another possible explanation for the appearance of additional modes is the presence of multiple high sym-
metric stacking patches at a certain twist angle between the l ayers44,47. Whenever there is a translation or rotation
between layers, the stacking pattern changes accordingly. 2H and 3R stackings are interchangeable by translation.
When the twist angle between the layers changes slightly, a transition of stacking patterns occurs. As the angle
deviates further, the size of MoS2 patches with certain stacking configurations get reduced, but new patches with
different stacking patterns emerge, creating a stacking configuration consisting of varying patterns. When layers
are twisted at a certain angle, as shown in Fig. S5 in Supplementary Information, multiple stacking configurations
can co-exist over a small area, which can even be smaller than the diffraction-limited focal spot of the incident
light. Therefore, each pattern can simultaneously contribute its own characteristic low-frequency Raman peaks in
a single measurement, which will result in the existence of multiple Raman peaks. The transfer process involved
in sample fabrication can also create wrinkles in the layers, which will in turn modify low-frequency Raman
spectra in a very similar way.
Another possibility is the presence of defects, such as atomic vacancies that can alter the interlayer interac-
tions. Such defects are found to severely affects the high-frequency Raman modes. Figure S4(e) in Supplementary
Information shows high-frequency Raman spectra taken from the red-colored region. A slight asymmetric broad-
ening of the high-frequency mode A1g suggests the co-existence of a slightly shifted mode that could be activated
by the presence of atomic vacancies, originated at the edge of the Brillouin zone18,60. This can be identified as a
disorder-induced peak and could be an indication of the presence of defects. Figure 5(d) shows high-frequency
Raman spectra measured from the same position as (b) and (d).
As for the number of layers more than four, the frequency of breathing mode decreases further below 10 cm−1,
making it undetectable due to its overlap with the Rayleigh line despite using multiple Bragg notch filters. This
makes it difficult to carry out a detailed analysis of regions with more than four layers.
Conclusions
Here, we presented an experimental approach to probe the stacking sequences in a few-layered MoS2 sample by
low-frequency Raman imaging. These results illustrate the versatility of low-frequency modes not only for assess-
ing the number of layers, but also to probe stacking configurations and the interlayer interactions in MoS2. Since
spatial variations in stacking configuration is intricately linked with the synthesis technique used, point based
characterization techniques need to be evolved into imaging schemes. Low frequency imaging makes it possible
to map the spatial distribution of stacking configuration over the entirety of the sample. The applications outlined
in this study is not limited to M
oS2 but can be extended to other 2D materials as well. As the low-frequency
modes are especially sensitive to the interlayer gap and the coupling between the layers, they have proved to be
valuable in detection of uneven interfaces caused by strain, layer twists or defects. Recent breakthroughs in the
domains of twistronics, valleytronics and nanoelectronics have been assisted by a detailed understanding of 2D
layered materials regarding their uniformity and defect levels. Through this study, we have demonstrated low-
frequency Raman imaging to be one of the best tools available to easily and robustly characterize the sample by
detecting its uneven inter-facial characteristics.
Materials and methods
Sample preparation. A 100-nm-thick gold film was grown on a thin multilayered M oS2 flake that was
exfoliated using scotch tape from a bulk crystal. A thermal release tape was used to peel off the Au layer along
with MoS2 layers beneath it, which was then transferred to the SiO2/Si substrate. The thermal release tape was
released by heating the substrate along with the tape on a hotplate. Gold has a strong affinity for chalcogen atoms
and is known to form a semi-covalent bond with sulfur atoms. The interaction between Au and the topmost
MoS2 layer is stronger than the van der Waals interaction between the same MoS2 layer and the layers under it,
which ideally enables a selective removal of the topmost layer. However, since the interaction between any two
neighboring MoS2 layers is weaker than the interaction between Au and the topmost MoS2 layer, it is possible
that a few layers of M
oS2 are exfoliated, together with the topmost layer. The Au film is subsequently etched off
using KOH/I2 solution. The color contrast in Fig. 2(a) represents the variation in the number of layers across the
sample area.
Scientific Reports | (2020) 10:21227 | https://doi.org/10.1038/s41598-020-78238-w 9
Vol.:(0123456789)www.nature.com/scientificreports/
Raman measurements. A 532 nm laser was focused onto the M oS2 sample by a 100 X objective lens with
an NA of 0.90. The laser power was kept around 1 mW on the sample. The acquisition time was kept at 900 ms
to ensure a good signal-to-noise ratio. Measurements are done with a spectral resolution of 0.5 cm-1 and a spatial
resolution of about 300 nm. The scattered light was collected and dispersed by a spectrometer from Princeton
Instruments (Acton SP2300, Acton, USA), equipped with a grating of 1800 grooves/mm and finally detected by
an EM-CCD camera from Princeton Instruments (Pixis 100, Acton, USA). Bragg notch filters from Optigrate
were used to filter the laser and to reject the Rayleigh scattered light. BNF-1 in Fig. 1 is used as a filter to reject
any possible unwanted wavelengths in the laser beam, while BNF-2, 3 and 4 reject the Rayleigh scattered light.
The tilt angles of the BNFs are adjusted to meet the Bragg condition to provide maximum attenuation of the
Rayleigh scattered light. The dashed arrows in Fig. 1 indicates the direction of reflected light. Unlike BNF-2 and
-4, the tilt angle of BNF-3 is chosen to be different to change the direction of the reflected light for minimizing
the multiple reflections between the filters.
Received: 14 April 2020; Accepted: 18 November 2020
References
1. Novoselov, K. S. et al. Electric field effect in atomically thin carbon films. Science. 306, 666–669 (2004)
2. Guinea, F., Castro Neto, A. H. & Peres, N. M. R. Electronic states and Landau levels in graphene stacks. Phys. Rev. B - Condens.
Matter Mater. Phys. 73, 1–8 (2006).
3. Mak, K. F., Lee, C., Hone, J., Shan, J. & Heinz, T. F. Atomically thin M oS2: a new direct-gap semiconductor. Phys. Rev. Lett. 105,
2–5 (2010).
4. Cao, Y. et al. Unconventional superconductivity in magic-angle graphene superlattices. Nature 556, 43–50 (2018).
5. Liao, M. et al. Precise control of the interlayer twist angle in large scale MoS2 homostructures. Nat. Commun. 11, 2153 (2020).
6. Jiang, T. et al. Valley and band structure engineering of folded M oS2 bilayers. Nat. Nanotechnol. 9, 825–829 (2014).
7. Cao, T. et al. Valley-selective circular dichroism of monolayer molybdenum disulphide. Nat. Commun. 3, 887 (2012).
8. Mak, K. F., He, K., Shan, J. & Heinz, T. F. Control of valley polarization in monolayer M oS2 by optical helicity. Nat. Nanotechnol.
7, 494–498 (2012).
9. Suzuki, R. et al. Valley-dependent spin polarization in bulk MoS2 with broken inversion symmetry. Nat. Nanotechnol. 9, 611–617
(2014).
10. Zhu, H. et al. Observation of piezoelectricity in free-standing monolayer M oS2. Nat. Nanotechnol. 10, 151–155 (2015).
11. Radisavljevic, B., Radenovic, A., Brivio, J., Giacometti, V. & Kis, A. Single-layer M oS2 transistors. Nat. Nanotechnol. 6, 147–150
(2011).
12. Li, B. et al. Single-nanoparticle plasmonic electro-optic modulator based on M oS2 monolayers. ACS Nano 11, 9720–9727 (2017).
13. Lopez-Sanchez, O., Lembke, D., Kayci, M., Radenovic, A. & Kis, A. Ultrasensitive photodetectors based on monolayer M oS2. Nat.
Nanotechnol. 8, 497–501 (2013).
14. Sundaram, R. S. et al. Electroluminescence in single layer M oS2. Nano Lett. 13, 1416–1421 (2013).
15. Kang, Y. et al. Plasmonic hot electron induced structural phase transition in a MoS2 monolayer. Adv. Mater. 26, 6467–6471 (2014).
16. Lee, C. et al. Anomalous lattice vibrations of single-and few-layer M oS2. ACS Nano 4, 2695–2700 (2010).
17. Parkin, W. M. et al. Raman shifts in electron-irradiated monolayer M oS2. ACS Nano 10, 4134–4142 (2016).
18. Mignuzzi, S. et al. Effect of disorder on Raman scattering of single-layer M oS2. Phys. Rev. B - Condens. Matter Mater. Phys. 91, 1–7
(2015).
19. O’Brien, M., Scheuschner, N., Maultzsch, J., Duesberg, G. S. & McEvoy, N. Raman Spectroscopy of Suspended MoS2. Phys. Status
Solidi Basic Res. 254, 1–7 (2017).
20. Rice, C. et al. Raman-scattering measurements and first-principles calculations of strain-induced phonon shifts in monolayer
MoS2. Phys. Rev. B - Condens. Matter Mater. Phys. 87, 1–5 (2013).
21. Kato, R., Umakoshi, T., Sam, R. T. & Verma, P. Probing nanoscale defects and wrinkles in M oS2 by tip-enhanced Raman spectro-
scopic imaging. Appl. Phys. Lett. 114, (2019).
22. Lee, C. et al. Unveiling defect-related Raman mode of monolayer W S2 via tip-enhanced resonance Raman scattering. ACS Nano
12, 9982–9990 (2018).
23. Saito, Y., Verma, P., Masui, K., Inouye, Y. & Kawata, S. Nano-scale analysis of graphene layers by tip-enhanced near-field Raman
spectroscopy. J. Raman Spectrosc. 40, 1434–1440 (2009).
24. Bao, W. et al. Visualizing nanoscale excitonic relaxation properties of disordered edges and grain boundaries in monolayer molyb-
denum disulfide. Nat. Commun. 6, 1–7 (2015).
25. Huang, T. X. et al. Probing the edge-related properties of atomically thin M oS2 at nanoscale. Nat. Commun. 10, 5544 (2019).
26. Zhang, Y. et al. Improving resolution in quantum subnanometre-gap tip-enhanced Raman nanoimaging. Sci. Rep. 6, 1–9 (2016).
27. Zhang, W., Fang, Z. & Zhu, X. Near-field Raman spectroscopy with aperture tips. Chem. Rev. 117, 5095–5109 (2017).
28. Verma, P. Tip-enhanced Raman spectroscopy: Technique and recent ddvances. Chem. Rev. 117, 6447–6466 (2017).
29. Verma, P., Ichimura, T., Yano, T. A., Saito, Y. & Kawata, S. Nano-imaging through tip-enhanced Raman spectroscopy: Stepping
beyond the classical limits. Laser Photonics Rev. 4, 548–561 (2010).
30. Yano, T. A. et al. Tip-enhanced nano-Raman analytical imaging of locally induced strain distribution in carbon nanotubes. Nat.
Commun. 4, 1–7 (2013).
31. Yu, J., Saito, Y., Ichimura, T., Kawata, S. & Verma, P. Far-field free tapping-mode tip-enhanced Raman microscopy. Appl. Phys. Lett.
102, 102–105 (2013).
32. Umakoshi, T., Saito, Y. & Verma, P. Highly efficient plasmonic tip design for plasmon nanofocusing in near-field optical microscopy.
Nanoscale 8, 5634–5640 (2016).
33. Stöckle, R. M., Suh, Y. D., Deckert, V. & Zenobi, R. Nanoscale chemical analysis by tip-enhanced Raman spectroscopy. Chem. Phys.
Lett. 318, 131–136 (2000).
34. Stadler, J., Schmid, T. & Zenobi, R. Nanoscale chemical imaging using top-illumination tip-enhanced Raman spectroscopy. Nano
Lett. 10, 4514–4520 (2010).
35. Li, H. et al. From bulk to monolayer M oS2: Evolution of Raman scattering. Adv. Funct. Mater. 22, 1385–1390 (2012).
36. Zhao, Y. et al. Interlayer breathing and shear modes in few-trilayer M oS2 and WSe2. Nano Lett. 13, 1007–1015 (2013).
37. Tan, P. H. et al. The shear mode of multilayer graphene. Nat. Mater. 11, 294–300 (2012).
38. Zeng, H. et al. Low-frequency Raman modes and electronic excitations in atomically thin MoS2 films. Phys. Rev. B - Condens.
Matter Mater. Phys. 86, 1–5 (2012).
Scientific Reports | (2020) 10:21227 | https://doi.org/10.1038/s41598-020-78238-w 10
Vol:.(1234567890)www.nature.com/scientificreports/
39. Bonaccorso, F., Tan, P. H. & Ferrari, A. C. Multiwall nanotubes, multilayers, and hybrid nanostructures: new frontiers for technol-
ogy and Raman spectroscopy. ACS Nano 7, 1838–1844 (2013).
40. Boukhicha, M., Calandra, M., Measson, M. A., Lancry, O. & Shukla, A. Anharmonic phonons in few-layer MoS2: Raman spec-
troscopy of ultralow energy compression and shear modes. Phys. Rev. B - Condens. Matter Mater. Phys. 87, 1–5 (2013).
41. Zhang, X. et al. Raman spectroscopy of shear and layer breathing modes in multilayer MoS2. Phys. Rev. B - Condens. Matter Mater.
Phys. 87, 1–8 (2013).
42. Puretzky, A. A. et al. Low-frequency Raman fingerprints of two-dimensional metal dichalcogenide layer stacking configurations.
ACS Nano 9, 6333–6342 (2015).
43. Puretzky, A. A. et al. Twisted MoSe2 bilayers with variable local stacking and interlayer coupling revealed by low-frequency Raman
spectroscopy. ACS Nano 10, 2736–2744 (2016).
44. Huang, S. et al. Low-frequency interlayer Raman modes to probe interface of twisted bilayer MoS2. Nano Lett. 16, 1435–1444
(2016).
45. O’Brien, M. et al. Mapping of low-frequency Raman modes in CVD-grown transition metal dichalcogenides: layer mumber,
stacking orientation and resonant effects. Sci. Rep. 6, 1–11 (2016).
46. Tsurumi, J., Saito, Y. & Verma, P. Evaluation of the interlayer interactions of few layers of graphene. Chem. Phys. Lett. 557, 114–117
(2013).
47. Lu, X. et al. Rapid and nondestructive identification of polytypism and stacking sequences in few-layer Molybdenum diselenide
by Raman Spectroscopy. Adv. Mater. 27, 4502–4508 (2015).
48. Zhou, X. et al. Interlayer interaction on twisted interface in incommensurate stacking MoS2: A Raman spectroscopy study. J. Col-
loid Interface Sci. 538, 159–164 (2019).
49. Lin, M. L. et al. Moiré phonons in twisted bilayer M oS2. ACS Nano 12, 8770–8780 (2018).
50. Ling, X. et al. Low-frequency interlayer breathing modes in few-Layer black phosphorus. Nano Lett. 15, 4080–4088 (2015).
51. Lui, C. H. et al. Observation of interlayer phonon modes in van der Waals heterostructures. Phys. Rev. B - Condens. Matter Mater.
Phys. 91, 1–7 (2015).
52. Van Baren, J. et al. Stacking-dependent interlayer phonons in 3R and 2H M oS2. 2D Mater. 6, 025022 (2019).
53. Lee, J. U. et al. Raman signatures of polytypism in Molybdenum disulfide. ACS Nano 10, 1948–1953 (2016).
54. Yan, J. et al. Stacking-dependent interlayer coupling in trilayer M oS2 with broken inversion symmetry. Nano Lett. 15, 8155–8161
(2015).
55. Glebov, A. L. et al. Volume Bragg gratings as ultra-narrow and multiband optical filters. Proc. SPIE 84280C (2012).
56. Desai, S. B. et al. Gold-mediated exfoliation of ultralarge optoelectronically-perfect monolayers. Adv. Mater. 28, 4053–4058 (2016).
57. Bagnall, A. G., Liang, W. Y., Marseglia, E. A. & Welber, B. Raman studies of MoS2 at high pressure. Phys. B+C 99, 343–346 (1980).
58. Luo, X., Zhao, Y., Zhang, J., Xiong, Q. & Quek, S. Y. Anomalous frequency trends in MoS2 thin films attributed to surface effects.
Phys. Rev. B - Condens. Matter Mater. Phys. 88, 1–13 (2013).
59. Molina-Sánchez, A. & Wirtz, L. Phonons in single-layer and few-layer M oS2 and WS2. Phys. Rev. B - Condens. Matter Mater. Phys.
84, 1–8 (2011).
60. Carvalho, B. R. et al. Intervalley scattering by acoustic phonons in two-dimensional M oS2 revealed by double-resonance Raman
spectroscopy. Nat. Commun. 8, 1–8 (2017).
61. Schindelin, J. et al. Fiji: an open-source platform for biological-image analysis. Nat. Methods 9, 676–682 (2012).
62. Luo, X. et al. Stacking sequence determines Raman intensities of observed interlayer shear modes in 2D layered materials-A general
bond polarizability model. Sci. Rep. 5, 1–13 (2015).
63. Na, W., Kim, K., Lee, J. U. & Cheong, H. Davydov splitting and polytypism in few-layer MoS2. 2D Mater. 6, (2019).
Acknowledgements
This work was supported in part by the JSPS Core-to-Core Program, the Grant-in-Aid for Early-Career Scientists
18K14148, the Shorai Foundation for Science and Technology, the Inamori Foundation, the Murata Science
Foundation, and Grant-in-Aid for Scientific Research (A) 19H00870.
Author contributions
R.T.S planned and performed the experiments and wrote the manuscript. P.V. conceived and supervised the
project and T. U co-supervised the project. All authors discussed the results and contributed in finalizing the
manuscript.
Competing interests
The authors declare no competing interests.
Additional information
Supplementary information is available for this paper at https://doi.org/10.1038/s41598-020-78238-w.
Correspondence and requests for materials should be addressed to P.V.
Reprints and permissions information is available at www.nature.com/reprints.
Publisher’s note Springer Nature remains neutral with regard to jurisdictional claims in published maps and
institutional affiliations.
Open Access This article is licensed under a Creative Commons Attribution 4.0 International
License, which permits use, sharing, adaptation, distribution and reproduction in any medium or
format, as long as you give appropriate credit to the original author(s) and the source, provide a link to the
Creative Commons licence, and indicate if changes were made. The images or other third party material in this
article are included in the article’s Creative Commons licence, unless indicated otherwise in a credit line to the
material. If material is not included in the article’s Creative Commons licence and your intended use is not
permitted by statutory regulation or exceeds the permitted use, you will need to obtain permission directly from
the copyright holder. To view a copy of this licence, visit http://creativecommons.org/licenses/by/4.0/.
© The Author(s) 2020
Scientific Reports | (2020) 10:21227 | https://doi.org/10.1038/s41598-020-78238-w 11
Vol.:(0123456789)You can also read