The Costs and Benefits of Blockchain Based Peer-to-peer Energy Trading: An Evaluation from the Perspective of Carbon Emission and Economic ...
←
→
Page content transcription
If your browser does not render page correctly, please read the page content below
The Costs and Benefits of Blockchain Based
Peer-to-peer Energy Trading:
An Evaluation from the Perspective of Carbon
Emission and Economic Value.
Authors              P. Wongthongtham, G. Morrison, X. Liu

Title                The Costs and Benefits of Blockchain Based Peer-to-peer Energy Trading: An Evaluation
                     from the Perspective of Carbon Emission and Economic Value

ISBN

Date                 April 2019

Keywords             Peer-to-Peer Energy Trading, Blockchain, Blockchain Carbon Emission, Blockchain Cost,
                     Renewable Energy, Electricity Market

Publisher

Preferred citation

                                                                                               Report Template 1
Acknowledgements
This research is funded by the CRC for Low Carbon Living Ltd supported by the Cooperative Research Centres
program, an Australian Government initiative
Disclaimer
Any opinions expressed in this document are those of the authors. They do not purport to reflect the opinions or views of
the CRCLCL or its partners, agents or employees.
The CRCLCL gives no warranty or assurance, and makes no representation as to the accuracy or reliability of any
information or advice contained in this document, or that it is suitable for any intended use. The CRCLCL, its partners,
agents and employees, disclaim any and all liability for any errors or omissions or in respect of anything or the
consequences of anything done or omitted to be done in reliance upon the whole or any part of this document.
Peer Review Statement
The CRCLCL recognises the value of knowledge exchange and the importance of objective peer review. It is committed
to encouraging and supporting its research teams in this regard.
The author(s) confirm(s) that this document has been reviewed and approved by the project’s steering committee and by
its program leader. These reviewers evaluated its:
• originality
• methodology
• rigour
• compliance with ethical guidelines
• conclusions against results
• conformity with the principles of the Australian Code for the Responsible Conduct of Research (NHMRC 2007),
and provided constructive feedback which was considered and addressed by the author(s).
© 2019 Cooperative Research for Low Carbon Living
Report Template 2Contents
List of Tables ......................................................................................................................................................................................... 4
List of Figures ........................................................................................................................................................................................ 5
Acronyms ............................................................................................................................................................................................... 6
Executive Summary.............................................................................................................................................................................. 7
Introduction ............................................................................................................................................................................................ 8
Glossary and Key Terms ..................................................................................................................................................................... 9
Potential Benefits and Impacts of Blockchain ................................................................................................................................. 10
RENeW Nexus Project: P2P Energy Trading Case Study............................................................................................................ 11
Energy Use and Carbon Footprint of Blockchain ........................................................................................................................... 14
Blockchain Cost .................................................................................................................................................................................. 16
Conclusion ........................................................................................................................................................................................... 19
Report Template 3List of Tables
Table 1 Base layer blockchain costs comparing with second layer blockchain solution costs ............................................... 17
Report Template 4List of Figures
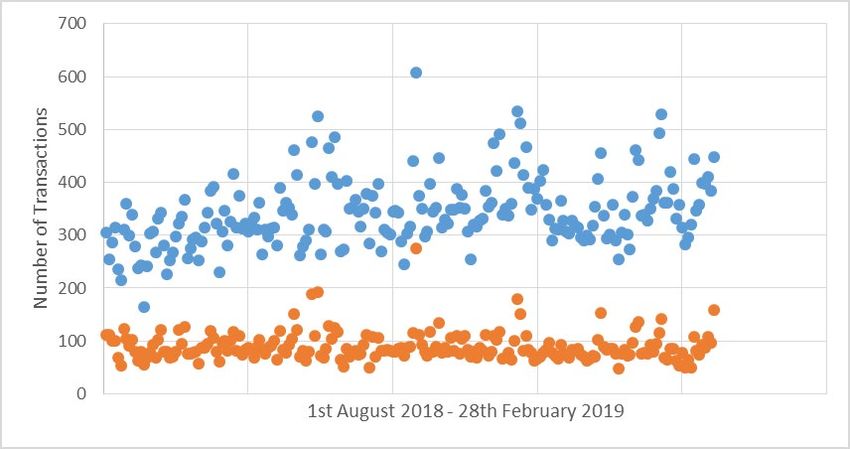
Figure 1 Minimum and maximum numbers of transactions between 1st August 2018 and 28th February 2019 ................ 13
Figure 2 Distribution of minimum and maximum numbers of transactions ................................................................................ 13
Figure 3 Energy consumed to mine blockchain compared to household energy import (energy saving)............................. 14
Figure 4 Blockchain's and household energy consumption in different seasons ..................................................................... 15
Figure 5 Carbon emission from blockchain mining in different countries comparing with carbon emission saving from
Australia in the P2P energy trading model. ............................................................................................................................ 15
Figure 6 Average blockchain cost comparing with household electricity cost .......................................................................... 16
Figure 7 Box-and-whisker plots of household electricity cost comparing with minimum and maximum blockchain costs . 17
Table 1 Base layer blockchain costs comparing with second layer blockchain solution costs ............................................... 17
Figure 8 Cost comparison between base layer blockchain and second layer blockchain solution ........................................ 18
Figure 9 Percentage comparison of household electricity cost saving, base layer blockchain cost, and second layer
solution cost ................................................................................................................................................................................ 18
Report Template 5Acronyms
P2P Peer-to-Peer
PV Solar photovoltaic
TWh Terawatt hour
kWh Kilowatt hour
Mt Metric ton
Report Template 6energy sector using energy commodities as digital
assets to be traded.
Executive Summary
However, concerns over the energy use, the carbon
Australia has over 2 million PV installations given a footprint, and the cost of blockchain have recently
combined capacity of over 11.1 gigawatts as of January generated debate. The carbon footprint and cost of
2019 (2019). This area experienced extremely rapid blockchain are derived from its validation process which
growth between 2010 and 2013 and has continued to requires specialised hardware with computing power and
grow. As Australia’s high capacity of PV installations, vast amounts of electricity. Public perceptions on the
distributed energy markets have been established to impact this technology has on the environment and its
capitalise on the available energy. Several markets are associate costs have also garnered recent negative
being trialled around the world including Peer-to-Peer publicity. This reduces the perception of the benefits of
(P2P) energy trading, business-to-business energy blockchain technology. To investigate the impact of
trading, wholesale and retail energy, energy commodity blockchain, we compare the energy consumed to
trading, and others. The most common market is P2P support blockchain with the total energy saved from the
trading which allows households to trade electricity. electrical grid from deployment of blockchain-based P2P
Blockchain is a type of distributed ledger technology that energy trading.
can be used to securely store digital transactions. The aim of this study is to evaluate the cost and benefit
Blockchain has demonstrated great uptake potential in of blockchain-based P2P energy trading. The energy
P2P energy trading with a growing number of start-up consumed and carbons emitted from the blockchain
companies, pilots, trials, and research projects adopting validation process are quantified. The cost of blockchain
the technology within their business model. The technology is calculated as well to determine its
revolution of blockchain encourages innovation and economic value. This report also provides various
enables a low-carbon transition and sustainability (Juri, insights into the transformation of P2P energy trading
Timo et al. 2016). According to Deloitte (Grewal-Carr V using different blockchain scalability solutions. Real data
and S. 2016) and PWC (Hasse, Perfall et al. 2016) from operating P2P energy trading systems is used in
reports, blockchain has the potential to disrupt the this report.
Report Template 7Rollins et al. 2018) and consumes more energy than
mineral mining to produce an equivalent market value
Introduction (Krause and Tolaymat 2018). Foteinis (Foteinis 2018)
Peer-to-Peer (P2P) trading of energy has emerged as a investigated blockchain carbon footprint and used the
next generation system in energy management that life-cycle impact-assessment methodology to estimate
enables prosumers to trade their surplus electricity and the 2017 global carbon emissions of 43.9 Mt for Bitcoin
allows consumers to purchase affordable and locally- and Ethereum mining (Hileman and Rauchs 2017).
produced renewable energy. The increasing amount of Digiconomist 1 presented Bitcoin and Ethereum energy
distributed power generation from rooftop solar panels consumption indexes and estimated that Bitcoin
provides the opportunity for new electricity markets as consumes 55.76 TWh and Ethereum consumes 8.38
well as potentially enabling a transformation to TWh of electricity annually, equivalent of 0.25% and
customers sharing electricity. In addition, P2P electricity 0.04% respectively of the world’s electricity consumption
markets allow consumers to freely choose the source of (2019, 2019).
their electric energy by, for instance, investing in locally In this report, we evaluate the environmental impact of
produced renewable energy. blockchain technology in terms of its energy use, its
To enable a secure and auditable P2P electricity market, carbon emission production and its economic value. In
innovative technologies are explored. Blockchain addition, different blockchain scalability solutions are
enables consumers to take control of the energy system, studied to explore different options for the transformation
giving them an equal opportunity without the need for a of P2P energy trading systems. We consider both
central regulatory authority. In addition, the adoption of blockchain base layer model and second layer solution,
the blockchain technology in P2P electricity trading unlike many current literatures that only report on base
enables the transition from a highly centralised market layer model. We calculate energy consumption from
controlled by few players, to a more democratic and mining blockchain and then compare with household
decentralised market dominated by microgrids. energy consumption and with energy saving from
According to Deloitte (Grewal-Carr V and S. 2016) and deployment of P2P energy trading. Carbon emitted from
PWC (Hasse, Perfall et al. 2016) reports, blockchain has blockchain usage is calculated and compared with the
potential to disrupt energy sector with energy amount of carbon emitted from household usage and
commodities as digital assets to be traded. with the emission saving from P2P energy trading.
With blockchain-enabled P2P energy trading, prosumers
are able to sell their surplus electricity directly to local
consumers, thereby facilitating mutually beneficial
transactions. Prosumers benefit from this arrangement
by earning more than they would through feed-in-tariffs,
while consumers pay less for their energy per kWh and
are able to take advantage of renewable energy sources
without the need to own the technology. Since a battery
can be used to store untraded electricity, auctions for
renewable electricity can create a dynamic market
profiting both prosumers and consumers. Electricity
retailers and network providers also benefit from a more
efficient market with lower infrastructure costs.
Blockchain based systems also provide privacy and
security to both prosumers and consumers through the
elimination of market intermediaries. Energy supply and
demand are matched in real time between agents with
complementary energy demand profiles, and trading is
conducted uniquely through smart contracts.
Blockchain technology and P2P trading have been
widely discussed in the context of climate change policy
and have been applied in many different climate-related
sectors, from climate investment to carbon pricing. With
the falling price of solar photovoltaic (PV) modules, the
number of households installing PV systems is
increasing; P2P energy trading has become one of the
most popular applications supported by blockchain
technology.
However, there are concerns over the carbon footprint
produced by blockchain. Concern also stems from the
transactional costs that are needed to maintain the
integrity of the decentralised blockchain. Few researches
have embraced mathematical proof and projected that 1
https://digiconomist.net/
blockchain emissions could push global warming (Mora,
Report Template 8Glossary and Key Terms
In order to make this report more understandable to the
wide readership, we provide a glossary of key terms that
are relevant to this report.
Blockchain refers to a type of distributed ledger
technology that has been defined as a trust-less,
distributed, decentralised, transparent, encrypted, and
immutable database (Kuo, Kim et al. 2017, Zheng, Xie et
al. 2017).
Digital cryptographic signature is a mathematical
mechanism that allows one to authorise a transaction
(Katz, Menezes et al. 1996).
Hashrate is the measurement unit of the processing
power dictated by the number of computations being
performed across the network (Rosenfeld 2014).
Smart contract is a piece of programming code that
implements rules to digitally facilitate, verify, and/or
enforce the negotiation (Mik 2017).
Digital keys (public key and private key). Public keys are
widely disclosed and private keys remain undisclosed
(Rivest, Shamir et al. 1978). For ease of reference, the
public key is likened to an individual’s bank account
whereby the private key is the secret PIN to the bank
account (Asolo 2019).
Wallets (single-signature wallet and multi-signature
wallet). The wallet contains digital keys allowing one to
make transactions. A single-signature wallet requires
only one signature from the owner of the private key
while a multi-signature wallet requires signatures from
multiple people before funds will be transferred (Aitzhan
and Svetinovic 2018). A multi-signature wallet increases
the security of the transaction. This is useful when
executing transactions where trust hasn’t yet been
established or when creating community funds.
A crypto currency or token is required to
cryptographically secure the ledger (Wood 2014). The
token may be settled using Fiat currency at the end of
the billing period if required.
Report Template 9companies (Andoni, Robu et al. 2019). The creation of a
time-stamped trading transaction is verifiable and
Potential Benefits and Impacts of transparent. Energy trading transactions are recorded in
Blockchain multi-location data structures, thereby providing
resilience and robustness to the blockchain system. On
Blockchain enabled P2P energy trading allows the other hand, security of energy supply can be
prosumers and consumers to interchangeably trade achieved by increasing the volumes of renewable energy
energy surplus and demand on a virtual P2P basis. and implementing efficient and flexible electricity trading
Energy is still delivered through a physical grid given that markets (M. and SNG. 2017).
demand and supply are managed and controlled to
comply with power system stability. Prosumers and Generally, renewable electricity is not retrieved once it
consumers are directly connected through a trading has been exported to the grid at which point it is
platform in a trust-less network using a distributed amalgamated with the electricity produced from fossil-
ledger. They do not entirely trust each other with degree fuel power plants. Among the total energy mix, a market
of mistrust in the sense that a prosumer or a consumer share of energy from renewable sources can be
is not willing to let others modify the trading transactions established in terms of energy mix procurement. The
or let fraudulent transactions occur. Prosumers are provenance of the energy consumed or supplied can be
incentivised to feed their surplus energy into the tracked using the blockchain technology. The
electrical grid while consumers can purchase energy transparency and provenance attributes offered by
from their peers via the grid at competitive prices. blockchain technology could affect consumer behaviour,
Specific rules or conditions can be set in blockchain resulting in a shift in energy consumption between peak
based P2P trading to allow for transactions which can be and off-peak hours where possible. For example,
independently and automatically verified. For instance, consumers may run energy-intensive appliances during
the funds available in the ledger must be the same hours of solar energy peak production thereby creating
before and after every transaction to prevent fraudulent incentive to adjust their energy consumption.
activities and double spending. A set of rules can be
In summary, the potential impacts and benefits of
established demonstrating the flexibility of the electricity
blockchain for P2P energy trading include:
market model.
In typical trading markets, payment in the trading • Efficient, flexible, and robust renewable electricity
trading market on a virtual P2P basis,
process involves a trusted party such as a central bank
to settle payment transactions. The trusted intermediary • Energy security both cyber security and security of
is responsible for storing, safeguarding, updating, and energy supply,
consolidating the ledger. This incurs transactional,
contractual, and compliance costs and requires users to • Energy cost reduction through energy optimisation,
trust the third party to handle those responsibilities. and
However, there are some substantial disadvantages of • Sustainability by facilitating renewable energy
centralised systems. For example, centralised systems generation and low carbon solutions.
present a single point of failure which is susceptible to
technical failure and cyber-attacks.
In blockchain based P2P electricity trading markets,
intermediaries can be replaced with a distributed
network of digital users or validator nodes, known as
miners, who work in collaboration to verify transactions
and safeguard the integrity of the ledger. The
partnership of distributed users is incentivised using
game-theoretic equilibria and rewards (Adam Back, Matt
Corallo et al. 2014). Blockchain has mechanisms to
ensure that the participants’ accounts are not overdrawn
or double-spent through the consensus process. The
verifiable process for energy transactions in blockchain
makes intermediaries redundant. Blockchain enables
prosumers and consumers to provably agree on energy
trading transactions that are entered by whom and
when, without the need for an intermediary. With
blockchain and IoT support using smart meters, energy
billing between prosumers and consumers can be
processed automatically through smart contracts in real
time. Payment transactions can be made directly to
consumers and prosumers without a central billing
authority. Payments can therefore be made more
frequently such as, for example, every five seconds in
contrast to the common two-month invoice period.
Energy micro-payments and pay-as-you-go solutions are
not only beneficial to consumers but also to utility
Report Template 10important to note that prosumers can be both consumers
and producers of energy. In this report, two blockchain
RENeW Nexus Project: P2P Energy models are explored for P2P energy trading i.e. base
Trading Case Study layer blockchain and second layer blockchain.
The government of Western Australia is the first
Base layer blockchain
government to allow P2P energy trading across the grid
In a P2P energy trading, payment transactions can be
through the RENeW Nexus project. The project is
executed using a blockchain system. Payment
funded by the Australian Government through the Smart
transactions can be initiated and securely recorded on a
Cities and Suburbs Program (Sundararajan 2017). The
decentralised ledger. This is done through the use of
aim of the project is to examine the value and efficiency
smart contracts that enforce predefined rules to calculate
of P2P energy trading in the City of Fremantle. As part of
the energy payment based on the energy tariff spot price
the RENeW Nexus project for P2P energy trading trial,
and consumer-prosumer use, which is recorded by
electric smart meters have been deployed at 50 houses
energy smart meters. The smart contracts are
across the City of Fremantle. The energy data is
executable programs that implement rules for energy
collected at frequent time intervals (down to 5 seconds)
payment calculation. The contracts act as agents that
and transmitted through IoT technology. The data
have a state and functionality and can be triggered
comprises of energy imported from the grid, energy
automatically if a certain condition is met such as the
exported to the grid, energy generated from rooftop PV
trading agreement between consumers and prosumers
systems, energy consumption in households, etc.
is reached. Contract terms are written in computer
During the research and development stage of the trial, language encoding legal constraints and terms of
the RENeW Nexus project uses a private consortium agreement (Swan 2015, Grewal-Carr V and S. 2016)
blockchain at zero transactional cost. However, for the thereby removing the intermediaries and reducing
purposes of this study, the cost of using a public transacting, contracting, enforcement and compliance
blockchain is modelled as the RENeW Nexus may costs (Walport 2016).
transition to a public network upon completion of the
Energy sharing commences between prosumers and
trial. In this report, energy production and consumption
consumers in a P2P trading manner. Payment
data is collected from the houses of 50 participants
transactions are initiated through smart contracts once
between 1 August 2018 and 28 February 2019 (i.e. 7
energy sharing commences. Tariff and energy
months) at 30 minute intervals. The aim of the analysis
imports/exports will be parsed by smart contracts so that
is to model the number of transactions, energy use and
the payment price can be calculated. The transaction
carbon emissions from blockchain mining, and the
record includes the block producers’ identification, payer
transactional costs compared across the two blockchain
ID, payee ID and the payment amount. The list of many
models (i.e. base layer model and second layer model).
transaction records is encrypted using homomorphic
The analysis uses real data collected from the energy
encryption or zero knowledge proof (Wang and Kogan
trading trial in the RENeW Nexus project.
2018), and forms a block. A blockchain miner then
validates the block of transactions and produces a
Blockchain-based P2P Energy Trading candidate book which is broadcast to all participating
nodes on the network. All network nodes validate the
Models transactions using a consensus mechanism. In general,
In traditional form of energy trading, households feed miners check the corresponding accounts to determine
energy into the electrical grid or take energy from the whether participants have sufficient funds to cover the
grid depending on their energy use and production cost of the transaction. If the available funds are
balance. Electricity retailers pay for the surplus electricity sufficient, the transaction is then authenticated and
generated by households’ rooftop solar as incentives at validated by the network. A blockchain is formed by
feed-in-tariff rate. In P2P energy trading, prosumers and linking blocks together through the hash using common
consumers are directly trading the energy. Prosumers block signatures, which effectively maintains a record of
are incentivised to feed the grid with renewable energy past transactions in a linked list.
through payment for the energy they provide, in the form
of a crypto-currency or a crypto-utility-token. Consumers Second layer blockchain
are also incentivised as they are able to purchase As blockchain technology is still in its infancy, it remains
energy from their peers at a competitive tariff price using unclear whether blockchain alone can support the
crypto-currency. The tariff price is set based on the transaction speed or volume required in existing energy
supply and demand of the available renewable energy. markets. Second-layer solutions may increase
The tariff price may be determined through a transaction speed whilst volume can be significantly
cryptocurrency trading market or via a fixed token supply increased without sacrificing security or decentralisation.
and the variable availability of renewable energy. Where A generalised use-case for blockchain-based P2P
the demand for energy is greater than the available energy trading using a second layer solution is outlined
supply of energy on the P2P network, the energy in this section. This model processes all transactions off-
wholesaler must feed the network above the market chain by recording them using a side-chain which uses
price. This further incentivises participants in the network network transaction fees as incentives to keep the
to create excess renewable energy in order to drive network operating autonomously.
down the price of energy and reward prosumers. It is
Report Template 11Participants enter a smart contract by first bonding a provide further participant privacy and security,
commitment payment plus a transaction fee to a multi- transactions being validated and recorded on the side-
signature wallet, which is the smart contract that holds chain may be encrypted using homomorphic encryption
the transaction. For example, participants A and B bond or zero knowledge proofs (Wang and Kogan 2018). The
$500 each as their commitment transaction. The full side-chain ledger may be securely warehoused by
transaction is signed by both parties using digital the regulatory authority for the electrical grid.
signatures and sent to the blockchain for confirmation
and consensus. A digital signature in this case is used to The second-layer blockchain solution allows
authorise a transaction. The multi-signature wallet is instantaneous, low cost transactions of just a few cents
useful in this case due to trust-less nature of the joint per transaction across a network of participants. The
funds. Authorisation of the transaction can be verified P2P electricity trading can be recorded and billed on the
using the participant’s public key. When both parties blockchain for any predefined time period, such as every
countersign a transaction, it is publicly verified that they five seconds or 15 minutes. The recording of
have both approved the transaction. As long as the transactions using a second layer allows the system to
private keys remain in the sole custody of the individual be instantly operated at a very low cost, allowing
participants, no other actor is able to sign the micropayment to be used to fund the transaction fees.
transactions on their behalf. Either or both parties can The off-chain transactions are not recorded on the
commit to enforce the contract at some future date. A blockchain and are enforced with bonded fraud proofs.
copy of the block is also recorded using a side-chain The bonded fraud proofs ensure that the network works
which becomes the root of the side-chain. faithfully and autonomously with minimal to no
downtime. The bond payment does not necessarily have
Energy prices are calculated using the smart contract to come from the households; it may be provided by an
and transactions can be made between the parties as organisation operating a blockchain network.
long as they do not exceed the value of the commitment
payment. Both parties must cooperate, agree to and sign The P2P energy trading incurs large numbers of small
the transactions conducted between them. All parties are transactions between prosumers and consumers
able to make any number of transactions with their because the measured energy value is communicated
counter-parties as long as they have sufficient funds and transacted in real-time. Hence, benefit of second-
available within the payment channel. layer blockchain is that low-value transactions can be
made cost-efficient for P2P trading and second-layer
All off-chain transactions are recorded using a side-chain blockchains would ensure interoperability between
which uses the proof-of-stake consensus (i.e. the transaction systems. Hence the energy trading
commitment bond). Side-chain consensus incentives are marketplace would have low-cost authentication,
taken from the transaction fees. The blocks are validation, and settlement for low-value transactions.
composed into a tree structure in the side-chain. The
depth of the tree will grow as more participants begin In the event of fraudulent or faulty behaviour, the
trading with one another. A fraud-proof system enforces blockchain will penalise the faulty actor. A threshold can
state transitions of the chain hierarchies (Poon and be set to settle transactions for a set time period (e.g.
Buterin 2017). By framing an off-chain transaction entry daily, fortnightly, weekly, or monthly), on a number of
into a child of a side-chain which is enforced by the trading transactions, or where participants cooperatively
parent-chain, this ensures the side-chains can scale with determine a time, or a combination of these. Once a
minimised trust. The channel can be closed or settled certain threshold is met, final settlement transactions will
cooperatively by the parties at which point the contract be sent to the blockchain for confirmation and
issues a refund to the participants based on their final consensus. Upon confirmation and authentication, the
balance, after the last transaction is complete. transactions are written to the ledger and broadcast by
the network. The energy trading network may also be
The final transaction is settled by refunding the left-over the blockchain network whereby participants may be a
funds to the relevant participants. This would usually be blockchain node and agree to have no fees. However,
conducted at the end of a pre-defined billing period, at this approach has some deficiencies as it does not
which time they could continue their participation with leverage the full security value of a large, well-
the trading network by renewing their commitment in a established blockchain of participants which spans a
new contract. In order to record evidence of the side- multitude of different use cases and motivations. Rather,
chain transactions in a public blockchain ledger, only the it is a basic distributed database which is more prone to
Merkle root of the side-chain is recorded. This is the only a coordinated attack and is at a greater risk of being
requirement of the Merkle proofs which ensures the hacked.
validity of side-chain transaction balances without
providing evidence of the individual transactions or price The second-layer solution reduces transaction fees and
on the public chain. The final transaction balance state is facilitates the fast execution of smart contracts.
the only balance written to, and broadcast by, the However, there is a risk that if a very large number of
blockchain network when the contract is closed. This participants exit the contract at the same time, the
provides a private transaction record on a trust-less network may become overwhelmed and may not be able
public blockchain. to process all of the contracts. In this case, the
participants are refunded their initial commitment
For legal and auditing reasons, a full auditable payment and none of the trading transactions is written
transaction record may be required to be maintained by to the ledger. This poses a significant challenge for
the wholesaler or local authority. In this case, in order to energy trading. There is currently no known way of
Report Template 12withholding the electricity entering or leaving the energy Figure 1 Minimum and maximum numbers of transactions
grid based on the execution of a smart-contract for between 1st August 2018 and 28th February 2019
payment. In this case, new regulatory policy would need
to be written for the imposition of a fee and/or a high
tariff charged by the wholesale producer. In the case of
participants being unable to service the smart contract
with sufficient funds, a penalty fee may be applied.
Number of Transactions
The number of transactions reflects the energy balance
between prosumers and consumers which is determined
by the supply and demand of energy. If the amount of
energy imported is greater than the energy exported, this
indicates high levels of energy demand. In contrast, if Figure 2 Distribution of minimum and maximum numbers of
the amount of energy imported is less than the energy transactions
exported, this indicates high levels of energy supply. An
algorithm to calculate the minimum and maximum
numbers of transactions is provided in the
supplementary file. The 7-month RENeW Nexus
minimum and maximum numbers of transactions are
shown in Figure 1.
The distribution of the minimum and maximum numbers
of transactions is shown in Figure 2. The minimum
number of transactions falls primarily between 63 and
116 transactions while the maximum number of
transactions falls primarily between 276 and 407
transactions.
Report Template 13of the mining rig (computer hardware). Then the
blockchain energy requirement was calculated by
Energy Use and Carbon Footprint of multiplying the blockchain power requirement with the
Blockchain time it takes to mine a block (block completion time). To
determine the households’ blockchain energy
In blockchain, miners are incentivised to validate consumption, number of transactions in the RENeW
transactions and ensure the integrity of the network Nexus project was multiplied energy required to mine
thereby eliminating the need for a trusted third party. blockchain and then divide by total number of
Blockchain creates a decentralised administrative data transactions of whole blockchain network.
protocol. However, the validation process requires
intensive computational and heightened electricity The energy consumption is a minimum energy
consumption. To accurately estimate the carbon footprint requirement for a general blockchain network. It is
of blockchains, we study its power consumption and the important to note that the estimation of energy
carbon emissions produced by its mining activities. consumption for mining blockchain do not include energy
Carbon emissions from energy consumption to support used for cooling and maintenance aspects of running
the blockchain mining are evaluated against the mining rigs.
reduction of carbon emissions from energy imported
With any electricity trading platform, electricity is traded
from the grid as results of P2P energy trading.
in a P2P fashion which allows consumers to adapt their
The methodology used to calculate power and energy consumption to achieve desired objectives such as
required for mining blockchain in this report generally minimising electricity costs hence reduces grid imports
follows the process reported in (Bevand 2017, Krause and thereby reduces carbon emissions. Figure 3 shows
and Tolaymat 2018). To calculate the amount of power the maximum and minimum energy consumed to mine
consumed by the entire blockchain network, the daily blockchain grids daily, compared to the energy saved
network hashrate was multiplied by the power efficiency (household energy import).
Figure 3 Energy consumed to mine blockchain compared to household energy import (energy saving)
Report Template 14Figure 4 Blockchain's and household energy consumption in different seasons
Figure 4 shows the average energy consumed in the Miners can locate electricity anywhere; ideally, where
blockchain compared with household energy the cost of electricity is cheap and/or areas where
consumption. While there are seasonal trends in renewable energy sources are available (for example,
household energy consumption, blockchain’s energy Iceland). As the location of miners cannot be
consumption typically remains steady. Blockchain determined, the contribution of emissions in this report is
consumers use a maximum of 226 kWh (an average of estimated using emission factors from selected countries
100 kWh) and minimum of 54 kWh of energy compared (i.e. Australia, USA, Canada, and New Zealand). The
to household energy consumption at a maximum of calculation of carbon emissions is provided in the
1,234 kWh (average of 724 kWh) and a minimum of 446 supplementary file. Figure 5 shows the percentage of
kWh. Blockchain consumed about 20 percent of energy carbon emissions produced by blockchain mining in
saving and about 14 percent of household energy different countries compared with carbon emission
consumption. saving in Australia within the P2P energy trading model.
Figure 5 Carbon emission from blockchain mining in different countries comparing with carbon emission saving from Australia in the
P2P energy trading model.
Report Template 15this report was 21,000 units of gas for a single
transaction (Zainuddin). The blockchain cost is then
Blockchain Cost multiplied by the projected number of transactions.
In order to estimate the cost of blockchain transactions With a standard Western Australia tariff rate of 28 cents
on a public blockchain, the Ethereum blockchain and its per unit, household electricity costs are calculated.
associated costs were used in the analysis. The Figure 6 shows the average blockchain cost compared
Ethereum blockchain is a public network which uses to household electricity costs. It is important to note that
Ether or ETH as its cryptocurrency to pay the transaction on 19 February 2019, the average blockchain cost on
costs of using the network. The Ethereum blockchain the Ethereum network increased to a rate even higher
network uses ‘gas’ as a unit to measure the than total household electricity cost that day. This could
computational work of conducting transactions or smart be a mistake made by an Ethereum developer as there
contracts. The computational work is a measure of time were four transactions that took place on the day with a
spent and the costs of electricity and computing coding error from the same wallet address. Within four
hardware used to execute the codes and finalise the hours, one spent over half a million dollars in transaction
transactions. Gas price, which refers to the cost per unit fees which was the most expensive transaction fees
of gas, is a crucial element for the execution of spent for a cryptocurrency payment (WILLIAMS 2019). It
transactions in the Ethereum. The gas price in Wei units is believed that the developer confused the gas price
is converted into ETH units and then into USD based on with the transaction value and then made a mistake
the current exchange rate. The amount of gas used in (Sukhomlinova 2019).
Figure 6 Average blockchain cost comparing with household electricity cost
Report Template 16Figure 7 Box-and-whisker plots of household electricity cost comparing with minimum and maximum blockchain costs
Figure 7 shows box-and-whisker plots of household ideal solution. The block finality time (i.e. time to put
electricity costs compared with minimum and maximum transactions on the chain) can be set to bypass the
blockchain costs. There are some outliers in the computation cost for every single transaction being
blockchain cost plots. The maximum blockchain cost on recorded in the blockchain. This results in a great cost
19 February 2019 is higher than the highest electricity saving.
cost of households. However, the minimum blockchain
cost on that day is still less than the lowest electricity Table 1 shows the minimum and maximum base layer
cost of households for the whole period. Other than blockchain costs compared with second layer solution
those anomalies, the cost of blockchain is typically lower costs for monthly block finality time. The second layer
than household electricity costs. solution yields a minimum saving of AUD $1,749.67 and
a maximum saving of AUD $5,682.00.
Given that the cost of blockchain can be very high at
certain points, the second layer approach presents an
Table 1 Base layer blockchain costs comparing with second layer blockchain solution costs
Month Min base layer Max base layer Min second Max second Min Saving Max Saving
blockchain blockchain cost layer solution layer solution ($AUD) ($AUD)
cost ($AUD) ($AUD) cost ($AUD) cost ($AUD)
August 503.19 1,614.13 6.53 203.80 496.66 1,410.32
September 266.19 967.56 4.68 48.33 261.51 919.24
October 272.95 1,007.14 4.44 80.48 268.51 926.65
November 219.42 800.40 4.02 41.27 215.39 759.13
December 145.28 623.73 2.25 37.22 143.02 586.51
January 136.02 550.06 2.06 34.34 133.96 515.72
February 233.17 1,034.36 2.56 469.86 230.61 564.50
TOTAL 1,776.21 6,597.38 26.55 915.31 1,749.67 5,682.07
Report Template 17Figure 8 Cost comparison between base layer blockchain and second layer blockchain solution
Figure 8 shows the percentage of savings with the
highest saving in February where the base layer
blockchain cost increased significantly. The lowest
percentage of saving is still high (i.e. above 90%). The
second layer solution yields a significant cost saving.
Figure 9 illustrates a comparison between household
electricity cost savings from P2P trading with base layer
blockchain and a second layer solution. The second
layer solution costs almost nothing compared to
household electricity cost saving from P2P trading.
Figure 9 Percentage comparison of household electricity cost
saving, base layer blockchain cost, and second layer solution
cost
Report Template 18Conclusion
Blockchain is a significant distributed ledger technology
with a great potential for P2P energy trading. Given the
significant interest in using blockchain and distributed
technology for P2P trading, this report explores and
evaluates blockchain based P2P energy trading.
Scalable, robust, and secure P2P energy trading is still
in its infancy however, blockchain technology presents a
promising innovation for energy trading and the
distribution of energy.
To ensure the success of blockchain-based energy
trading, important economic, legal, and regulatory
parameters need to be considered. For example, the
cost of processing trading transactions is lower than
current coordination costs, energy can be traded more
frequently than contemporary regulations allow to reap
the full benefits of renewable energy, competitive prices
for energy producers and prosumers would stimulate the
renewable energy market, P2P trading is assured of
security (e.g. against fraud, criminal violence, participant
misconduct, etc.).
The carbon footprint of blockchain technology and its
associated costs are the areas of concern for
blockchain-based energy trading. This report
investigates the efficient implementation of blockchain
technology for P2P energy trading from the view of costs
and benefits. This report compares energy saving in the
upscale P2P energy trading against energy consumed to
support blockchain systems.
This report also outlines carbon emission savings from
P2P trading against blockchain carbon emissions. As
mining activities can be conducted anywhere in the
world, it is ideal if it is to take place in areas where the
cost of electricity is cheap and/or where electricity is
generated from renewable energy sources. Blockchain
achieves an approximate 20% saving of carbon
emissions if energy is mined in Australia 15% in the
USA, 12% in Canada, and 9% in New Zealand.
To examine the cost of blockchain, we compare the cost
between two models (i.e. base layer blockchain model
and second layer solution model). The second layer
solution model yields a significant cost saving (above
90%) compared to the base layer blockchain. Therefore,
the second layer solution costs approximately 1% and
the base layer blockchain costs approximately 23% of
current household electricity costs.
Data Availability
All data analysed and algorithm developed in this report
are provided in the supplementary file.
Report Template 19Reference
(2019). "Australian PV market since April 2001." Australian PV Institute (APVI) Solar Map, funded by the Australian
Renewable Energy Agency. Retrieved 12 April, 2019, from http://pv-map.apvi.org.au/analyses.
(2019). "Bitcoin Energy Consumption Index." Retrieved 24 April 2019, 2019, from https://digiconomist.net/bitcoin-energy-
consumption.
(2019). "Ethereum Energy Consumption Index (beta)." Retrieved 24 April 2019, 2019, from
https://digiconomist.net/ethereum-energy-consumption.
Adam Back, et al. (2014). Enabling blockchain innovations with pegged sidechains.
Aitzhan, N. Z. and D. Svetinovic (2018). "Security and privacy in decentralized energy trading through multi-signatures,
blockchain and anonymous messaging streams." IEEE Transactions on Dependable and Secure Computing 15(5): 840-
852.
Andoni, M., et al. (2019). "Blockchain technology in the energy sector: A systematic review of challenges and
opportunities." Renewable and Sustainable Energy Reviews 100: 143-174.
Asolo, B. (2019). "Blockchain Public Key & Private Key: A Detailed Guide." from https://www.mycryptopedia.com/public-
key-private-key-explained/.
Bevand, M. (2017). "Op Ed: Bitcoin Miners Consume A Reasonable Amount of Energy—And It’s All Worth It." Bitcoin
Magazine https://bitcoinmagazine. com/articles/op-ed-bitcoin-miners-consume-reasonable-amount-energy-and-its-all-
worth-it.
Foteinis, S. (2018). "Bitcoin's alarming carbon footprint." Nature 554(7691).
Grewal-Carr V and M. S. (2016). Blockchain enigma paradox opportunity.
Hasse, F., et al. (2016). PwC global power & utilities, Blockchain - an opportunity for energy producers and consumers?
Hileman, G. and M. Rauchs (2017). "Global cryptocurrency benchmarking study." Cambridge Centre for Alternative
Finance 33.
Juri, M., et al. (2016). Industrial blockchain platforms: An exercise in use case development in the energy industry.
Katz, J., et al. (1996). Handbook of applied cryptography, CRC press.
Krause, M. J. and T. Tolaymat (2018). "Quantification of energy and carbon costs for mining cryptocurrencies." Nature
Sustainability 1(11): 711.
Kuo, T.-T., et al. (2017). "Blockchain distributed ledger technologies for biomedical and health care applications." Journal
of the American Medical Informatics Association 24(6): 1211-1220.
M., M. and G. SNG. (2017). Blockchain for smart grid resilience: Exchanging distributed energy at speed, scale and
security. the Resilience Week (RWS) 2017, IEEE.
Mik, E. (2017). "Smart contracts: terminology, technical limitations and real world complexity." Law, Innovation and
Technology 9(2): 269-300.
Report Template 20Mora, C., et al. (2018). "Bitcoin emissions alone could push global warming above 2° C." Nature Climate Change 8(11):
931.
Poon, J. and V. Buterin (2017). "Plasma: Scalable autonomous smart contracts." White paper.
Rivest, R. L., et al. (1978). "A method for obtaining digital signatures and public-key cryptosystems." Communications of
the ACM 21(2): 120-126.
Rosenfeld, M. (2014). "Analysis of hashrate-based double spending." arXiv preprint arXiv:1402.2009.
Sukhomlinova, L. (2019). "The mystery of 2100 ETH gas transaction, mistake or something else?". from
https://blogs.airdropalert.com/who-gives-away-2100-eth/
Sundararajan, S. (2017). "Australian Government Grants $8 Million for Blockchain Energy Pilot." from
https://www.coindesk.com/australian-government-grants-8-million-for-blockchain-energy-pilot.
Swan, M. (2015). Blockchain: Blueprint for a new economy, " O'Reilly Media, Inc.".
Walport, M. (2016). "Distributed ledger technology: Beyond blockchain." UK Government Office for Science 1.
Wang, Y. and A. Kogan (2018). "Designing confidentiality-preserving Blockchain-based transaction processing systems."
International Journal of Accounting Information Systems 30: 1-18.
WILLIAMS, M. (2019). "Developer’s Mistake? Someone Just Paid $450K (3,150 ETH) For Ethereum Transaction Fees."
from https://cryptopotato.com/developers-mistake-someone-just-paid-450k-3150-eth-for-ethereum-transaction-fees/.
Wood, G. (2014). "Ethereum: A secure decentralised generalised transaction ledger." Ethereum project yellow paper
151: 1-32.
Zainuddin, A. "Guide to Ethereum: What is Gas, Gas Limit and Gas Price?". from https://masterthecrypto.com/ethereum-
what-is-gas-gas-limit-gas-price/.
Zheng, Z., et al. (2017). An Overview of Blockchain Technology: Architecture, Consensus, and Future Trends. 2017
IEEE International Congress on Big Data (BigData Congress).
Report Template 21You can also read