TAROT: Trajectory-Assisted Routing for Intermittently Connected Networks
←
→
Page content transcription
If your browser does not render page correctly, please read the page content below
TAROT: Trajectory-Assisted Routing for Intermittently
                      Connected Networks

                Matthew K. Bromage                                 James T. Koshimoto                            Katia Obraczka
            Computer Engineering, Baskin                      Computer Engineering, Baskin                Computer Engineering, Baskin
                    Engineering                                       Engineering                                 Engineering
              University of California at                       University of California at                 University of California at
                    Santa Cruz                                        Santa Cruz                                  Santa Cruz
                  California, USA                                   California, USA                             California, USA
            mbromage@soe.ucsc.edu jkoshimo@soe.ucsc.edu                                                       katia@soe.ucsc.edu

ABSTRACT                                                                                 General Terms
We introduce TAROT (Trajectory-Assisted ROuTing), a                                      Algorithms, Performance, Reliability
DTN routing framework that detects and extracts structure
in node movement in real-time. TAROT is motivated by
the postulate that mobility, in particular human mobility
                                                                                         Keywords
such as vehicles, is seldom random and thus exhibits rec-                                delay tolerant networks, routing, ad-hoc networks, intermit-
ognizable patterns. TAROT ’s mobility pattern extraction                                 tent connectivity
capabilities transcends current solutions that rely on abbre-
viated (in some cases, instantaneous) snapshots of mobility                              1. INTRODUCTION
history. TAROT is therefore able to predict future mobil-
ity with increased accuracy. Routing decisions are guided by                                Finding a path from a source to some destination, i.e.,
node mobility patterns, ultimately resulting in more efficient                             routing, is one of the core functions in a communications
routing and forwarding of messages. Our approach is capa-                                network. Many routing algorithms and protocols have been
ble of accommodating conditions where the best node may                                  proposed targeting wired–, infrastructure-based wireless–,
be one that is currently moving away from the destination.                               as well as multi-hop ad-hoc wireless networks (MANET).
In its current implementation, TAROT uses a “controlled                                  However, most “traditional” routing solutions assume that
epidemic” approach to route messages in which nodes will                                 there exists an end-to-end route between communicating
only be “infected“ with a message if their mobility pattern                              nodes, and therefore treat the absence of a route as a fault.
takes them closer to the destination.                                                    When disconnections are detected in these networks, the
   We evaluate TAROT ’s performance through simulations                                  underlying routing protocol recovers by trying to find an
using the QualNet network simulator. A side-by-side com-                                 alternate path. However, these “traditional” techniques (in-
parison against Epidemic Routing [26] under a variety of                                 cluding MANET routing protocols such as AODV [20] and
mobility and workload scenarios show that TAROT is able                                  DSR [12]) are not designed to handle frequent, arbitrarily
to match Epidemic’s high data delivery guarantees at sub-                                long-lived connectivity disruptions, and will subsequently
stantially reduced overhead (over 60% in some of our ex-                                 suffer considerable performance degradation.
periments). TAROT ’s efficiency comes at the price of a                                       Networks exhibiting connectivity disruptions as part of
slight increase in delivery delay (around 20% in our experi-                             their normal operation were first proposed in the context of
ments). We argue that applications that use intermittently-                              long propagation delay environments such as the so-called
connected networked environments are inherently tolerant                                 “Interplanetary Networks” [10]. They were then referred to
of delay, and therefore favor slight increases in delay for in-                          as “delay-tolerant networks”, or DTNs. Later, these pro-
creased efficiency and reduced resource consumption.                                       tocols were adapted for more terrestrial applications. In
                                                                                         these scenarios, long delays were a result from connectiv-
                                                                                         ity disruptions which were caused by a variety of factors
Categories and Subject Descriptors                                                       such as wireless channel impairments, node mobility, sparse
C.2.1 [Network Architecture and Design]: Wireless Com-                                   deployments, duty-cycled node operation, or a combination
munication; C.2.2 [Network Protocols]: Routing Proto-                                    thereof. This new type of network which came to be known
cols                                                                                     as “disruption-tolerant networks,” also DTNs, was designed
                                                                                         to tolerate frequent, arbitrarily long disruptions in connec-
                                                                                         tivity.
                                                                                            There are many interesting DTN applications which span
Permission to make digital or hard copies of all or part of this work for                from the creation of an “Interplanetary Internet” [10] to im-
personal or classroom use is granted without fee provided that copies are                proving the quality of life for people living in the poor-
not made or distributed for profit or commercial advantage and that copies               est parts of the world. For example, a DTN can leverage
bear this notice and the full citation on the first page. To copy otherwise, to          the transportation infrastructure (bicycles, scooters, busses)
republish, to post on servers or to redistribute to lists, requires prior specific       and effectively “bridge the digital divide” by connecting re-
permission and/or a fee.
CHANTS’09, September 25, 2009, Beijing, China.                                           mote communities and rural villages to the Internet. This
Copyright 2009 ACM 978-1-60558-741-7/09/09 ...$10.00.                                    has been the subject of previous research efforts such as

                                                                                     9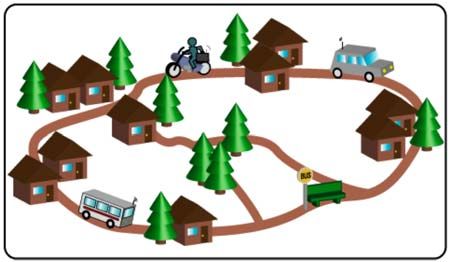
One solution to reducing the overhead is to employ a
“controlled-replication” technique. The “Spray-and-Wait”
protocol [23] is an example of a solution which seeks to
limit the number of copies floating around in the network
by selectively choosing the number of nodes which will re-
ceive duplicates. This is done by calculating an estimate of
the total number of nodes in the network using “encounter-
timers”. A message can therefore be replicated to a node’s
neighbors until the number of copies reaches a fraction of
the network nodes. This work was later extended [24] to al-
low nodes carrying replicas to forward those packets to other
nodes in the network in order to increase the delivery ratio.
TAROT uses a “controlled-replication” scheme which uti-
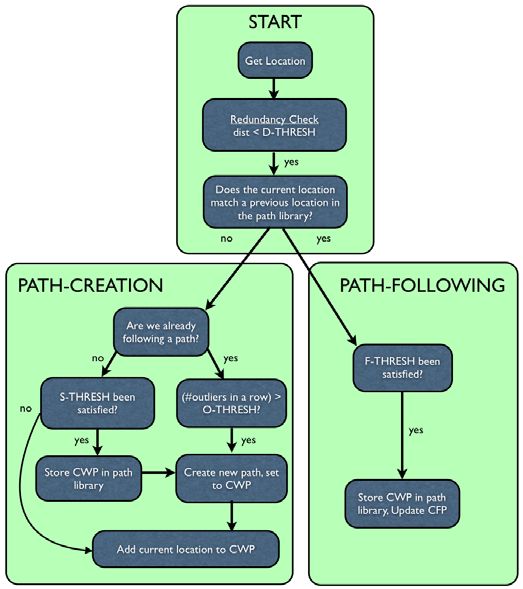
Figure 1: A sample village scenario with various lizes an advanced metric to determine which nodes are can-
types of mobility. The mobility of vehicles tend didate to receive copies. The metric is calculated using a
to exhibit patterns such as recurring paths. The distributed Path Detection (PD) algorithm (described in
path information can be leveraged to make more Section 3) which serves to extract the structure exhibited
informed routing decisions in a hop-by-hop oppor- by the mobility of the nodes in the network. The structure
tunistic manner. information allows for an increased accuracy in the predic-
tions of future mobility due to the fact that paths indicate
a sequential time-series of movements, as opposed to simply
keeping a history of the previously visited locations. These
KioskNet [9] and UnitedVillages [25]. Communities in such predictions in turn are directly linked to the decision for a
areas may benefit from applications such as digital medi- node to carry a message towards some destination. If a node
cal records synchronization, news and educational content has a high probability of reaching that destination, it should
dissemination, remote diagnosis services, multi-media com- request a copy of the message in order to provide timely de-
munications, and local agricultural pricing indices. There livery. For example, in the simple village scenario depicted
is also a growing demand for transcription services where in Figure 1, the mobility patterns of the nodes can be in-
paper documents are converted to digital copies which are ferred and used to propagate messages efficiently across the
then uploaded to the Internet for delivery. This application network.
in particular could be a viable source of additional revenue TAROT does not require global or local neighborhood
for the villages. state information to be disseminated or maintained, there-
There are also many other exciting multi-disciplinary ap- fore consuming less resources in terms of message overhead,
plication domains for DTNs. For example, environmen- processing and storage requirements, and ultimately energy
tal and habitat monitoring systems such as ZebraNet [13] requirements. Of course the more global state each node is
and DeerNet [7] map the mobility (among other things) aware of, the more efficiently messages can be routed across
of animals using wireless sensor network (WSN) devices. the network. However, a study into the various levels of
These projects can have significant scientific and societal state information nodes are allowed access to, shown in [11],
impacts as we learn more information about animal migra- indicates diminishing returns.
tions, inter-species interactions, and how to track emerging The paper is organized as follows: the next section pro-
diseases. vides an overview of the TAROT protocol, outlining each of
In order to accomplish a level of connectivity in the above the functional blocks. Section 3 discusses the Path Detec-
applications, DTNs require a new routing paradigm which tion (PD) algorithm, followed by a discussion of the Rout-
no longer treats frequent and arbitrarily long-lived connec- ing Decision Engine (RDE) in Section 4. Section 5 will then
tivity disruptions as faults, but rather as a normal state of showcase the results of applying PD in combination with
operation. As a result, an extension to traditional “store- RDE in a variety of scenarios. Finally we summarize the
and-forward” routing has been proposed for DTNs. The paper with related work and conclusion.
“Store-carry-and-forward” [8] paradigm was created to ef-
fectively bridge partitions in the network through the use of
mobility. Here, a node stores and carries data for destina- 2. OVERVIEW
tions to which it currently has no route until an opportunity TAROT (Trajectory-Assisted Routing) uses inferred node
to forward the data presents itself. This type of “mobility- trajectories (also referred to here as paths) to make in-
assisted routing” therefore uses “contact opportunities” dur- formed routing decisions within the network. To accomplish
ing node encounters to perform “opportunistic routing”, a this, TAROT uses two core algorithms: the Path Detec-
popular approach to DTN routing. A notable example is tion (PD) algorithm and the Routing Decision Engine
the Epidemic Routing protocol [26], which, at every contact (RDE). The PD algorithm is the mechanism which extracts
opportunity, passes a copy of the message to the encountered structure from the mobility of the node. The structure is
node (replication). Clearly, in non-congested networks, epi- stored in a “path library” which contains a list of commonly
demic will find the shortest-path to the destination if/when followed paths. Each node maintains its own path library,
it exists. However, this is accomplished at considerably high and paths are not exchanged in the network. The RDE,
overhead, i.e., excessive number of duplicate messages cir- is responsible for making routing decisions such as the for-
culating in the network. warding and replication of messages. The RDE uses the
path library to make the comparative distance calculations,
described further in Section 4.
10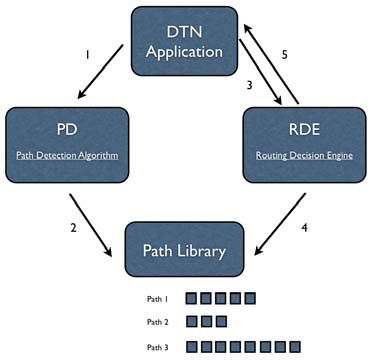
Figure 2: TAROT functional blocks. 1) The appli-
cation sends the current location to the Path Detec-
tion (PD) algorithm. 2) The PD algorithm extracts
paths and stores them in the path library. 3) When
two nodes encounter, the application sends a list of
message destinations to the RDE. 4) The RDE uses
the path library to decide whether to forward or
replicate. The squares under the path library indi-
cate a time-series of coordinates for each path. 5)
The decision is passed back to the application.
                                                                       Figure 3: Flowchart for the Path Detection (PD)
                                                                       algorithm indicating the PATH-CREATION and
   Figure 2 depicts the process where a delay-tolerant ap-             PATH-FOLLOWING modes of operation. The pro-
plication would utilize TAROT. The application sends the               cess is repeated for each sampled coordinate.
current location of the node to the PD algorithm in regular
intervals (step 1) so that the PD algorithm can build the li-
brary of paths (step 2). In parallel, the application monitors
for encounters with other nodes. During an encounter, the              continue building the path.1 This will ensure that path files
application sends a list of destinations sent by the encoun-           are not overly segmented, allowing for longer paths and bet-
tered node to the RDE (step 3). The RDE uses the path                  ter accuracy in predicting future mobility.
library (step 4) to calculate the closest distance the node can           The PD algorithm allows for nodes to be in one of two
get to each destination, and determines whether each packet            states: PATH-CREATION or PATH-FOLLOWING. The
should be requested for replication by the encountered node            decision flow chart for each of these states is depicted in
or simply ignored. The RDE then reports each decision back             Figure 3. During PATH-CREATION, nodes used their sam-
to the application (step 5).                                           pled location to build a library of routinely followed paths.2
                                                                       Currently, we sample once every five seconds. The high sam-
                                                                       ple rate avoids the need for interpolating between successive
3.   PATH DETECTION (PD)                                               samples, which significantly simplifies the path creation pro-
   At the core of the TAROT protocol is the Path Detection             cess. In the PATH-FOLLOWING mode, nodes are able to
(PD) algorithm. Performing PD allows a node to predict its             track their progress using paths contained in the path li-
future mobility with increased confidence. We will use the              brary.
words “path” and “trajectory” interchangeably.                            To create a new path, state variables and thresholds are
   Detecting a path involves making a determination about              required for each node. The Current Working Path
when the path should end. There are two ways to do this.               (CWP) keeps track of which path in the path library is
The first method detects if a node has been following a “cy-            actively being edited during PATH-CREATION. The Cur-
cle”, i.e., the node begins to re-trace a trajectory from the          rent Followed Path (CFP) indicates which path the node
origin for more than three positions. The second way a path            is following when the node is in the PATH-FOLLOWING
can be established is if the node is stationary for a period
                                                                       1
of three minutes or more. These parameters were selected                 We note here that the GPS devices used (Pharos iGPS-500)
based on field tests of vehicles in an urban setting which              contain some inherent drift in accuracy, therefore a subset
included stops at stop signs, traffic lights, bus stops, and             of the readings should be identified as one-time anomalies,
                                                                       or “outliers”, and should be ignored.
other interruptions in mobility which should not account for           2
                                                                         Currently there is no limit to the number of paths that can
a path to be ended. For example, a path that crosses over it-          be stored in each node’s “path cache”. However, it would be
self should not be treated as multiple paths; instead it should        relatively straightforward to age path table entries, e.g., by
be identified as a path crossing, and the algorithm should              recency, to limit path storage requirements.

                                                                  11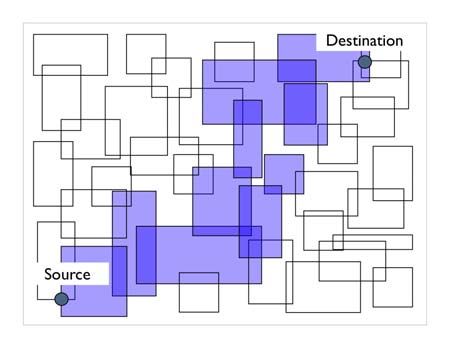
state. The Follow Threshold (F-THRESH) ensures a
node is following a path, instead of crossing over a path. The
Outlier Threshold (O-THRESH) is used during PATH-
FOLLOWING to identify “outlier” locations. An outlier is
defined as an “unexpected” node location that does not exist
on the path the node is currently following. This could be
caused by an anomalous GPS reading, in which case when
the node returns to following the path. If the O-THRESH is            Figure 4: UCSC campus shuttle system routinely
reached, the node then switches to PATH-CREATION. The                 followed paths. From left to right: upper campus
Stop Threshold (S-THRESH) identifies locations which                   shuttle, core shuttle, loop shuttle.
are used to finalize a path; meaning no more new locations
will be added to the CWP. The S-THRESH is currently
set to 3 minutes to account for events such as stop signs
and traffic signals. Different values could be used depending            3.2 PATH-FOLLOWING
on the types of mobility targeted. Finally, the Distance                 Once a path has been entered into the path library, a node
Threshold (D-THRESH) defines the maximum distance                      is capable of following that path using PATH-FOLLOWING.
between two reported locations in order to be treated as              If a node’s current location matches a previously seen loca-
the same location. The value is set at roughly 100 meters.            tion in a path file stored in the path library, and the F-
This is to account for the drift associated with current GPS          THRESH has been satisfied for that path, the node is said
technology, as well as to address the fact that during PATH-          to be following the corresponding path (the CFP). The node
FOLLOWING, location samples will not always line up pre-              continues to follow that path until it encounters positions
cisely.                                                               that do not correspond to the CFP (the positions do not
                                                                      need to be in order). If the positions do not match other
                                                                      paths in the path library, they are considered to be “out-
3.1 PATH-CREATION                                                     liers” and a new path is created.
                                                                         PATH-FOLLOWING is crucial to the TAROT protocol.
   In PATH-CREATION, a node actively creates a reposi-
                                                                      The path files provide a stronger confidence value that a
tory of routinely followed paths. There are three ways a
                                                                      node will visit some location within some amount of time
node can enter the PATH-CREATION mode: (1) the re-
                                                                      in the future. In fact, if a node is following a path, it can
ported location is new and the path library is empty, (2)
                                                                      make estimates on the distance and time required to visit
during PATH-FOLLOWING, the number of outliers meets
                                                                      any subsequent locations on that path.
the O-THRESH, or (3) the CWP is finalized because the
                                                                         There are several improvements that can be made to the
stop threshold (S-THRESH) has been reached and upon re-
                                                                      PD algorithm. For example, dynamic thresholds and sam-
suming, the node begins to build a new path. For example,
                                                                      ple times can be used to account for various inferred types
this situation occurs when a node is parked in some location
                                                                      of mobility being exhibited (human, vehicle, aerial). Path
for longer than the S-THRESH. This would indicate that
                                                                      aging can also be used for improved accuracy.
the location should be classified as a stopping point, ending
the path file and starting a new one.
   Each sampled location must pass a redundancy check in              4. ROUTING DECISION ENGINE (RDE)
which the node verifies it is sampling the same location re-              The Routing Decision Engine (RDE) uses information on
peatedly, such as for a stop sign. A node will add the cur-           mobility patterns exhibited by nodes to make decisions on
rent location to the CWP if the point passes the redundancy           how to forward messages during node encounters, as shown
check, the node is not currently following a path, and the S-         in Figure 2.
THRESH has not been reached. If the S-THRESH has been                    Currently, the RDE uses a “controlled” epidemic approach
reached, the node finalizes the CWP, adds the finalized path            to take advantage of epidemic routing’s inherent redundancy.
to the path library, and starts a new path file.                       By controlling the number of relay nodes which receive a
   A path is finalized when either the S-THRESH has been               copy of the message, TAROT is able to reduce the network-
reached (as described above), or if a node begins retracing           wide overhead. Messages are limited to nodes exhibiting a
its steps at any point on its CWP. Once the F-THRESH                  high likelihood of either carrying or forwarding the message
has been met, the node switches to PATH-FOLLOWING                     to the destination. Nodes with highly structured mobility
(Section 3.2).                                                        patterns can make more informed decisions which are based
   Finalizing a path requires the node to calculate the total         on their future mobility predictions, and thus the likelihood
length of the path and the time to complete the path from             they will encounter the destination. A node with no dis-
start to finish. This information is stored as meta-data asso-         cernible structure in its mobility has a difficult time making
ciated with the path and can be used by the routing decision          any informed decision, and has previously been referred to
engine as described in Section 4.                                     as a “taxi” node [5].
   The decision process involved in PATH-CREATION is                     TAROT is able to handle heterogeneous mobility scenar-
outlined in Figure 3. Figure 4 shows three example paths              ios, i.e., different degrees of mobility structure within the
extracted from the mobility of campus shuttles using the PD           same network. For instance, it can accommodate highly
algorithm. The shuttles followed different routes and were             structured mobile networks such as the one shown in Fig-
equipped with GPS devices to record mobility traces. The              ure 5, networks with no mobility structure whatsoever (e.g.,
traces were then fed into the PD algorithm and a single path          a network of “taxi” nodes), and varying degrees of structure
file was created for each bus to verify that their bus routes          present in the mobility of the nodes.. When the RDE en-
were correctly inferred.                                              counters a node which exhibits no structure in its mobility,

                                                                 12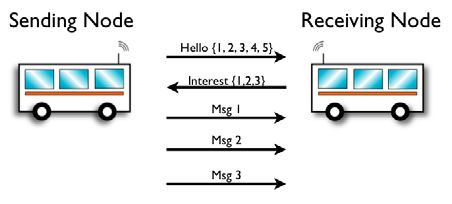
Figure 6: Handshake during an encounter. The
                                                                        SendingN ode sends a Hello Message containing a
                                                                        summary vector of messages it carries.           The
                                                                        ReceivingN ode then sends an Interest Message for the
                                                                        messages it should relay. The SendingN ode then for-
                                                                        wards a copy of those messages.
Figure 5: A sample route used by TAROT ’s con-
trolled epidemic forwarding approach. The light-
shaded rectangles indicate structured mobility pat-                     Hello Messages.
terns detected by TAROT ’s PDA. The dark-shaded                           These messages are transmitted once every second by ev-
rectangles indicate nodes selected to carry message                     ery node in the network. They are used to locate neighbor
replicas from Source to Destination.                                    nodes as well as to provide a list of messages IDs (message
                                                                        summary vector). The summary vectors used in TAROT are
                                                                        similar to the ones used in Epidemic Routing [26], but also
                                                                        include, for every message in the vector, (1) the destination
the algorithm will default to a purely epidemic approach to             ID and (2) the SendingN ode’s distance to that destination.
transferring messages. This is to ensure that opportunities
to replicate are not missed, as they could be vital to forming          Interest Messages.
a path to the destination. Only nodes which have some de-                  These messages are sent by a ReceivingN ode and re-
gree of knowledge that they are not heading in the direction            ceived by the SendingN ode during an encounter, and spec-
of the destination will not receive copies of the message in-           ify which messages the SendingN ode should relay. If either
tended for that destination. We plan to optimize this further           the ReceivingN ode or the SendingN ode is not following
in future work.                                                         a path, a forecast of future mobility cannot be made with
                                                                        high enough confidence, and therefore TAROT will default
4.1 Controlled Epidemic Forwarding                                      to using pure epidemic routing until a path has been es-
   As illustrated in Figure 6, when two nodes encounter one             tablished for both nodes. If, however, both nodes are fol-
another, they perform an initial “handshake” to avoid un-               lowing a path and the ReceivingN ode can get closer than
necessary data exchange between nodes. The SendingN ode                 the SendingN ode to a destination, the ReceivingN ode re-
sends a summary vector of locally stored messages in a                  quests all messages for that destination which it does not
HelloP acket, which is received by the ReceivingN ode. The              yet already have using an InterestM essage.
ReceivingN ode analyzes the HelloP acket and calculates a
distance to each destination listed using its path library.             Data Messages.
If the ReceivingN ode predicts that its future mobility will              Once the SendingN ode receives the Interest Message from
bring it closer towards the destination when compared to the            the ReceivingN ode, the SendingN ode will replicate and
SendingN ode, it will request that message using an Interest            transfer all messages listed in the Interest Message. Data
Message, upon which the SendingN ode will then replicate                Messages transfer the message for a single message ID.
the message requested.
   At this point, a few considerations are in order. We are             4.2 Discussion
currently considering static destinations whose locations are              An intelligent combination of replication and forwarding
known. A location directory service could be used to pro-               of messages can be leveraged to reduce the overhead even
vide destination location information. However in previous              further by forwarding the original message when a repli-
work, in particular geographic routing approaches such as               cation is not necessary (i.e. the confidence that the node
GPSR [14], the location of the static destinations is assumed           will reach the destination is extremely high, or the message
to be global knowledge for simplicity. We should also note              priority is low). Also, improvements can be made such as
that the replication scheme described above uses a “greedy”             routing to mobile destinations, and providing a mechanism
approach as, at every encounter, it tries to get “closer“ to the        to disseminate location updates of destinations of interest in
destination. It is inevitable that a local minima may arise.            the network. We also plan to take into account a node’s en-
Because our protocol replicates messages instead of only us-            tire path library, in addition to looking at the current path,
ing forwarding techniques, local minima can be avoided by               when making routing decisions.
provided redundant copies of messages in the network.
   Below, the messages exchanged during a node encounter
are described in more detail:

                                                                   13
5. RESULTS
Table 1: Single Flow Averaged Results
We test TAROT using a variety of experiments including Experiment Protocol Delivery Delay Overhead
single flow, multiple flow, variable structure, and real mobil- Ratio (sec) (msgs)
ity traces taken from the UCSC campus shuttles. To com-
pare, a version of Epidemic [26] has been implemented. We Epidemic 60% 716 2733
Cold Start
use the following metrics as the basis for comparison: mes- TAROT 54% 528 1608
sage delivery ratio, average delay (excluding messages still Epidemic 100% 1116 5870
Cold (ext)
en route), and message overhead (calculated as the number TAROT 100% 1222 3913
of replicas created during the simulation). Epidemic 100% 1066 5573
Warm (ext)
TAROT 100% 1432 2111
5.1 Simulation Setup
We use the Qualnet simulator to verify the effectiveness of
TAROT. The common simulation setup is as follows. Each
sourcing data packets in order to allow for 100% delivery
simulation uses 60 nodes: 10 static destination nodes and
ratio. The cold start starts sourcing data at 0 seconds and
50 mobile nodes. The locations of the destination nodes
are evenly spaced across the square boundary area sized ends the simulation at 2000 seconds. Cold start extended
9.1908km2 . There are two types of mobility modes a node ends the simulation at 5000 seconds, and warm start ex-
tended starts sourcing data at 1000 seconds and ends the
may use: structured and unstructured. Structured nodes
simulation at 5000 seconds.
follow rectangle shapes of which the speed, location, and
During these simulations, TAROT was able to match the
area are randomly generated for each node. The minimum
delivery ratio of Epidemic. The cold start experiment ended
rectangle size is 0.0891km2 and the maximum rectangle size
is 0.9879km2 , which approximates to 1% and 10% of the to- before the rest of the packets could reach the destination,
which accounts for the lower delivery ratio. During cold
tal boundary area respectively. Unstructured nodes use the
start, TAROT was able to provide a 41% decrease in over-
Random Waypoint mobility model. Both structured and un-
head while incurring a 26% decrease in delay. The decrease
structured nodes travel at speeds ranging from 5−20km/hr.
in delay could have been caused by excessive packet colli-
We use the IEEE 802.11 default radio stack in Qualnet,
sions during Epidemic which TAROT is able to avoid by
with the receive power decreased to −85dBm and the trans-
mit power reduced to 1mW resulting in a 100 meter range. using selective-replication, though this has not been thor-
oughly tested. An alternate explanation could be that due
These values were set using measured node encounter dis-
to the limited time for passing nodes to transfer data, the
tances taken from moving vehicles equipped with 802.11 ra-
Epidemic protocol would be unable to transfer it’s entire
dios. Decreasing the transmit power and receive sensitivity
queue, whereas TAROT ’s limited queue sizes allow for faster
also serves to decrease the connectivity of the network, so
that nodes only communicate when they directly pass each transfers during encounters. This effect seems to appear in
other. Section 5.5. For the cold start extended scenario, there was
a 33% decrease in overhead with a 10% increase in delay.
Each simulation in the experiment is repeated five times
The warm start extended scenario also showed good results
for averaging purposes. The node mobility files and source-
with a 62% decrease in overhead and 34% increase in delay.
destination pairs are randomly generated for each simula-
tion. The simulations use Constant Bit-Rate (CBR) flows
for their traffic. The number of flows and packets-per-flow
5.3 Multiple Flow Experiments
varies with each experiment, and will be discussed in more These experiments use multiple source-destination pairs
detail within each experiment below. Data packets are 512- as well as vary the number of concurrent flows. The first
bytes and sent in regular intervals of 20 seconds (within each experiment, short-lived flows, attempts to recreate a typical
flow). The notion of a cold start refers to flows which have email exchange application where the traffic flows are spo-
started sourcing data before nodes are able to build their radic in nature. The second experiment uses larger flows
path libraries. A warm start refers to flows which start af- and varies the number of simultaneous flows present in the
ter the path libraries have been built and nodes are able to network. For each of these experiments, the nodes use fully-
use the structure extracted. Finally, as we described previ- structured mobility and the flows receive a warm start (de-
ously, the location of the destination is assumed to be global scribed above).
knowledge.
5.3.1 Short-Lived Flows
5.2 Single Flow Experiments In this experiment, there are 10 flows each starting at a
The single flow experiments are designed to showcase how randomly chosen time within the range 1000-3000 seconds.
a single user might utilize a purely structured delay-tolerant Each flow then sources a random number of packets be-
network to send data (such as email) to a destination. This tween 11-50 spaced 20 seconds apart. After all packets have
scenario uses a single CBR flow of 100 packets spaced 20 been sourced, the simulations continue until 7000 seconds is
seconds apart. All 50 nodes in the network use structured reached.
mobility. The start and stop time of the flows is varied to get These results are consistent with what we have observed
an idea of how well TAROT utilizes the extracted structure in previous results. The overhead reduction is slightly lower
from the mobility of the nodes. compared with the cases where traffic offers a heavier load,
Table 1 shows the results of three different scenarios: a which is to be expected.
cold start, cold start extended, and warm start extended.
Here, the term “extended” refers to running the simulation 5.3.2 Long-Lived Flows
for an extended amount of time after the flows have stopped In this experiment we steadily increase the number of
14Varied Structure, Packet Delivery Ratio
Table 2: Short-Lived Flow Results 100
Delivery Ratio Delay (sec) Overhead
90
(msgs)
Average Packet Delivery Ratio
80
Epidemic 100% 1203 19832
70
TAROT 100% 1488 12607
60
Difference 0% +23% -36%
50
40
30
Table 3: Long-Lived Flow Results (Comparison) 20
Flows/Pkts Δ Delivery Δ Delay Δ Overhead 10 Epidemic
TAROT
Ratio (sec) (msgs) 0
40 60 80 100
5/100 -0.43% +24.22% -45.08% % Structure
10/50 0% +16.95% -41.45%
20/25 -1.05% +17.68% -44.57% Figure 7: TAROT is able to maintain an almost
25/20 -1.30% +16.32% -39.73% identical delivery ratio compared with Epidemic as
50/10 0% +20.85% -40.46% the amount of structure present in network varies.
Varied Structure, Delay
simultaneous flows from 5-50. Effectively, this increases 2500
the number of nodes actively engaged as source-destination
pairs. Each flow indicates a unique source and destination.
2000
We keep the total number of packets sourced in the simula-
tion constant as the number of flows varies. This is so that
the results are not affected by an increase in the total num- Average Delay 1500
ber of packets. Table 3 displays the difference in overhead,
delay, and delivery ratio between Epidemic and TAROT. 1000
As the number of concurrent flows increases, more packets
are being injected into the network within a shorter span of 500
time. This has the effect of scaling the effective “load” on the Epidemic
network (without saturating it). The average delay incurred TAROT
0
is around 20% higher compared to Epidemic and the average 40 60 80 100
overhead reduction was around 40%. The delivery ratios for % Structure
both protocols were averaging near 100%. The average delay
and overhead metrics were relatively consistent across each Figure 8: The average delay for successfully received
of the simulations. data packets at the destination.
5.4 Varied Structure Experiment
TAROT was developed to take advantage of networks ex-
hibiting structure in mobility. We want to ensure, how- overhead. The general trend is a decreasing delay for both
ever, that TAROT performs well in both structured and Epidemic and TAROT. Again, this is due to the increased
unstructured mobility scenarios. This experiment was de- contact opportunities given by increased structure exhibited
signed to control the amount of structure present in the by the network. TAROT is able to deliver messages end-to-
network. Therefore, the nodes in the network are a mix end with an average delay spanning the range between 5%
of unstructured and structured nodes (as described in Sec- and 24% and an average overhead savings between 45% and
tion 5.1). All flows in these experiments use a warm start. 52%. The effectiveness of TAROT in reducing the overhead
The traffic is as follows: there are 5 simultaneous flows becomes more apparent as the structure in the network is
with 100 packets per flow. The flows start at 1000 seconds increased. This is because nodes using unstructured mobil-
and end at 3000 seconds. We run the simulation until 7000 ity are unable to create an established path to aid routing
seconds to allow packets to propagate through the network. decisions, and must default to Epidemic flooding.
As can be seen from Figure 7, TAROT is able to maintain
a delivery ratio comparable to Epidemic down to just 40% 5.5 SCORPION Bus Traces
structure exhibited by the network. Below 40%, the num- Using the SCORPION [3] testbed at UCSC, traces have
ber of contact opportunities becomes increasingly rare due been collected detailing the interactions between busses on
to the random mobility of the unstructured nodes, and the campus over the span of a day, in which 10 campus shut-
delivery ratio was too low to warrant any analysis for both tles were outfitted with GPS tracking devices. These traces
Epidemic and TAROT. This can also be attributed to the were then imported into Qualnet driving simulations run-
fact that unstructured nodes do not cover the same area as ning TAROT and Epidemic Routing. The simulations used
structured nodes, and therefore limit the number of contact 5 flows with 100 packets per flow. Messages were sent to des-
opportunities available during the simulation. tinations positioned at five campus bus stops, the locations
Figures 8 and 9 show graphs for the average delay and of which were randomly chosen around campus.
15Varied Structure, Messages Sent can be programmed to optimize the network for certain met-
40000 rics such as bandwidth and delay.
35000
Similar to geographic routing approaches such as LAR [15]
and GPSR [14], TAROT assumes that nodes have access to
Average Messages Sent
30000 destination location information as well as their own location
25000 (e.g., GPS devices, or by means of some other localization
technique, for example [22]).
20000
In many real world applications, location history often
15000 serves as a good indication of a node’s future position. For
10000 example, TAROT specifically looks for ”paths” or ”corri-
dors” that are routinely followed by nodes. More gener-
5000
Epidemic ally, nodes can be categorized into routinely visited “spaces”
TAROT
0 such as those described in [17]. In the previously discussed
40 60 80 100
% Structure
GeOpps protocol [18], paths extracted from the navigation
systems of automobiles were used to selectively route mes-
sages using a greedy forwarding protocol. This is similar
Figure 9: Average Overhead for Varied Structure
to our approach except that GeOpps assumes the knowl-
Experiment
edge of user-entered navigation information and therefore
has near-perfect knowledge of future node mobility. We ex-
tend this work by extracting patterns in real-time, allowing
for a broader set of applications.
We ran the simulations until 100% delivery ratio. Over-
all, there was an 11.67% improvement in overhead compared
with Epidemic, while the TAROT delay in fact decreased by 7. CONCLUSION
6.02%. We attribute the decrease in delay to the fact that This paper introduced the TAROT (Trajectory-Assisted
there were very few opportunities to replicate. Few opportu- ROuTing) DTN routing framework, which bases its routing
nities coupled with fast-moving busses results in very little and forwarding decisions on movement patterns extracted
time to pass information. Therefore, TAROT was able to from node mobility in real-time. Using past and current
deliver more data because it was not burdened by transfer- mobility patterns, TAROT is able to predict future mobility
ring all of its messages such as in Epidemic. The overhead with increased accuracy resulting in more efficient routing
did improve slightly, however this was hindered by the fact and forwarding of messages. TAROT ’s main contribution
that there is only one road on campus for the shuttles to is that it goes beyond current solutions that rely on abbre-
move. Therefore every shuttle is able to reach every desti- viated (in some cases, instantaneous) snapshots of mobility
nation, and the greedy algorithm can only do slightly better history. In its current implementation, TAROT uses a “con-
than Epidemic. trolled epidemic” approach to route messages where nodes
will only be “infected“ with a message if their mobility pat-
tern takes them “closer” to the message destination
6. RELATED WORK We evaluated TAROT ’s performance using the QualNet
DTN routing has been the subject of extensive research in network simulator. A side-by-side comparison against Epi-
the past few years. In particular, there have been a number demic Routing [26] under a variety of mobility and workload
of efforts proposing different strategies for controlling the scenarios show that TAROT is able to match Epidemic’s
“spread” of epidemic routing in order to reduce the amount high data delivery guarantees at substantially reduced over-
of message replicas circulating in the network. One such head (over 60% in some of our experiments). TAROT ’s
strategy uses historical node contact information (e.g., “age efficiency comes at the price of a slight increase in deliv-
of last encounter”, encounter frequency) to determine the ery delay (averaging around 20% in our experiments). We
utility of a node as a relay to a destination. Some notable argue that applications that use intermittently-connected
examples include [6, 2, 19, 1, 21, 16]. networked environments are inherently delay-tolerant, and
“Spray-and-Wait“ [23] also proposes a variation of epi- therefore favor slight increases in delay for increased effi-
demic routing where, “in the first hop”, the message orig- ciency and reduced resource consumption.
inator “sprays” a certain number of copies of a given mes- As future work, there are a number of extensions planned
sage to encountered nodes depending on their “age of last for TAROT ’s base algorithm. We plan to extend TAROT ’s
encounter” with the message’s destination. The number of Path Detection to increase the accuracy and freshness of the
replicas “sprayed” is calculated based on the number of nodes extracted paths using techniques such as path aging. We
in the network. The “infected” nodes must then deliver the also plan to address destination location dissemination and
message directly to the destination. “Spray and Focus” [24] enable routing for mobile destinations.
has been proposed as an extension which allows “infected”
nodes in the first hop to forward their replicas to other nodes 8. ACKNOWLEDGMENTS
who have seen the destination relatively recently.
This work has been partially supported by the Army Re-
The MV routing algorithm [4] keeps track of historical
information such as node encounters and visited locations. search Office (ARO) under a MURI project named DAWN,
This information is used to decide which messages to repli- NSF grants ANI 0322441 and CNS 0534129.
cate during encounters with other nodes. Later, the MORA [5]
protocol was designed to use autonomous agents whose mo-
bility is utilized to create contact opportunities. The agents
169. REFERENCES [14] B. Karp and H. T. Kung. Gpsr: greedy perimeter
[1] A. Balasubramanian, B. N. Levine, and stateless routing for wireless networks. In ACM
A. Venkataramani. Dtn routing as a resource Mobicom, 2000.
allocation problem. In ACM SIGCOMM, 2007. [15] Y.-B. Ko and N. H. Vaidya. Location-aided routing
[2] J. Boice, J. J. Garcia-Luna-Aceves, and K. Obraczka. (lar) in mobile ad hoc networks. ACM Wireless
Disruption-tolerant routing with scoped propagation Networks, 6(4), 2000.
of control information. In IEEE ICC, 2007. [16] J. Lebrun, C.-N. Chuah, D. Ghosal, and M. Zhang.
[3] S. Bromage, J. Koshimoto, C. Engstrom, M. Bromage, Knowledge-based opportunistic forwarding in
V. Petkov, B. Nunes, H. Taylor, K. Obraczka, vehicular wireless ad hoc networks. In Vehicular
S. Dabideen, M. Hu, R. Menchaca-Mendez, Technology Conference, 2005.
D. Nguyen, D. Sampath, J. Garcia-Luna-Aceves, [17] J. Leguay, T. Friedman, and V. Conan. Dtn routing in
H. Sadjadpour, and B. Smith. Scorpion: A a mobility pattern space. In ACM SIGCOMM
heterogenous wireless networking testbed. In ACM Workshop on Delay-tolerant networking, 2005.
SIGMOBILE Mobile Computing and Communications [18] I. Leontiadis and C. Mascolo. Geopps: Geographical
Review, 2009. opportunistic routing for vehicular networks. In
[4] B. Burns, O. Brock, and B. N. Levine. Mv routing and WoWMoM AoC, 2007.
capacity building in disruption tolerant networks. In [19] A. Lindgren, A. Doria, and O. Schelen. Probabilistic
IEEE Infocom, 2005. routing in intermittently connected networks. In ACM
[5] B. Burns, O. Brock, and B. N. Levine. Mora routing SIGMOBILE, 2003.
and capacity building in disruption-tolerant networks. [20] C. E. Perkins, E. M. Royer, and S. R. Das. Ad hoc
In Elsevier Ad Hoc Networks Journal, 2008. on-demand distance vector routing. IETF Internet
[6] A. Chaintreau, P. Hui, J. Crowcroft, C. Diot, and Draft http://www.ietf.org/internet-drafts/draft-ietf-
R. Gass. Impact of human mobility on the design of manetaodv-03.txt.,
opportunistic forwarding algorithms. In IEEE 1999.
Infocom, 2006. [21] N. Sarafijanovic-Djukic and M. Grossglauser. Last
[7] DeerNet. encounter routing under random waypoint mobility. In
www.wu.ece.ufl.edu/projects/DeerNet/DeerNet.html. Networking, 2004.
[8] DTNRG. http://www.dtnrg.org. [22] Y. Shang, H. Shi, and A. Ahmed. Performance study
[9] S. Guo, M. H. Falaki, E. A. Oliver, S. U. Rahman, of localization methods in ad-hoc sensor networks. In
A. Seth, M. A. Zaharia, and S. Keshav. Very low-cost IEEE Mass, 2004.
internet access using kiosknet. In ACM Sigcomm, [23] T. Spyropoulos, K. Psounis, and C. S. Raghavendra.
2007. Spray and wait: an efficient routing scheme for
[10] A. J. Hooke. Towards an interplanetary internet: A intermittently connected mobile networks. In ACM
proposed strategy for standardization. In SpaceOps, WDTN, 2005.
2002. [24] T. Spyropoulos, K. Psounis, and C. S. Raghavendra.
[11] S. Jain, K. Fall, and R. Patra. Routing in a delay Spray and focus: Efficient mobility-assisted routing for
tolerant network. In ACM SIGCOMM, 2004. heterogeneous and correlated mobility. In IEEE
[12] D. B. Johnson, D. A. Maltz, Y. C. Hu, and J. G. PERCOM, 2007.
Jetcheva. Dynamic source routing in ad hoc wireless [25] UnitedVillages. http://www.unitedvillages.com.
networks. Mobile Computing, 1996. [26] A. Vahdat and D. Becker. Epidemic routing for
[13] P. Juang, H. Oki, Y. Wang, M. Martonosi, L.-S. Peh, partially-connected ad hoc networks. Technical report,
and D. Rubenstein. Energy-efficient computing for Duke University, 2000.
wildlife tracking: Design tradeoffs and early
experiences with zebranet. In ACM ASPLOS-X, 2002.
17You can also read