SOLAR UV B/A RADIATION IS HIGHLY EFFECTIVE IN INACTIVATING SARS COV 2
←
→
Page content transcription
If your browser does not render page correctly, please read the page content below
www.nature.com/scientificreports
OPEN Solar UV‑B/A radiation is highly
effective in inactivating
SARS‑CoV‑2
Fabrizio Nicastro1*, Giorgia Sironi2, Elio Antonello2, Andrea Bianco2, Mara Biasin3,
John R. Brucato4, Ilaria Ermolli1, Giovanni Pareschi2, Marta Salvati5, Paolo Tozzi4,
Daria Trabattoni3 & Mario Clerici6
Solar UV-C photons do not reach Earth’s surface, but are known to be endowed with germicidal
properties that are also effective on viruses. The effect of softer UV-B and UV-A photons, which
copiously reach the Earth’s surface, on viruses are instead little studied, particularly on single-stranded
RNA viruses. Here we combine our measurements of the action spectrum of Covid-19 in response to
UV light, Solar irradiation measurements on Earth during the SARS-CoV-2 pandemics, worldwide
recorded Covid-19 mortality data and our “Solar-Pump” diffusive model of epidemics to show that
(a) UV-B/A photons have a powerful virucidal effect on the single-stranded RNA virus Covid-19 and
that (b) the Solar radiation that reaches temperate regions of the Earth at noon during summers, is
sufficient to inactivate 63% of virions in open-space concentrations (1.5 × 10³ TCID50/mL, higher than
typical aerosol) in less than 2 min. We conclude that the characteristic seasonality imprint displayed
world-wide by the SARS-Cov-2 mortality time-series throughout the diffusion of the outbreak (with
temperate regions showing clear seasonal trends and equatorial regions suffering, on average, a
systematically lower mortality), might have been efficiently set by the different intensity of UV-B/A
Solar radiation hitting different Earth’s locations at different times of the year. Our results suggest
that Solar UV-B/A play an important role in planning strategies of confinement of the epidemics,
which should be worked out and set up during spring/summer months and fully implemented during
low-solar-irradiation periods.
It is well known that 200–290 nm ultraviolet photons (hereinafter UV-C radiation) are absorbed by both the
nucleic acid (RNA and DNA) and proteins and are endowed with germicidal properties that are also effective
on viruses because they induce irreversible modifications that inhibit the virus r eplication1–9 (see “Methods”).
Fortunately, Solar UV-C photons of this wavelength are filtered out by the Ozone layer of the upper Atmosphere,
at around 35 km10. Softer UV photons from the Sun, however, do reach the Earth’s surface. In particular, about
10% of the photons emitted by the Sun in the range 290–315 nm (UV-B) and as much as 95% of those in the
range 315–400 nm (UV-A), reach the Earth. The effect of these photons on Single- and Double-Stranded RNA/
DNA viruses10–13 and the possible role they play on the seasonality of e pidemics14–25, are nevertheless little studied
and highly debated in alternative or complementarity to other environmental causes23,26–39. Notably though, the
effects of both direct and indirect radiation from the Sun needs to be considered in order to completely explain
the effects of UV radiations in life processes (with e.g. the UV virucidal effect enhanced in combination with
the concomitant process of water droplets depletion because of solar heat and/or reduced in combination with
high-humidity because of the larger optical depth).
Herein, and in a companion paper that presents our laboratory m easurements40, we show that the action spec-
trum of Covid-19 in response to photons with λ = 366–405 nm (UV-A) is surprisingly efficient. As a consequence,
UV-B/A integrated direct light from the Sun on the Earth have a strong disinfection power on the Severe Acute
Respiratory Syndrome CoV-2 (SARS-CoV-2), inactivating 63% of the virus in 1.5 × 10³ TCID50/mL concentra-
tions (higher than typical aerosol concentrations) in about 1–2 min at noon during north/south summers or at
1
Italian National Institute for Astrophysics (INAF)-Rome Astronomical Observatory, Rome, Italy. 2Italian National
Institute for Astrophysics (INAF)-Brera Astronomical Observatory, Merate, Milan, Italy. 3Department of Biomedical
and Clinical Sciences L. Sacco, University of Milano, Milan, Italy. 4Italian National Institute for Astrophysics
(INAF)-Arcetri Astrophysical Observatory, Florence, Italy. 5Regional Agency for Environmental Protection of
Lombardia (ARPA Lombardia), Milan, Italy. 6Department of Pathophysiology and Transplantation, University of
Milano, Don C. Gnocchi Foundation, IRCCS, Milan, Italy. *email: fabrizio.nicastro@inaf.it
Scientific Reports | (2021) 11:14805 | https://doi.org/10.1038/s41598-021-94417-9 1
Vol.:(0123456789)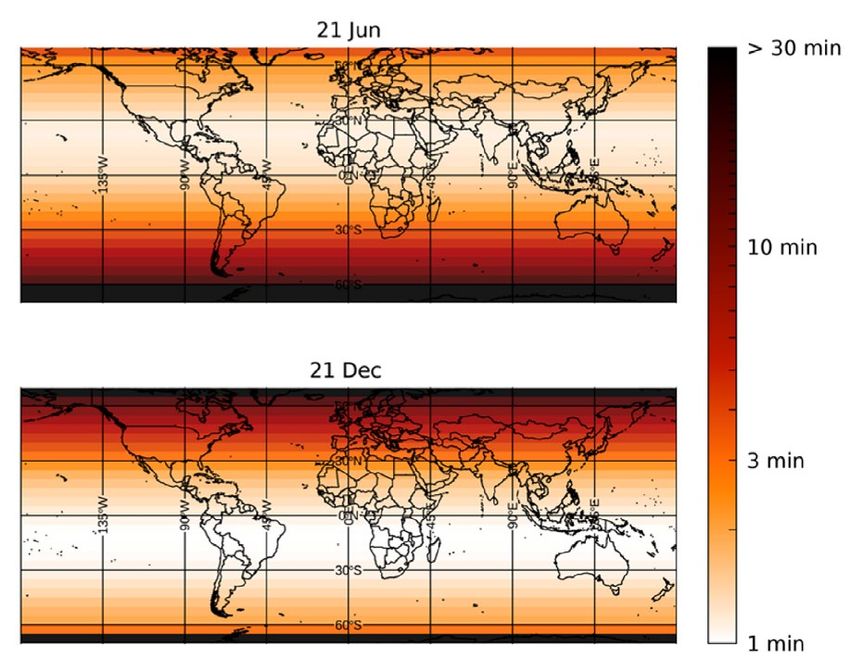
www.nature.com/scientificreports/
Figure 1. 254 nm-normalized action spectrum of Covid-19 to D63 UV doses (pink curve and circles), solar
spectra at zenith angles of 0 (green curve), 60 (blue curve) and 80 (orange curve) degrees, and integrals of their
product, i.e. Solar UV Inactivation Powers (SUVIPs, green, blue and orange shaded area). Clearly most of the
SUVIP is in the UV-A regime (315–400 nm), and is a strong function of the zenith angle (or Earth latitude).
the Equator. We also present a number of concurring circumstantial evidence suggesting that the evolution and
strength of the recent SARS-Cov-2 pandemics41,42, has been (and is being) modulated by the intensity of UV-B
and UV-A Solar radiation hitting different regions of Earth during the diffusion of the outbreak between January
2020 and April 2021. Finally, we show that, once the laboratory-calibrated effect of the “Solar-Pump” is included,
our SIRD-like models of the e pidemics20 are able to qualitatively reproduce the observed time-resolved mortality
of the SARS-CoV-2 epidemics in different regions of the Globe. Our findings could help in designing the social
behaviors to be adopted depending on season and environmental conditions.
Results
Coronavirus infections were shown to be influenced by seasonal factors including UV-index, temperature and
humidity (e.g.43,44). However, whether these factors, either independently or combined together, are able to
directly modulate the geographical pandemics development of the ongoing SARS-CoV-2 infection is still debated
(e.g.45, 46, but see a lso22,33–39). Yet, the available data on SARS-CoV-2 contagions show indisputably that the
ongoing pandemic has a lower impact during summer time and in countries with a high solar illumination
(e.g.15,19,20,22,24,47–49). This suggests that UV-B/A Solar photons may play a role in the evolution of this pandemic,
perhaps in combination with more subtle, and related, indirect factors such as temperature and humidity.
The optical-ultraviolet solar spectrum peaks at a wavelength of about 500 nm, but extends down to much
more energetic photons of about 200 nm. Due to photo-absorption by the upper Ozone layer of the Earth’s
atmosphere, however, only photons with wavelengths longer than ~ 290 nm (those not sufficiently energetic to
efficiently photo-excite an O 2 + O), reach the Earth’s s urface50. For a given
3 molecule and dissociate it into an O
exposure, the daily fluence (flux integrated over a daytime) on Earth of this UV radiation depends critically on
Earth location (latitude) and time of the year and results in the potential of Solar UV-B/A photons to inactivate
a virus in air (aerosol) or surfaces.
To evaluate this potential on the onset, diffusion and strength of the recent SARS-CoV-2 pandemics, in our
analysis we use the Covid-19 action spectrum (i.e. the ratio of the virucidal dose of UV radiation at a given wave-
length to the lethal dose at 254 nm see “Methods”) recently compiled by us in the laboratories of the University
of Milan (40; see “Methods”), together with UV-B and –A solar radiation measurement estimates on the Earth
as a function of Earth’s latitude and day of the year (51; see “Methods”).
Results are surprisingly encouraging. Figure 1 (and Table 1) shows the 254-nm-normalized action spec-
trum of Covid-19 to D 63 UV doses (the amount of UV photons needed to inactivate 63% of the virions), in
the 260–405 nm band (UV-C through UV-A light), together with state-of-the-art models of the Solar spectra
on the Earth in the same wavelength r ange52 at three representative zenith angles and the integrated Solar UV
Inactivation Power (SUVIP), i.e. the actual Solar radiation power available to inactivate the virus (see Figure’s
caption and “Methods” for details).
The action spectrum of Covid-19 in response to photons with λ = 366–405 nm (in the UV-A) is at least 2
orders of magnitude more efficient than that of direct DNA-damage (see e.g. https://www.temis.nl/uvradiation/
product/action.html) or that obtained by extrapolating to longer wavelengths the action spectrum o f12 (derived
for a compilation of a wide variety of viruses). As a consequence, “instantaneous” Solar lethal-times τ63, i.e. the
time needed for the Sun to deliver a lethal dose D63 at a given time of the day and location on the Earth, are
relatively short. These, can be easily derived by simply dividing the normalizing measured Covid-19 UV-C lethal
doses D63(254) = 3.5 W m-2 (Table 1) by actual SUVIPs, as recorded at a given location on the Earth and a given
time of the year (see “Methods” for details).
Scientific Reports | (2021) 11:14805 | https://doi.org/10.1038/s41598-021-94417-9 2
Vol:.(1234567890)www.nature.com/scientificreports/
Central λ (in nm) D63 (in j m−2) D90 (in j m−2) 63% action-spectrum
254 (UV-C) 3.5 5.0 1
278 (UV-C) 3.5 5.0 1
308 (UV-B) 524 746 6.6 × 10⁻³
366 (UV-A) 16,488 23,477 2.1 × 10⁻⁴
405 (near UV-A) 22,434 31,942 1.6 × 10⁻⁴
Table 1. UV doses needed to inactivate 63% and 90% of Covid-19 virus in 1.5 × 10³ TCID50/mL solutions and
derived 63% action spectrum of Covid-19.
Figure 2. (a) Covid-19, monthly-averaged, lethal-times at noon in latitude bins of 5 degrees, from -70 to + 70
degrees, for year 2020 and the first four months of 2021 (left panel). (b) Two world maps with a superimposed
τ63 intensity-gradient image, at summer (top panel) and winter (bottom panel) solstices (right panel).
Curves of Fig. 2a shows Covid-19 monthly-averaged lethal-times at noon in latitude bins of 5 degrees, from
− 70 to + 70, for year 2020 and the first 4 months of 2021 (see “Methods” for details). The weak asymmetry
between the South and North hemispheres is mostly due to the smaller distance of the Earth from the Sun dur-
ing south summers compared to north summers (7% more Solar flux at perihelion than aphelion). Less than
2 min are needed at noon, all year round, to inactivate 63% of Covid-19 in aerosol or on surfaces in equatorial
regions (|α|< 20 degrees). This is also the case for temperate-region locations (20www.nature.com/scientificreports/
Figure 3. Absolute maximum number of daily SARS-CoV-2 deaths per million inhabitants for the 214
Countries (or territories) of our sample, versus the Solar UV Inactivation index Ξ on the Earth 3 weeks prior
to the mortality peak. The Solar UV Inactivation Index Ξ is defined as the ratio of the SUVIP administered in
2 min to the Covid-19 lethal dose D63. (see “Methods”). Pink, green and yellow circles are Countries of the
north hemisphere (α > 20 degrees: 103 Countries; N group), the equatorial strip (|α| ≤ 20 degrees: 93 Countries;
T group), and the south hemisphere (α < −20 degrees: 18 Countries; S group), respectively. Grouping the data
in either 5-degree-wide latitude bins (left onset) or 0.1-wide Ξ bins (right onset) greatly reduces the scatter
present in the main plot, but also the degrees of freedom of the relations, thus yielding to higher (but still low)
probabilities of chance correlation.
Figure 4. Observed mean mortality time series (see “Methods” for details) of the three large groups of
Countries at latitudes α > 20 degrees (N group: green solid curve), −20 ≤ α ≤ 20 degrees (T group: orange solid
curve), and α < −20 degrees (S group: blue solid curve). Dotted curves are Covid-19 Lethal-Time solar light-
curves at the three average latitudes α = 41.4 degrees (N; green), α = 5.8 degrees (T; orange) and α = − 31.1
degrees (S; blue). The long-dashed blue curve of this figure shows the mean mortality curve of all countries of
the S group after excluding South Africa and Eswatini.
Scientific Reports | (2021) 11:14805 | https://doi.org/10.1038/s41598-021-94417-9 4
Vol:.(1234567890)www.nature.com/scientificreports/
in the T and S groups (solid curves). Correspondingly, Covid-19 lethal-times are up to 5 times longer (dotted
curves). This is virtually impossible to explain in terms of differences in the efficiency of lockdowns or social-
distancing measures, unless one speculates that the large number of countries populating the T and S groups have
concordantly and simultaneously adopted much more strict measures than those adopted by all countries in the
N group. An external common cause must be invoked, which broadly follow the pace of seasons on the Earth.
It is also important to note that the rapid and short-lasting (about 30 days) factor of 2 increase in mortality
in the S group toward the end of 2020 (beginning of south summer), followed by a sharp decline in February
2021, is largely dominated by South-Africa and Eswatini (a small landlocked country embedded within South
Africa), with peaks of 9 and 11 deaths per million inhabitants around mid January 2021. This is where and when
the SARS-CoV-2 B.1.351 variant, associated with higher viral load and greater transmissibility potentials (https://
www.paho.org/en/documents/epidemiological-update-occurrence-variants-sars-cov-2-americas-20-januar y-
2021), has first developed. The long-dashed blue curve of Fig. 4 shows the mean mortality curve of all countries
of the S group after excluding South Africa and Eswatini.
Discussion
As expected by our model, in South and Tropical Countries the onset of the outbreak was homogeneously
distributed from the end of March through early May (when typical UV-B/A instantaneous virus-inactivation
exposures at noon are between 1.5 and 3 min: blue and orange dotted curves of Fig. 4, respectively), and the
average daily mortality rate (excluding South Africa and Eswatini: blue dashed curve of Fig. 4) remained limited
to a maximum of 1 per million per day throughout all 2020 and the first monitored part of 2021. The average
daily mortality curve in countries of the S group (blue dashed curve in Fig. 4) smoothly modulates between the
end of south-autumn throughout the beginning of south-summer (with a maximum towards the end of south
winter 2020), and then starts climbing more decisively toward the end of south-summer 2021, when also lethal
times increase. The average daily mortality curve of equatorial countries, instead (solid orange curve of Fig. 4),
stays roughly constant at a low level of ~ 0.5–1 deaths per million throughout all the monitored period.
On the contrary the onset of the epidemics in countries of the N group anticipates that of countries in the T
and S groups by at least one month, and the average daily mortality rate curve of these countries follows a typical
seasonal trend (solid green curve in Fig. 4). It rises quickly during March 2020 but is efficiently suppressed by
the strict lockdown measures implemented by virtually all countries in the N group during the first wave of the
epidemics. Such suppression generates a peak around mid-April 2020 at a relatively moderate level of 2 deaths per
million (more than twice larger than the corresponding rates in the T and S groups), followed by a sharp decline
between April and May 2020. This decline takes the average daily mortality rate in countries of the N group down
to a minimum level of about 0.5 deaths per million by the end of May, beginning of June 2020, and is followed
by a long steady phase that lasts throughout all summer 2020, despite most of the social-distancing measures in
the majority of countries of the N group had been greatly relieved already by the beginning of June. During this
long, steady low-mortality phase, average solar lethal-times at noon in countries of the N group are ~ 2.5 min and
day-light coverage ~ 10–12 h (see also onsets of Fig. S1 of Supplementary Information: SI). Finally, in October
2020 the daily mortality rate starts increasing again and by February 2021 reaches maximum levels 7–8 times
those recorded in summer (despite in the majority of the Countries of this group social-distancing measures—
generally milder than those adopted during the first wave in winter 2020—had been already enforced since late
fall 2020), while correspondingly the average solar lethal-time at noon in this group of Countries increases by
up to a factor of 3.5 and day-light coverage shrinks by a factor of about 2 (see onsets in Fig. S1 of SI).
The segregation by Earth’s latitude of the curves of growth of Fig. 4 can be well reproduced (both qualitatively
and quantitatively) by simulating the effect of solar virus inactivation with Monte-Carlo runs of our “Solar-Pump”
diffusive model20 (see “Methods” for details).
Figure S1 of SI shows typical yearly (main panel) and infra-day (onsets) Rt modulations of an intrinsic
reproduction number R0 = 3, imprinted by the solar mechanism (see details in Figure’s caption and “Methods”).
In Figure S2 of SI we show the results of our Monte Carlo simulations, with (solid curves) and without (dashed
curves) the effect of the Solar-Pump (see “Methods” for details). The X and Y scales in Fig. S2 of SI and Fig. 4
are exactly the same, for an easy comparison between actual data and simulations.
Clearly, only when an external mechanism acting with the pace and latitude-dependent intensity of seasons
on Earth, is at work (solid curves) the observed average mortality time-series in the three groups of countries can
be, at least qualitatively, reproduced (compare solid curves of Fig. S2 in SI with solid curves of Fig. 4). When the
Solar-Pump mechanism is not active (dashed curves), the average daily mortality time-series in the N, T and S
groups reaches peaks of 57, 93 and 66 deaths per million, respectively, far higher than observed, and only the N
group, in these simulations, show a second, much lower (only ~ 1.5 daily death per million) peak in November
2020. Such high maxima could be suppressed to the observed levels by ad-hoc efficiencies of the, country-by-
country, adopted social-distancing measures, but it would require extreme fine-tuning of the starting/stopping
and halving/doubling times of measures’ implementation, loosening and duration in the three groups.
Taken together, the curves of growth of Fig. 4, and their comparison with those of Fig. S2 in SI, suggest that
the SARS-CoV-2 mortality is efficiently suppressed in areas where typical UV-B/A virus-inactivation exposures
at noon are shorter than about 2–3 min (i.e. Solar UV Inactivation index Ξ higher than 0.7–1).
This value should be compared to the stability of SARS-CoV-2 on aerosol and surfaces. A recent s tudy53 shows
that SARS-CoV-2 can survive in aerosols for longer than three hours and is even more stable on metallic and
polymeric surfaces, where it can stay for up to several tens of hours and is quickly inactivated by solar light54.
These results, combined with another recent research showing that the lifetime of speech droplets with relatively
large size (> few micrometers) can be tens of m inutes55, suggest that SARS-CoV-2 may efficiently spread through
aerosols (either directly, through inhalation, and/or indirectly, through evaporation of contaminated surfaces).
Scientific Reports | (2021) 11:14805 | https://doi.org/10.1038/s41598-021-94417-9 5
Vol.:(0123456789)www.nature.com/scientificreports/
Seasonal air temperature oscillations on temperate regions of the Earth, as well as large day/night thermal
excursion in dry and low-latitude regions, are due to the different amount of Solar radiation hitting different
locations on the Earth’s surface at different times of the year. The two quantities are therefore obviously broadly
correlated. However, at Earth’s temperature heat itself cannot be the direct cause of virus inactivation in summers
or at the equator in open-spaces, since Covid-19 is known to survive to non-Earth-like temperatures of ~ 60–70
C, for up to 10 min and to continuous exposure to extreme, but more common, summer-like temperatures of
37 C for longer than 6 h (56).
However, heat (i.e. high air temperatures), in low-humidity environments, can certainly boost the direct
disinfecting power of Solar UV-B/A radiation, by speeding up the evaporation of water droplets containing
virions (e.g.31).
Humidity, instead, is likely to play against Solar UV-B/A inactivation power, by both hampering efficient
water droplet evaporation and by increasing the optical depth to disinfecting radiation. This has indeed been
observed (e.g.44,45), particularly in equatorial regions where a year-round risk of coronavirus infection is present
(44; Fig. 4), albeit with consistently lower mortality, due probably to the combined effect of the high and almost
constant amount of UV-B/A radiation administered by the Sun over time, and the increased optical depth due
to high humidity.
The high efficiency of Solar UV inactivation power against Covid-19, had already been suggested by previous
works, based on either general models on coronaviruses (e.g.13), observed anti-correlation between sunlight doses
and SARS-CoV-2 positive cases (e.g.19) and/or actual experiments with simulated sunlight (e.g.54). Particularly,
the comparison between predictions (13) and actual measurements of Covid-19 exposure to artificial Solar radia-
tion (54), suggested the importance of UV-A photons (16,17). Ratnesar-Schumate and collaborators (54) found that
6.8 min of continuous exposure of dried saliva-like concentrations of Covid-19 to simulated sunlight in summer
at a latitude of 40 degrees were sufficient to inactivate 90% of virions. Our experiments use almost monochro-
matic UV light on even higher, but non-dried, concentrations (1.5 × 10³ TCID50/mL) of Covid-19 and find 90%
lethal times in summer at similar latitudes a factor of about 2 shorter (Fig. 4, 63% to 90%—Table 1—scaled
up green dotted curve). This difference could be at least partly due to the difficulty in properly subtracting the
effect of the additional optical depth introduced by the process of desiccation of the samples prior to sunlight
exposure (e.g.57), which might have artificially increased the exposure needed to inactivate the virions in the
experiment by54.
Our results shows that Solar UV-A/B are highly efficient in inactivating SASR-Cov-2 in aerosol and surfaces
and had a role in modulating the strength and diffusion of the SARS-CoV-2 epidemics, explaining the geographi-
cal and seasonal differences that characterize this disease. They also imply, if confirmed, that the UV flux received
from our Sun in open areas may represent an important disinfection factor (e.g.54), able to significantly reduce the
diffusion of the pandemics. Now that vaccines are available, but until their coverage will not assure world-wide
herd immunity, our results could help in diversifying strategies of confinement of the epidemics depending on the
time of the year and environmental factors, which may provide better protection with less social costs (see e.g.41).
Methods
UV lethal doses and action spectrum of Covid‑19. Details on the Covid-19 illumination experiments
performed by our group at the University of Milan and the related TCID50 inactivation measurements of Covid-
19 for UV radiation, are presented in a companion p aper40. In those experiments, an accurate estimate of the
Covid-19 action spectrum to UV light was derived by delivering three different light doses at five different
wavelengths (254, 278, 308, 366 and 405 nm) on extremely high virus concentrations of 6 × 10⁶ TCID-50/mL (in
DMEM), and evaluating virus replications (using the T CID50 technique). To evaluate the UV lethal doses needed
to inactivate 63% and 90% of Covid-19 (D63 and D90) on virus concentrations closer to typical aerosol concen-
trations, an additional set of measurements was then performed at 278 nm on a much lower virus solution of
1.5 × 10³ TCID50/mL, and the lethal doses at the remaining frequencies rescaled accordingly to the measured
action spectrum.
In Table 1 we report the measured D63 and D 90 doses of almost monochromatic (Δλ = 4 nm) UV radiation
needed to inactivate 63% and 90% of Covid-19 in solutions with 1.5 × 10³ TCID50/mL virus concentrations, and
the 63% Action Spectrum of Covid-19 derived by simply dividing the measured D 63(254 nm) = D63(278 nm)
dose by the corresponding doses of column 2.
The 63% Action Spectrum of Table 1 (column 4) is shown in Fig. 1 (pink points), together with the “spline”
polynomial interpolation of the five data points (pink curve), which conservatively under-predicts the Solar
power available to inactivate the virus (see below) in the relevant 308–365 nm wavelength range, with respect
to the simple linear interpolation.
Solar UV inactivation power and index. We define the Solar UV Inactivation Power (SUVIP) as the
instantaneous amount of Solar radiation available at noon at a given location and time of the year to inactivate
63% of Covid-19, i.e. the integral, over the λ = 254–400 nm wavelength range, of the product between the Solar
flux at noon and the 63% Covid-19 Action Spectrum of Fig. 1 (pink points and curve).
The Solar UV Inactivation index Ξ at a given location and time of the year, is defined as the ratio of the SUVIP
administered in 2 min to the Covid-19 lethal dose at 254 nm D 63(254). Thus, Ξ = 1 at a given location on the Earth
and time of the year, means that Solar radiation at noon, is sufficient to inactivate 63% of Covid-19 virions in
solutions with 1.5 × 10³ TCID50/mL concentrations in only 2 min. Ξ greater/lower than unity, imply disinfection
exposures shorter/longer, respectively.
Scientific Reports | (2021) 11:14805 | https://doi.org/10.1038/s41598-021-94417-9 6
Vol:.(1234567890)www.nature.com/scientificreports/
Solar radiation and microorganisms. The mechanisms through which UV radiation from the Sun acts
on viruses and, in general, microorganisms are both endogenous and exogenous and depend on the exact wave-
length of the photons. For viruses, the direct endogenous mechanism is the most important, and consists in
direct absorption of the UV photon by the chromophore embedded in the virus, as the nucleic acid or protein31.
This process is known to decrease in efficiency going from UV-C to UV-B and is generally poorly active in the
UV-A (though actual UV-A efficiencies on viruses have been poorly tested so far, and recent results on Covid-19
suggest that this may not always be the case), where the exogenous mechanism is e ffective47,50.
UV strongly interacts with gaseous and aerosol pollutants in the air affecting the amount of UV radiation
reaching the Earth surface. Nitrogen and Sulphur oxides together with Ozone strongly absorb UV light with
efficiency increasing from UV-A to UV-B50,58. In addition, scattering of light by particles and aerosols is propor-
tional to their concentration and highly polluted areas show again a UV reduction effect that goes in the same
direction of molecular absorption.
Solar UV inactivation index and lethal time as a function of Earth’s latitude and time of the
year. The Solar UV Inactivation Powers (SUVIPs) shown for three representative zenith angles (i.e. latitude
on the Earth and time of the year at noon) in Fig. 1, are obtained by multiplying models of the solar spectra at
these zenith angles by the measured Covid-19 action spectrum, and integrating over the λ = 254–400 nm wave-
length range. This could in principle be done analytically for any location on the Earth (latitude α) and time of
the year (t), to obtain state-of-the-art model-based SUVIPs:
400
Sun
SUVIP Model (α, t) = fModel ( , α, t)ACovid−19 ( )d (inWm−2 ). (1)
254
However, actual SUVIPs critically depend on the exact shape of the Solar spectra at a given location on the
Earth and time of the year, in the critical 254–400 nm region. This is severely affected by a number of time-
dependent factors, including the exact composition and thickness of the Ozone layer at a given location on the
Earth and date. Using actually recorded Solar data during the whole pandemic period, would certainly be more
accurate.
Ideally, one would like to dispose of daily ground-collected Solar spectra fObs Sun ( , α, t) at each site where
pandemic data are available and for the entire duration of pandemic. These are clearly not available. However,
above-atmosphere Solar and atmospheric data are collected daily by several operating satellites and the products
of the analyses of these data stored in publicly accessible archives. In our analysis, we use actual Solar UV data
continuously updated and made available by the Tropospheric Emission Monitoring Internet Service (TEMIS)
archive. TEMIS is part of the Data User Programme of the European Space Agency (ESA), a web-based service
that stores, since 2002, calibrated atmospheric data from Earth-observing satellites. TEMIS data products are
provided for 259 locations around the world and interpolated on a regular latitude grid of 5 degrees, and include
measurements of ozone and other constituents (e.g. NO2, CH4, CO2, etc.), cloud coverage (only for a small
number of locations), and estimates of the UV solar flux at the Earth’s surface at noon. The latter, are obtained
from daily-collected above-atmosphere solar spectra by exploiting state-of-the-art physical data-driven models
of the atmosphere dynamics and optical depth, but are provided only as wavelength-integrated fluxes (in W
m−2) already folded with the action spectrum of Erythema (which is also provided), i.e. as Solar UV-Erythema
Powers (SUVErPs):
400
Sun
SUVErP Temis (α, t) = fObs ( , α, t)AEritema ( )d (inWm−2 ). (2)
254
Sun ( , α, t) from Eq. (2), is impossible (with-
Unfortunately, blind de-integration of the bare Solar spectrum fObs
out an informed guess on its shape, it would obviously yield to infinite solutions). We therefore estimate actual
SUVIPs, for each location on the Earth and each day from 22 January 2020 through 2 May 2021, by multiplying
observed TEMIS SUVErPs by the ratio of the integrated Covid-19 and Erythema action spectra (both normal-
ized at 254 nm):
400
254 ACovid−19 ( )d
inWm−2 . (3)
SUVIP Obs (α, t) ≈ SUVErP Temis (α, t) ×
400
254 AEritema ( )d
This is formally not correct, but it compromises between the need for actual solar data and the lack of homo-
geneous ground-based world-wide Solar UV spectral coverage on each day of the pandemic covered by this study.
Observed SUVIPs are then used to obtain, as a function of Earth’s latitude and time of the year, both the
curves of exposure (in minutes) needed to irradiate the lethal dose (i.e. lethal-times) at noon, shown in Fig. 2:
D63 (254)
τ63,noon (α, t) = (in min), (4)
SUVIP Obs (α, t) × 60
and the Solar UV Inactivation Index Ξ 3 weeks (estimated mean duration between onset of symptoms to
death: e.g.59) prior to the recorded maximum SARS-CoV-2 mortality, used in Fig. 3:
SUVIP Obs (α, tmax − 21) 2 min
�(α, tmax ) = × 120 = . (5)
D63 (254) τ63,noon (α, tmax )
Scientific Reports | (2021) 11:14805 | https://doi.org/10.1038/s41598-021-94417-9 7
Vol.:(0123456789)www.nature.com/scientificreports/
In deriving the above quantities, we adopt the following conservative assumptions:
(i) we only use TEMIS SUVErPs collected at locations with altitude < 400 m, where UV solar fluxes are lower
because of the thicker atmosphere column.
(ii) we only use TEMIS clear-sky data (the only available on a broad global scale). Cloud coverage related to
local weather certainly contributes to the large scatter present along the anti-correlation shown in Fig. 3.
More importantly, ignoring the systematic, season-related, effect of cloud coverage in tropical areas dur-
ing rain (high-humidity) seasons, associates systematically higher-than-real Solar inactivation indexes
to a significant fractions of equatorial locations on the days when mortality maxima are recorded, thus
contributing to the narrow (along the X axis) and elongated (along the Y axis) distribution of the green
points in the mortality-Ξ diagram of Fig. 3.
(iii) aerosols are the main responsible for local SUVIP Obs absorption and scattering and may vary greatly
from location to location on Earth. TEMIS data account for this effect by reducing SUVErPs via a flat
mean attenuation factor of 0.3. Experiments made on ground showed actual doses up to a factor 2 higher
than those reported by TEMIS, implying that the adopted flat 0.3 factor is highly conservative (local
aerosol measurements would be incredibly interesting to study infection diffusion in polluted areas but
this would require specific data per targeted area and are beyond the scope of this analysis).
SARS‑CoV‑2 pandemics data. We collect SARS-CoV-2 pandemic data from the on-line GitHub reposi-
tory provided by the Coronavirus Resource Center of the John Hopkins University (CRC-JHU: https://github.
com/CSSEGISandData/COVID-19). CRC-JHU global data are updated daily and cover, currently, the course of
epidemics in 226 different world countries (and regions for Australia, China and Canada), by providing the daily
cumulated numbers of Confirmed SARS-CoV-2 cases, Deaths and Healings.
In our study, and to produce Figs. 3 and 4, we use CRC-JHU mortality (i.e. deaths per million inhabitants)
data for the 214 locations for which greater-than-zero mortality is recorded, from 22 January 2020 (recorded
start of the epidemics in the Hubei region of China) through 2 May 2021.
The Y-axis value of the points of Fig. 3 is the maximum mortality recorded in each sampled location.
The continuous curves of Fig. 4, are derived by first differentiating each of the 214 cumulative mortality time
series provided by CRC-JHU, then operating a non-weighted 21-day moving average on the data to smooth
non-Poissonian daily fluctuations (systematics), and finally averaging out all mortality time-series of each of
the three groups of locations (N, T and S).
Modeling the Earth’s latitude segregation of SARS‑CoV‑2 mortality with simulations. We use
our diffuse SIRD-like (Susceptible-Infected-Recovered-Deaths) “Solar-Pump” models (described in20) to run
Monte-Carlo simulations of SARS-CoV-2 mortality time-series.
Our model considers isolated (i.e. no cross-mixing), zero-growth (i.e. death rate equal to birth rate), groups
of individuals in whom an efficacious anti-viral immune response has either been elicited (Susceptible Infected
Recovered: SIR) or not (Susceptible Infected Recovered Susceptible: SIRS). The inefficiency of the natural (dis-
ease) and induced (vaccines) anti-viral immune response is parameterized through population loss-of-immunity
(LOI) rates γin and ξin (zero for no LOI). Other parameters of the model are the rate of contacts β (proportional
to the reproductive parameter Rt: with R t=0 = R0 being the intrinsic reproductive number of the epidemic), the
rate of recovery γout, the rate of deaths μ, lockdown/re-opening halving/doubling times (see below), and the
efficiency ε of the solar-pump (see below).
For a given set of initial and/or boundary conditions, unique solutions of the model are obtained by inte-
grating (through a simple Fortan-90 code written by us), the following set of first-order differential equations,
in which the Susceptible population (S) interacts not linearly with Infected (I) at a rate β, Recovers (R) or dies
(D) with rates γout and μ, respectively, get Vaccinated (V) at a rate ξout, and can become again susceptible (loses
immunity) with rates γin (natural) and ξin (vaccines):
dS SI
= −β − ξout S + γin R + ξin V
dt N
dI SI
= β − (γout + µ)I
dt N
dR
= γout I − γin R
dt
dD
= µI
dt
dV
= ξout S − ξin V
dt
For each run, we assume no loss-of-immunity (γin = ξin = 0), an intrinsic reproduction number R
0 = 3, a starting
time of the epidemic uniformly sampled from the interval 21 December 2019 ± 15 days. As generally observed,
two major episodes of enforcing (“lockdown”) and subsequent loosening (“reopening”) of social-distancing
Scientific Reports | (2021) 11:14805 | https://doi.org/10.1038/s41598-021-94417-9 8
Vol:.(1234567890)www.nature.com/scientificreports/
measures are introduced in each simulation by modulating the rate of contacts β between susceptible and infected
individuals, through negative (lockdowns) and positive (re-openings) exponential factors, each with starting
dates and e-folding times uniformly sampled from predefined intervals. In particular, lockdowns have starting
dates uniformly sampled from the 30-day wide intervals centered on 1 March 2020 and 6 November 2020, and
e-folding times uniformly sampled from the 20–26 day interval. Re-openings start randomly 48–72 days and
24–36 days after the start of the first and second lockdown, respectively, with e-folding times uniformly sampled
from the 123–151 day interval (virtually everywhere in the world social-distancing measures have never been
completely relaxed from May 2020 to date, thus we use reopening e-folding times longer than those of “lock-
downs”). A relatively low (compared to current vaccination rates in the US, Israel and part of Europe) and steady
average vaccination rate of 2 per thousand susceptible individuals (with 100% immunization)—i.e. ξout = 0.002—is
also considered in all runs, starting on 15 January 2021.
Finally, the Solar virus inactivation mechanism is introduced in the simulations by modulating the rate of
contacts β between susceptible and infected individuals through the factor (1 – ε sin(θ)), where θ is the solar
elevation angle (function of Earth’s latitude α, time of the day ξ and day of the year t) and ε is the efficiency of the
mechanism. The efficiency ε is evaluated at noon at a given Earth’s latitude α and day of the year t, and is assumed
to be equal to the saturated Solar UV Inactivation index Ξ, i.e. ε(α,t) = 1 when Ξ(α,t) ≥ 1 and ε(α,t) = Ξ(α,t) (i.e.
inversely proportional to the solar lethal times in units of 2 min) otherwise. Model solutions have a time reso-
lution of 1 day and infra-day modulations of the solar–pump efficiency are obtained by integrating daily to a
sub-resolution of ~ 1.5 min.
Figure S1 in SI shows typical yearly (main panel) and infra-day (onsets) R t modulations of an intrinsic repro-
duction number R 0 = 3, imprinted by the solar mechanism (see details in Figure’s caption).
Simulations are run for the same number of countries present in groups N, T and S of the actual SARS-CoV-2
data, with populations and latitudes sampled randomly from the actual population and latitude distributions
within each group, and then the mortality rates of each country averaged within each group to provide the solid
(models with active Solar-Pump) and dashed (models without the Solar mechanism) curves in Figure S2 of SI.
Figures’ production. All figures are produced via scripts written by us in the scripting languages Super-
mongo (https://www.astro.princeton.edu/~rhl/sm/sm.html) and IDL (https://www.harrisgeospatial.com/softw
are-technology/idl).
Data availability
All data used in this paper are public and available at specific repositories. In particular: solar UV data are made
available by the Tropospheric Emission Monitoring Internet Service (TEMIS) archive and are available at http://
www.temis.nl; data of the SARS-CoV-2 pandemic are made available by the Coronavirus Resource Center of the
John Hopkins University (CRC-JHUL) and downloadable from the repository https://d ata.h
umdat a.o
rg/d
atase t/
novel-coronavirus-2019-ncov-cases; the measurements used to build the Covid-19 action spectrum in response
to UV photons have been performed by our collaboration at the at the University of Milan, and data from these
measurements are being published in another paper from the collaboration and are available upon request by
addressing an inquire in writing to the corresponding author.
Code availability
The code that solves numerically the system of differential equations of the models used in our analysis, has been
written by the authors and is available upon request by addressing an inquire in writing to the corresponding
author.
Received: 4 June 2020; Accepted: 6 July 2021
References
1. Kowalski, W. Ultraviolet Germicidal Irradiation Handbook: UVGI for Air and Surface Disinfection (Springer, 2009).
2. Rauth, A. M. The physical state of viral nucleic acid and the sensitivity of viruses to ultraviolet. Light Biophys. J. 5, 257–273 (1965).
3. Kesavan, J., & Sagripanti, J.L. Disinfection of Airborne Organisms by Ultraviolet-C Radiation and Sunlight. (Research and Technology
Directorate, Edgewood Chemical Biological Center, U.S. Army, Aberdeen Proving Ground, Maryland 21010-5424 ECBC-TR-1011,
2012).
4. Chang, J. C. et al. UV inactivation of pathogenic and indicator microorganisms. Appl. Environ. Microb. 49, 1361–1365 (1985).
5. McDevitt, J. J., Rudnick, S. N. & Radonovich, L. Aerosol susceptibility of influenza virus to UVC light. Appl. Environ. Microbiol.
78, 1666–1669 (2012).
6. Welch, D. et al. Far-UVC light: A new tool to control the spread of airborne-mediated microbial diseases. Sci. Rep. 8, 2752 (2018).
7. Walker, C. M. & Ko, G. Effect of ultraviolet germicidal irradiation on viral aerosols. Environ. Sci. Technol. 41, 5460–5465 (2007).
8. Tseng, C. C. & Li, C. S. Inactivation of virus-containing aerosols by ultraviolet germicidal irradiation. Aerosol Sci. Technol. 39,
1136–1142 (2005).
9. Biasin, M. et al. UV-C irradiation is highly effective in inactivating SARS-CoV-2 replication. Sci. Rep. 11, 6260 (2021).
10. Lubin, D. & Jensen, E. H. Effects of clouds and stratospheric ozone depletion on ultraviolet radiation trends. Nature 377, 710–713
(1995).
11. Furusawa, Y., Suzuki, K. & Sasaki, M. Biological and physical dosimeter for monitoring solar UV-B light. J. Radiat. Res. 31, 189–206
(1990).
12. Lytle, D. C. & Sagripanti, J. L. Predicted inactivation of viruses of relevance to biodefense by solar radiation. J. Virol. 79, 14244–
14252 (2005).
13. Sagripanti, J. L. & Lytle, D. C. Estimated inactivation of coronaviruses by solar radiation with special reference to COVID–19.
Photochem. Photobiol. 96(4), 731–737 (2020).
14. Martinez, M.E. The calendar of epidemics: Seasonal cycles of infectious diseases. PLOS Pathog. 14, e1007327 (2018).
Scientific Reports | (2021) 11:14805 | https://doi.org/10.1038/s41598-021-94417-9 9
Vol.:(0123456789)www.nature.com/scientificreports/
15. Blum, A., Nicolaou, C., Henghes, B., & Lahav, O. On the anti-correlation between COVID-19 infection rate and natural UV light
in the UK. medRxiv preprint. https://doi.org/10.1101/2020.11.28.20240242 (2020).
16. Luzzatto-Fegiz, P. et al. UVB radiation alone may not explain sunlight inactivation of SARS-CoV-2. J. Infect. Dis. 223(8), 1500–1502
(2021).
17. Luzzatto-Fegiz, P. et al. UVA radiation could be a significant contributor to sunlight inactivation of SARS-CoV-2. bioRxiv preprint.
https://doi.org/10.1101/2020.09.07.286666 (2020).
18. Herman, J., Biegel, B. & Huang, L. Inactivation times from 290 to 315 nm UVB in sunlight for SARS coronaviruses CoV and CoV-2
using OMI satellite data for the sunlit Earth. Air Qual. Atmos. Health 14, 217–233 (2021).
19. Tang, L. et al. Sunlight ultraviolet radiation dose is negatively correlated with the percent positive of SARS-CoV-2 and four other
common human coronaviruses in the U.S. Sci. Tot. Environ. 751, 141816 (2021).
20. Nicastro, F. et al. Forcing seasonality of influenza-like epidemics with daily solar resonance. iScience 23, 10 (2020).
21. Schuit, M. et al. The influence of simulated sunlight on the inactivation of influenza virus in aerosols. J. Infect. Dis. 221, 372–378
(2020).
22. Carleton, T. et al. Global evidence for ultraviolet radiation decreasing COVID-19 growth rates. PNAS 118(1), e2012370118 (2021).
23. Gorman, S., & Weller, R.B. Investigating the potential for ultraviolet light to modulate morbidity and mortality from COVID-19:
A narrative review and update. Front. Cardiovasc. Med. 7, 616527 (2020).
24. Merow, C. & Urban, M. C. Seasonality and uncertainty in global COVID-19 growth rates. PNAS 117(44), 27456–27464 (2020).
25. Sagripanti, J. L. & Lytle, C. D. Inactivation of influenza virus by solar radiation. Photochem. Photobiol. 83, 1278–1282 (2007).
26. Hemmes, J. H., Winkler, K. C. & Kool, S. M. Virus survival as a seasonal factor in influenza and poliomyelitis. Nature 188, 430–431
(1960).
27. Nguyen, M. T., Silverman, A. I. & Nelson, K. L. Sunlight inactivation of MS2 coliphage in the absence of photosensitizers: Modeling
the endogenous inactivation rate using a photoaction spectrum. Environ. Sci. Technol. 48, 3891–3898 (2014).
28. Weberand, Th. P. & Stilianakis, N. I. A note on the inactivation of influenza A viruses by solar radiation, relative humidity and
temperature. Photochem. Photobiol. 84, 1601–1602 (2008).
29. de Arruda, E. et al. Acute respiratory viral infections in ambulatory children in urban northeast Brazil. J. Infect. Dis. 164, 252–258
(1991).
30. Alonso, W. J. et al. Seasonality of influenza in Brazil: A traveling wave from the Amazon to the subtropics. Am. J. Epidemiol. 165,
1434–1442 (2007).
31. Dbouk, T., & Drikakis, D. Weather impact on airborne coronavirus survival. Phys. Fluids 32, 093312 (2020).
32. Ianevski, A. et al. Low temperature and low UV indexes correlated with peaks of influenza virus activity in northern Europe during
2010–2018. Viruses 11, 207 (2019).
33. Gunthe, S.S. et al. On the global trends and spread of the COVID-19 outbreak: Preliminary assessment of the potential relation
between location-specific temperature and UV index. J. Public Health Theory Pract. (2020).
34. Chen, S. et al. COVID-19 and climate: Global evidence from 117 countries. medRxiv preprint. https://doi.org/10.1101/2020.06.
04.20121863.
35. Taagi, H. et al. The higher temperature and ultraviolet, the lower COVID-19 prevalence—Meta-regression of data from large US
cities. Am. J. Infect. Control 48, 1279–1285 (2020).
36. Isaia, G. et al. Does solar ultraviolet radiation play a role in COVID-19 infection and deaths? An environmental ecological study
in Italy. Sci. Total Environ. https://doi.org/10.1016/j.scitotenv.2020.143757 (2020).
37. Walrand, S. Autumn COVID-19 surge dates in Europe correlated to latitudes, not to temperature-humidity, pointing to vitamin
D as contributing factor. Sci. Rep. 11, 1981 (2021).
38. Takagi, H. et al. Higher temperature, pressure, and ultraviolet are associated with less COVID-19 prevalence: Meta-regression of
Japanese prefectural data. Asia Pac. J. Public Health 32(8), 520–522 (2020).
39. Carvalho, F. R. S. et al. Potential of solar UV radiation for inactivation of coronaviridae family estimated from satellite data. Pho-
tochem. Photobiol. 97(1), 213–220 (2020).
40. Biasin, M. et al. UV-A and UV-B can neutralize SARS-CoV-2 infectivity. medRxiv preprint. https://doi.org/10.1101/2021.05.28.
21257989 (2021).
41. Zhu, N. et al. A novel coronavirus from patients with pneumonia in China 2019. N. Engl. J. Med. 382, 727–733 (2020).
42. Cobey, S. Modeling infectious disease dynamics—The spread of the coronavirus SARS-CoV-2 has predictable features. Science
368, 713 (2020).
43. Monto, A. S. et al. Coronavirus occurrence and transmission over 8 years in the HIVE cohort of households in Michigan. J. Infect.
Dis. 222, 9–16 (2020).
44. Li, Y., Wang, X. & Nair, H. Global seasonality of human seasonal coronaviruses: A clue for postpandemic circulating season of
severe acute respiratory syndrome coronavirus 2?. J. Infect. Dis. https://doi.org/10.1093/infdis/jiaa436 (2020).
45. Baker, R. E., Yang, W. & Vecchi, G. A. Susceptible supply limits the role of climate in the early SARS-CoV-2 pandemic. Science
https://doi.org/10.1126/science (2020).
46. O’Connor, C., Courtney, C. & Murphy, M. Shedding light on the myths of ultraviolet radiation in the COVID-19 pandemic. Clin.
Exp. Dermatol. 46(1), 187–188 (2021).
47. Cherrie, M. et al. Ultraviolet A radiation and COVID-19 deaths in the USA with replication studies in England and Italy. Br. J.
Dermatol. https://doi.org/10.1111/bjd.20093 (2021).
48. Rendell, R., Khazova, M. & Higlett, M. O’Hagan, impact of high solar UV radiant exposures in spring 2020 on SARS-CoV-2 viral
inactivation in the UK. J. Photochem. Photobiol. 97(3), 542–548. https://doi.org/10.1111/php.13401 (2021).
49. De Natale, G. et al. The evolution of Covid-19 in Italy after the spring of 2020: An unpredicted summer respite followed by a second
wave. Int. J. Environ. Res Public Health 17, 8708 (2020).
50. Nelson, K. L. et al. Sunlight-mediated inactivation of health-relevant microorganisms in water: A review of mechanisms and
modeling approaches. Environ. Sci. Process Impacts 20, 1089–1122 (2018).
51. Zempila, M. M. et al. TEMIS UV product validation using NILU-UV ground-based measurements in Thessaloniki, Greece. Atmos
Chem. Phys. 17, 7157–7174 (2017).
52. Gueymard, C. Parameterized transmittance model for direct beam and circumsolar spectral irradiance. Solar Energy 71(5), 325–346
(2001).
53. van Doremalen, N. et al. Aerosol and surface stability of SARS-CoV-2 as compared with SARS-CoV-1. N. Engl. J. Med. 382,
1564–1567 (2020).
54. Ratnesar-Shumate, S. et al. Simulated sunlight rapidly inactivates SARS-CoV-2 on surfaces. J. Infect. Dis. 222, 214–222 (2020).
55. Stadnytskyi, V., Anfinrud, Ph., Bax, C. E. & Bax, A. The airborne lifetime of small speech droplets and their potential importance
in SARS-CoV-2 transmission. PNAS 117(22), 11875–11877 (2020).
56. Chin, A. W. H. et al. Stability of SARS-CoV-2 in different environmental conditions. Lancet Microbe 1(1), E10 (2020).
57. Sagripanti, J. L. & Lytle, C. D. Sensitivity to ultraviolet radiation of Lassa, vaccinia, and Ebola viruses dried on surfaces. Arch. Virol.
156, 489–494 (2011).
58. Madronich S. The Atmosphere and UV-B Radiation at Ground Level, in Environmental UV Photobiology (Young, A. R., Moan, J.,
Björn, L. O., & Nultsch, W. eds.) 1–39 (Springer, 1993).
Scientific Reports | (2021) 11:14805 | https://doi.org/10.1038/s41598-021-94417-9 10
Vol:.(1234567890)www.nature.com/scientificreports/
59. Verity, R. et al. Estimates of the severity of coronavirus disease 2019: A model-based analysis. Lancet Infect. Dis. 20(6), 669–677
(2020).
Acknowledgements
The work presented in this paper has been carried out in the context of the activities promoted by the Italian
Government and in particular, by the Ministries of Health and of University and Research, against the COVID19
pandemic. Authors are grateful to former and current INAF’s Presidents, Prof. N. D’Amico and M. Tavani, for the
support and for a critical reading of the manuscript. Authors are also grateful to Prof. A. Musarò, Dr. S. Covino,
Dr. M. Elvis, and Dr. F. Fiore for critically reading the papers and providing useful comments and suggestions.
Author contributions
F.N. prepared Figs. 2a and 3, 4, S1 and S2. G.S. prepared Figs. 1 and 2b. All authors contributed equally to the
discussion of the results and review of the manuscript.
Competing interests
The authors declare no competing interests.
Additional information
Supplementary Information The online version contains supplementary material available at https://doi.org/
10.1038/s41598-021-94417-9.
Correspondence and requests for materials should be addressed to F.N.
Reprints and permissions information is available at www.nature.com/reprints.
Publisher’s note Springer Nature remains neutral with regard to jurisdictional claims in published maps and
institutional affiliations.
Open Access This article is licensed under a Creative Commons Attribution 4.0 International
License, which permits use, sharing, adaptation, distribution and reproduction in any medium or
format, as long as you give appropriate credit to the original author(s) and the source, provide a link to the
Creative Commons licence, and indicate if changes were made. The images or other third party material in this
article are included in the article’s Creative Commons licence, unless indicated otherwise in a credit line to the
material. If material is not included in the article’s Creative Commons licence and your intended use is not
permitted by statutory regulation or exceeds the permitted use, you will need to obtain permission directly from
the copyright holder. To view a copy of this licence, visit http://creativecommons.org/licenses/by/4.0/.
© The Author(s) 2021
Scientific Reports | (2021) 11:14805 | https://doi.org/10.1038/s41598-021-94417-9 11
Vol.:(0123456789)You can also read