COVID 19 lockdown has altered the dynamics between affective symptoms and social isolation among older adults: results from a longitudinal network ...
←
→
Page content transcription
If your browser does not render page correctly, please read the page content below
www.nature.com/scientificreports

                OPEN              COVID‑19 lockdown has altered
                                  the dynamics between affective
                                  symptoms and social isolation
                                  among older adults: results
                                  from a longitudinal network
                                  analysis
                                  Junhong Yu1,3* & Rathi Mahendran1,2*

                                  The COVID-19 lockdown has drastically limited social interactions and brought about a climate of
                                  fear and uncertainty. These circumstances not only increased affective symptoms and social isolation
                                  among community dwelling older adults but also alter the dynamics between them. Using network
                                  analyses, we study the changes in these dynamics before and during the lockdown. Community-
                                  dwelling older adults (N = 419) completed questionnaires assessing depression, anxiety, and social
                                  isolation, before the COVID-19 pandemic, as part of a cohort study, and during the lockdown period.
                                  The total scores of these questionnaires were compared across time. For the network analyses,
                                  partial correlation networks were constructed using items in the questionnaires as nodes, separately
                                  at both timepoints. Changes in edges, as well as nodal and bridge centrality were examined across
                                  time. Depression and anxiety symptoms, and social isolation had significantly increased during the
                                  lockdown. Significant changes were observed across time on several edges. Greater connectivity
                                  between the affective and social isolation nodes at lockdown was observed. Depression symptoms
                                  have become more tightly coupled across individuals, and so were the anxiety symptoms. Depression
                                  symptoms have also become slightly decoupled from those of anxiety. These changing network
                                  dynamics reflect the greater influence of social isolation on affective symptoms across individuals
                                  and an increased vulnerability to affective disorders. These findings provide novel perspectives and
                                  translational implications on the changing mental health context amidst a COVID-19 pandemic
                                  situation.

                                  The COVID-19 outbreak has brought about a global healthcare crisis on an unprecedented scale. Healthcare
                                  systems are on the brink of exhaustion as they cope with the ever-increasing number of infections. In an attempt
                                  to slow down the spread of the virus to relieve the pressure on healthcare resources, lockdown measures have
                                  been widely implemented.
                                      Within the context in Singapore, the COVID-19 ‘lockdown’ consisted of two phases which were known locally
                                  as the ‘circuit-breaker’ and ‘phase 1’. The circuit-breaker measures were implemented on 8th April 2020. These
                                  measures included the closure of non-essential workplaces, schools, and places of worship. Eating out was no
                                  longer allowed. Food had to be taken away from food establishments and consumed at home. Residents were
                                  strongly encouraged to stay at home, unless they had to travel for essential work or needed to purchase essentials.
                                  Home-based gatherings consisting of people not within the same household were forbidden. Subsequently, some
                                  of these measures were relaxed in the phase 1 period, which spanned from 2nd to 19th June 2020. During this

                                  1
                                   Department of Psychological Medicine, Mind Science Centre, Yong Loo Lin School of Medicine, National University
                                  of Singapore, NUHS Tower Block, Level 9, 1E Kent Ridge Road, Singapore 119228, Singapore. 2Academic
                                  Development Department, Duke-NUS Medical School, 8 College Road, Singapore, Singapore. 3Psychology, School
                                  of Social Sciences, Nanyang Technological University, Singapore, Singapore. *email: junhong.yu@ntu.edu.sg;
                                  pcmrathi@nus.edu.sg

Scientific Reports |   (2021) 11:14739                | https://doi.org/10.1038/s41598-021-94301-6                                                 1

                                                                                                                                              Vol.:(0123456789)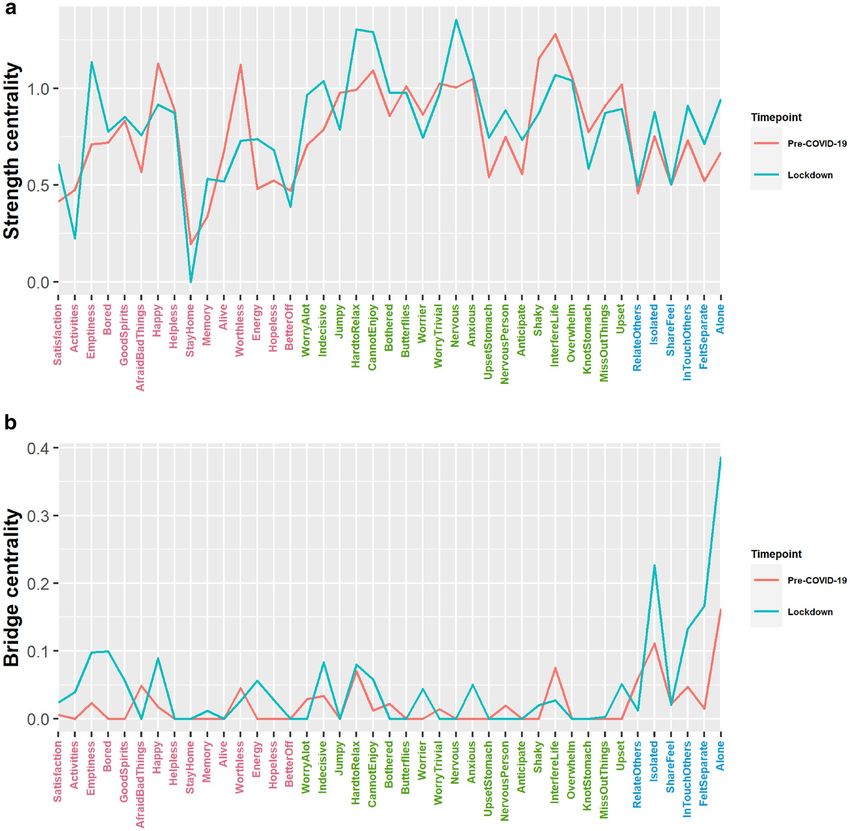
www.nature.com/scientificreports/
period, some non-essential businesses and schools could reopen, and each household could receive up to two
visitors a day.
Most of these lockdown measures were not unique to Singapore. Around the world, people are strongly
advised, or in some cases legally obligated to stay at home. Inevitably, these measures increased social isolation
within the community. While many can, to some extent, mitigate such isolation by shifting their day to day social
interactions and activities online, a sizable proportion of older adults may not be able to make this shift due to
their relatively low levels of ‘digital literacy’1. Thus, the older adult population was arguably more vulnerable to
the effects of social isolation during the lockdown. Such isolation will result in major mental health consequences.
As longitudinal research has shown, perceived and objective social isolation among older adults are significant
risk factors for developing depression and anxiety symptoms2. Nevertheless, despite their increased social isola-
tion related concerns, research have generally indicated that older adults fared significantly better than young
adults in in terms of experiencing less COVID-19-related anxiety, and less negative affect and mood states3–5.
This may be due to the fact that older adults reported higher perceived coping efficacy and were generally more
confident of the COVID-19 s ituation5.
Along with social isolation, the pandemic has also brought about a climate of f ear6. These fears generally
relate to becoming infected with the v irus7, unknowingly infecting o thers8, losing livelihoods or s tigmatization9.
Taken together with the general uncertainty of the pandemic s ituation10, these circumstances further provoked
affective symptoms. Due to these aggravating factors, we would not just expect a general increase in the levels
of affective symptoms and perceived isolation, but also a change in the dynamics between them—reflecting the
greater influence of social isolation and increased vulnerability to affective disorders during this period.
In the current study, we used network analyses to study how these dynamics have altered during the lock-
down. A network is characterized by ‘nodes’ that are linked to each other via ‘edges’. According to the network
model of psychopathology, psychiatric symptoms do not arise from psychopathology, but rather it is the dynamic
interaction (edges) between psychiatric symptoms (nodes) that constitutes p sychopathology11. Compared to
conventional analyses involving total scale scores, the network approach focuses on symptom level associations,
not just within disorder but also across disorders. The focus at the symptom level would provide more useful
insights given the heterogeneous symptomatic presentations in psychiatric disorders such as d epression12 and
the fact that different symptoms within the same disorder are associated with different risk factors, precipitating
stressors, and consequences on daily f unctioning13.
Thus far, two studies have attempted to model the interactions between affective symptoms across various
time points in the COVID-19 pandemic. The first14 compared networks consisting of nodes representing the
total scores of scales assessing depression, anxiety, stress, fear of COVID, intolerance of uncertainty, emotion
regulation and social support between lockdown and post-lockdown. Among their main findings, they note that
depression, anxiety, stress, fear of COVID tend to cluster together. The s econd15 compared networks consisting
of nodes representing items from scales assessing depression, anxiety, trauma and COVID-19-related anxiety
between two time points separated by a month, within a lockdown. In this study, it was reported that although
anxiety and depression symptoms formed separate clusters in the initial time point, both types of symptoms
eventually coalesced into a single contiguous cluster in the subsequent time point. Our study intends to extend
the work of these two studies in two important ways. First, on top of analyzing data from the lockdown time
point, we were also able to obtain data from the pre-COVID-19 time point, thus we are in a unique position
to observe the changes to the network of affective symptoms as a result of the lockdown. Second, both studies
were carried out in the general adult population, whereas we decided to focus on the older adult population,
given their increased vulnerability to social isolation, as discussed earlier. This is particularly important given
that prospective research on social isolation/loneliness among older adults during the COVID-19 pandemic
have been lacking16.
To these ends, we constructed network consisting of nodes representing the affective and social isolation-
related features before and during the lockdown, to study the changes in the network structure across time in an
older adult sample. We tested the hypothesis that social isolation had a greater influence on affective symptoms
at lockdown by examining the connectivity between the social isolation and affective nodes before and during
the lockdown. We also tested the hypothesis that the lockdown had resulted in a general increase in connectivity
among affective nodes, reflecting the increased coupling among affective symptoms and vulnerability to affec-
tive disorders.
Methods
Participants and procedures. Data collection was carried out across two time points—pre-COVID-19
and lockdown. In the former, participants (N = 762) were recruited from the community for an observational
cohort study. The inclusion criteria and recruitment procedures for this time point have been described in detail
elsewhere17. Data collection for this study took place from 1st February 2018 to 15th January 2020; all responses
for the relevant variables were collected via pen-and-paper questionnaires. Subsequently, a follow-up study was
initiated for the lockdown time point. All participants from the previous time point, except those diagnosed with
dementia, were contacted (N = 614). Data collection for this follow-up study spanned from 11th May 2020 to
19th June 2020. Depending on participants’ preference, the English or back-translated Chinese questionnaires
were administered via an online platform (i.e., Qualtrics) or pen-and-paper questionnaires mailed to them. They
were given S$10 upon completion of the questionnaires. Ethical approval for both studies was granted by the
National University of Singapore Institutional Review Board. Informed consent was obtained from participants
prior to their participation in both studies. The study procedures have been performed in accordance with the
Declaration of Helsinki.
Scientific Reports | (2021) 11:14739 | https://doi.org/10.1038/s41598-021-94301-6 2
Vol:.(1234567890)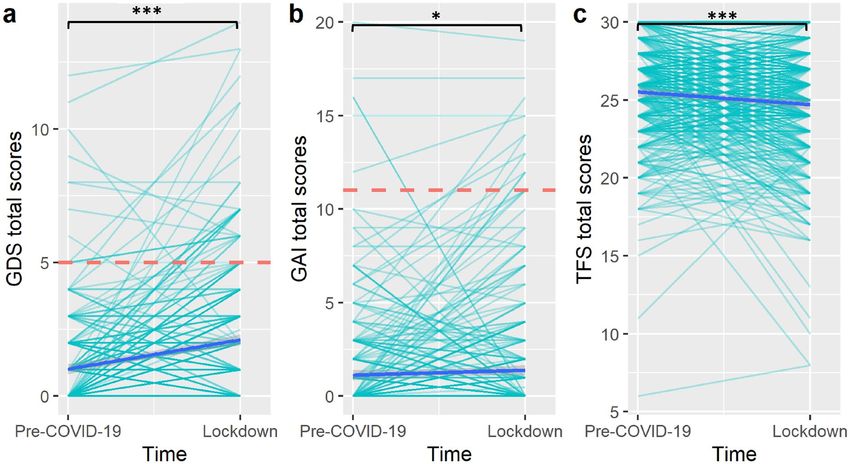
www.nature.com/scientificreports/
A total of 419 participants (275 females) completed both waves of data collection and were included in the
current analyses. They had a mean age of 69.0 years (SD = 5.5), an average of 13.6 years of education (SD = 3.8),
and a mean Mini-Mental State Examination score of 28.4 (SD = 1.5). The average follow-up period was 1.3 years
(SD = 0.52; range = 0.3 to 2.3). Most participants chose to complete the English questionnaires (N = 315); 231 and
190 participants completed the questionnaires via the online and offline options, respectively.
Measures. The 15-item version18 of the Geriatric Depression Scale (GDS) was used to index the level of
depressive symptoms. This scale consists of 15 yes/no questions, each worth a point, giving a maximum total
score of 15. It has a cutoff score of 4/5. 21 and 52 subjects exceeded this cutoff score at the pre-COVID-19 and
lockdown time points, respectively. This version of the GDS has demonstrated good psychometric validity in
the local c ontext19. It has a Cronbach alpha of 0.75 and 0.73 at the pre-COVID-19 and lockdown timepoints,
respectively.
The Geriatric Anxiety Inventory (GAI)20 was used to measure the level of anxiety symptoms. There are 20
agree/disagree items in the questionnaire, each worth a point, giving a maximum possible total score of 20. The
GAI was validated and had shown good psychometric properties in a similar Asian p opulation21. It has a Cron-
bach alpha of 0.89 and 0.92 at the pre-COVID-19 and lockdown timepoints, respectively. The GAI has a cutoff
score of 10/11. Six and 18 subjects exceeded this cutoff score at the pre-COVID-19 and lockdown time points,
respectively.
We used the friendship scale (TFS) to measure social isolation. This scale was designed specifically for use
among older adults and consisted of six 5-point scale items. The scale had excellent internal consistency and
concurrent validity according to its original validation s tudy22. TFS was previously used in an Asian sample
similar to the present and had demonstrated good concurrent v alidity23. It has a Cronbach alpha of 0.70 and
0.74 at the pre-COVID-19 and lockdown time points, respectively.
For the GDS and GAI, higher scores corresponded to worse outcomes, whereas lower scores in TFS corre-
sponded to worse outcomes. The individual items from these questionnaires were used as nodes in the network
analyses.
Statistical analyses. To provide an overview of the three outcome measures, we assessed the changes in
total scores across time using paired-samples t-tests. Then, we constructed partial correlation networks sep-
arately at both time points, using the graphical Lasso based on an extended Bayesian information criterion
(EBICglasso) option within the R package qgraph24. This approach reduces small partial correlations to zero
such that they do not appear in the final network; false-positive edges are eliminated in the process, thus leav-
ing only robust edges in the final network. The spearman’s correlation method was used in view of the ordinal
data from the TFS items. Although several graph theory metrics can be derived from these networks, not all are
meaningful and interpretable in the current context. Hence, we restricted our analyses and interpretations to
metrics such as global strength, edge values, nodal strength centrality and bridge centrality, which were more
relevant in the current context. Global strength refers to the sum of the absolute values of all edges in the net-
work. The edge value represents the partial correlation between a pair of nodes after controlling for the influence
of other nodes. The nodal strength centrality is the sum of these absolute values from all edges that connect to
the node. Bridge strength centrality indicates the sum of all absolute edge values from a node that connects to
other communities25. In the current study, the affective (GDS and GAI items) and social isolation nodes (TFS
items) are assigned to two different communities, to test the connectivity between affective symptoms and social
isolation.
In order to examine the stability of the network metrics, we carried out a case-dropping bootstrapping pro-
cedure with 1000 bootstraps and computed the correlation stability (CS) coefficients for the edge values. The CS
coefficient is defined as the maximum proportion of cases that can be dropped while maintaining a 95% prob-
ability that the correlation of the network metrics between the sample with and without dropouts is at least 0.70.
It was previously suggested that the CS coefficients should be at least 0.2526. These procedures were executed
using the R package b ootnet26.
Finally, we carried out paired network comparison tests using the R package N etworkComparisonTest27 to
compare the edge values, nodal and bridge strength centrality, and global strength between both time points.
The statistical significance of these differences across time was determined using a null distribution generated
from 5000 iterations of a permutation test. Statistical significance was set at p < 0.05. All analyses were carried
out in R 4.0.0. There were 24 missing data points out of a total of 34,358 data points. Missing data was handled
via pairwise deletion during the network estimation process.
The ‘qgraph’ function within the qgraph R package24 was used in the visualization of the constructed net-
works. To facilitate visual comparison, the nodal positions in all three networks are fixed to a common layout,
as determined by averaging layouts of the Pre-COVID-19 and lockdown networks, using the averageLayout
function within the qgraph package. The nodes are arranged such that strongly connected nodes would cluster
in the middle, whereas less connected nodes are located in the periphery of the network.
Results
Changes in total scores across time. Table 1 shows the descriptive statistics of the three questionnaires’
total scores at both timepoints. Figure 1 illustrates the changes across time in these total scores. Paired-samples
t-tests revealed GDS (t = 10.61, p ≤ 0.001, cohen’s d = 0.52) and GAI (t = 2.30, p = 0.022, cohen’s d = 0.11) scores
had increased significantly, whereas TFS scores had decreased significantly (t = 5.14, p ≤ 0.001, cohen’s d = 0.25)
during the lockdown period.
Scientific Reports | (2021) 11:14739 | https://doi.org/10.1038/s41598-021-94301-6 3
Vol.:(0123456789)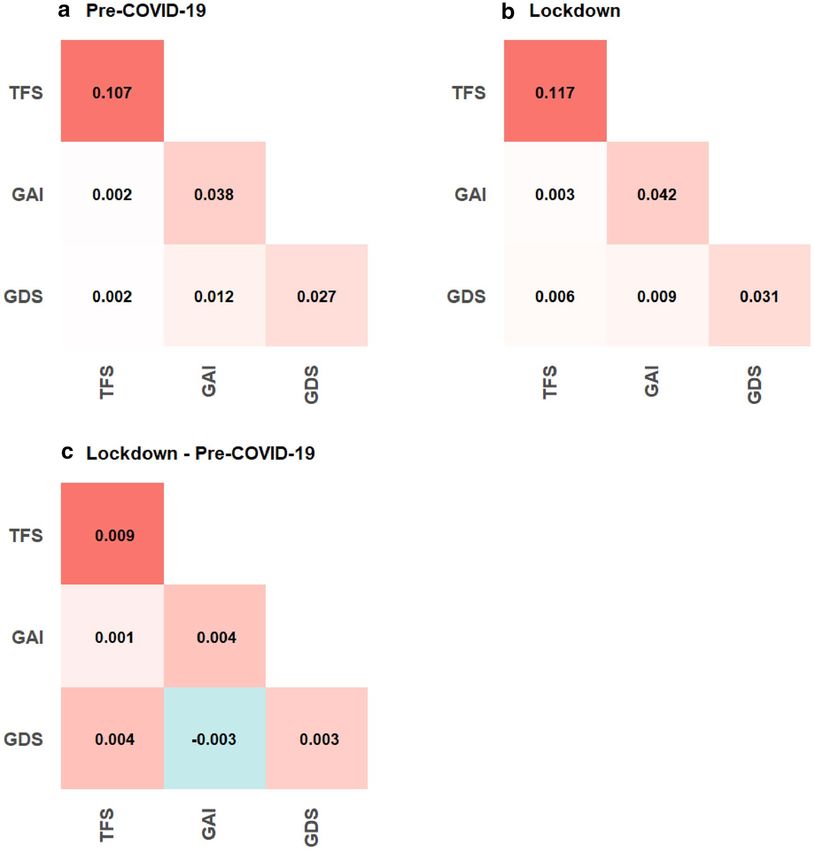
www.nature.com/scientificreports/
Variable M SD
1. GDSpre-COVID-19 1.02 1.76
2. GAIpre-COVID-19 1.12 2.58
3. TFSpre-COVID-19 25.51 3.22
4. GDSlockdown 2.11 2.30
5. GAIlockdown 1.38 3.14
6. TFSlockdown 24.70 3.57
Table 1. Descriptive statistics. GDS geriatric depression scale, GAI geriatric anxiety inventory, TFS the
friendship scale.
Figure 1. Changes in the total scores of (a) geriatric depression scale, (b) geriatric anxiety inventory and (c) the
friendship scale across time. Each light blue line represents the trajectory of a single participant. The dark blue
line represents the mean trajectory. The red dotted lines represent the clinical cutoffs for the geriatric depression
scale and geriatric anxiety inventory. *p < 0.05, ***p < 0.001.
Network analyses. The CS coefficients for the edges at pre-COVID-19 and lockdown were 0.39 and 0.44,
respectively; the CS coefficients for the centrality strength were 0.44 and 0.44 at both time points. These results
suggest that the orders of edge and centrality strengths are interpretable with some c are26. Figures S1 and S2
in the Supplementary Materials further show how the average correlation of the edges and nodes between the
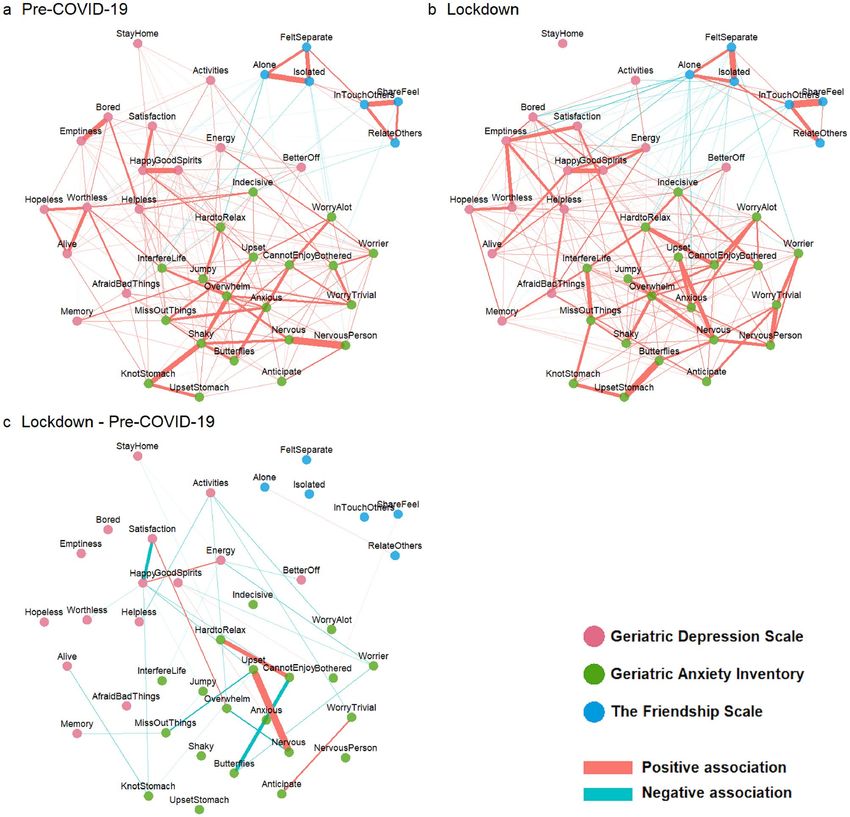
original and bootstrapped samples varies with the proportion of sampled cases. Figure 2a and b illustrate the
pre-COVID-19 and lockdown networks. These networks consisted of consisted of 228 and 260 non-zero edges,
respectively. Figure 3A and B provide a summary of the within- and between-questionnaire nodal connectivity
at both timepoints. As shown in the figures, the average absolute edge values between-questionnaires were low
(i.e. 0.002 to 0.012) compared to those of within-questionnaires (i.e. 0.027 to 0.117)—suggesting that within-
questionnaire nodal connections dominated the network and relatively fewer and weaker connections exist
between any two questionnaires. Table 2 shows the 10 strongest edges at each time point. These edges occurred
generally between highly similar nodes within the same questionnaire.
Moving on to comparisons across time, global strength was not significantly different (p = 0.72) at pre-
COVID-19 and lockdown. Overall, the average absolute edge values have increased within and between ques-
tionnaires, except between GDS and GAI (see Fig. 3C). A closer examination in the differences across time in
individual nodes (see Fig. 4) would suggest that various nodes had increased and decreased in nodal and bridge
strength centrality across time, though none of these changes emerge statistically significant from the permu-
tation tests. Across both timepoints, the nodes from the GAI tend to be higher in centrality than those of the
GDS and TFS. Narrowing down to the individual edges, our permutation analyses identified 34 edges that had
changed significantly across time (see Fig. 2c).
Scientific Reports | (2021) 11:14739 | https://doi.org/10.1038/s41598-021-94301-6 4
Vol:.(1234567890)www.nature.com/scientificreports/
Figure 2. Partial correlation networks depicting items from the geriatric depression scale, geriatric anxiety
inventory and the friendship scale at (a) Pre-COVID-19 and (b) lockdown. Differences across time in edges
values are presented in the (c) Lockdown—Pre-COVID-19 network. Only the edges with significant changes
(uncorrected p > 0.05) across time, as determined by the paired network comparison test, are shown. “Positive
association” and “Negative association” in the context of (c) meant that the edges became more positive or
negative, respectively, across time. Thicker lines corresponded to stronger associations.
Interpretations. There could be many possible interpretations arising from the results at the level of the
individual nodes and edges. For brevity sake, we shall discuss a few. First, the ‘StayHome’ (i.e. Do you prefer
to stay at home, rather than going out and doing new things?) and ‘activities’ (i.e., Have you dropped many of
your activities and interests?) nodes were located toward the periphery of the network plot, reflecting their low
centrality indices. In particular these centrality indices were even lower in the lockdown time point, suggest-
ing that these nodes were highly irrelevant in the assessment of depression at the lockdown time point. This is
not surprising since staying home during the lockdown was no longer a personal choice that was influenced by
one’s mood, but a mandatory lockdown requirement. Likewise, the dropping of many activities and interests
should be seen as the direct consequence of the lockdown restrictions, and was unlikely to be attributed to mood
changes. Indeed, we observed that a few edges that connected between the ‘activities’ node and depressive/anxi-
ety nodes had significantly weakened in the lockdown time point (see Fig. 2c). Next, the edge between ‘Upset’
(i.e., I often feel upset) and ‘Nervous’ (i.e., I often feel nervous) registered the largest change across time in the
network—suggesting that feelings of nervousness and upset have become more intimately linked during the
Scientific Reports | (2021) 11:14739 | https://doi.org/10.1038/s41598-021-94301-6 5
Vol.:(0123456789)www.nature.com/scientificreports/
Figure 3. Average (absolute) edge values between and within questionnaires at (A) pre-COVID-19, (B)
Lockdown and (C) of the difference between both timepoints. The diagonal represents the average (absolute)
edges values within questionnaires.
Pre-COVID-19 Lockdown
Edge Weight Edge Weight
Nervous ↔ nervous person 0.327 Share feel ↔ in touch others 0.330
Isolated ↔ alone 0.276 Butterflies ↔ upset stomach 0.324
Shaky ↔ knot stomach 0.271 Isolated ↔ felt separate 0.296
Good spirits ↔ happy 0.268 Good spirits ↔ happy 0.250
Share feel ↔ in touch others 0.267 Worry trivial ↔ nervous person 0.249
Emptiness ↔ bored 0.265 Nervous ↔ upset 0.243
Isolated ↔ felt separate 0.226 Interfere life ↔ miss out things 0.232
Alive ↔ worthless 0.210 Hard to relax ↔ cannot enjoy 0.224
Cannot enjoy ↔ butterflies 0.199 Satisfaction ↔ emptiness 0.213
Relate others ↔ in touch others 0.196 Relate others ↔ in touch others 0.211
Table 2. The 10 strongest edges at each time point.
Scientific Reports | (2021) 11:14739 | https://doi.org/10.1038/s41598-021-94301-6 6
Vol:.(1234567890)www.nature.com/scientificreports/
Figure 4.. (A) Strength centrality and (B) bridge centrality of all nodes across both time points. The red, green
and blue axis labels correspond to the items from the geriatric depression scale, geriatric anxiety inventory and
the friendship scale, respectively.
lockdown. Speculatively, the experience of nervousness could have been appraised more negatively, possibly due
its increased likelihood to accompany other socio-affective consequences, as reflected by the increased centrality
of ‘Nervous’ across time.
Moving on to the results at the questionnaire level. The TFS nodes appeared to be weakly associated with
the GDS and GAI nodes at pre-COVID-19, as indicated visually by the smaller number and magnitude of edges
(see Fig. 2a), and also objectively via the relatively low average absolute edge values (see Fig. 3A). However, these
TFS nodes became more visibly connected to the GDS and GAI nodes at lockdown (see Fig. 2b); these connec-
tions were also associated with higher average absolute edge values (see Fig. 3B) and bridge strength centrality
(see Fig. 4B). Taken together, this suggests that social isolation had a greater influence on affective symptoms at
lockdown than at pre-COVID-19. While connectivity has increased within all three questionnaires at lockdown,
as indicated by the increased average edge values, some decoupling between the GDS and GAI nodes has also
occurred. For instance, multiple edge connections between GDS and GAI nodes have weakened significantly
(see Fig. 2c) and the average edge values between GDS and GAI have also decreased across time (see Fig. 3C).
Scientific Reports | (2021) 11:14739 | https://doi.org/10.1038/s41598-021-94301-6 7
Vol.:(0123456789)www.nature.com/scientificreports/
Discussion
The current study investigated how a COVID-19 lockdown has altered the dynamics between depression, anxi-
ety, and social isolation. Overall, participants’ well-being had worsened significantly in these socio-affective
domains during the lockdown. The lockdown has strengthened the association between social isolation and
affective symptoms. Importantly, our results also indicated that depression, anxiety, and social isolation nodes
were more strongly coupled within their respective domains during the lockdown, despite the slight decoupling
between depression and anxiety. This strong coupling meant that across individuals, the appearance of any single
affective symptom is likely to coincide with the appearance of other related symptoms. Likewise, the appearance
of any single social isolation-related perception is also likely to coincide with those of other related perceptions.
Our network-based findings provide novel and useful perspectives on the increased vulnerability to psychopa-
thology during this period.
While it is expected that perceived social isolation would have increased during this period of time, it is some-
what alarming that such perceptions had become more strongly associated with affective symptoms. There are
two likely explanations for this. First, the same level of perceived isolation may have become more distressful or
appraised more negatively during the lockdown. For instance, our results showed that the thought of being ‘alone’
has become more likely to co-occur with several depression nodes, including feelings of ‘emptiness’. Speculatively,
participants were more likely during the lockdown to overinterpret or overgeneralize their feelings of loneliness
as emptiness in their life. Second, the lockdown might have weakened protective factors that could have miti-
gated affective symptoms. Hence, the same level of perceived social isolation has become more damaging in the
absence of these protective factors. For instance, physical activity, which has been drastically limited during the
lockdown, was known to protect older adults from depression28. In particular, previous research has shown that
even a single session of physical exercise, can significantly enhance the emotional r egulation29 that is needed to
buffer against affective dysfunction. Social support is another such protective factor that has weakened; in fact,
it might have a double role in the current context. While the difficulty of accessing social support during the
lockdown has increased the perceptions of social isolation, the lack of social support also made it difficult for
one to cope with s tress30 and regulate e motions31. In general, these weakened protective factors could amplify
the effects of most if not all etiological factors associated with affective disorders, beyond that of social isolation.
Across individuals, the lockdown has increased the coupling of symptoms within the depression or anxiety
syndrome. This suggests that affective symptoms are more likely to appear concurrently with other symptoms
as part of a larger cluster of depression or anxiety symptoms, alluding to a steeper developmental trajectory of
affective dysfunction. The weakened protective factors, as discussed above, especially in relation to compromised
emotional regulation, could have allowed internalizing symptoms, such as those associated with depression
and anxiety to escalate more r apidly32,33. This increased coupling of within-syndrome symptoms could also be
attributed to a ‘third variable problem’; that is, the tight coupling between these symptoms was merely the conse-
quence of them being triggered by the same extraneous variable. In the current context, this ‘third variable’ could
manifest as the fear, uncertainty, and daily stressors associated with the COVID-19 pandemic. Regardless of the
cause, the increased within-syndrome coupling among affective symptoms reflects an increased vulnerability to
affective dysfunction. Interestingly, despite the increased within-syndrome coupling, the syndromes appeared
to have decouple from each other. Speculatively, this could mean that depression and anxiety are triggered by
different lockdown-related factors. For instance, the fear of getting infected with COVID-19 may be more specific
in triggering anxiety symptom34, whereas the lockdown-related isolation may aggravate depression symptoms35
more so than those of anxiety.
Our findings present important implications in the wider public health context. First, we provided valuable
longitudinal evidence pointing to the deteriorating mental health situation among community-dwelling older
adults. Second, in view of the fact that the COVID-19 pandemic has overstretched healthcare resources, it has
become even more important to identify efficient intervention targets, to maximize treatment gains with mini-
mal resources. To this end, we have identified several symptoms that were highly central in the network such
as nervousness, anhedonia, perceptions of loneliness and emptiness. Given their centrality in the network, the
successful treatment of these symptoms would likely ‘switch off ’ other connected symptoms13, thus accelerating
the recovery process. Nevertheless, efficacy of such a targeted treatment approach needs to be empirically tested
as previous findings in this area have been mixed. While two intervention studies have shown that the centrality
of a treated symptom predicts overall improvement in the network of symptoms associated with social anxiety
disorder36 and posttraumatic stress disorder (PTSD)37, a more recent s tudy38 utilizing another PTSD sample
did not observe the centrality of the treated symptom to be significantly associated with improvements in the
other symptoms.
Next, our network maps identified certain low centrality symptoms such as ‘StayHome’ and ‘Activities’. While
these ‘symptoms’ have been shown to contribute significantly in classifying depressed and healthy controls in
the validation studies that occurred prior to COVID-19, in light of the ongoing COVID-19 restrictions, these
‘symptoms’ may no longer reflect a mood disturbance. This issue extends beyond the GDS—for instance the
Hamilton Depression Rating Scale has an item assessing daily activities39. Thus, epidemiological surveys that used
such scales to assess depression during the COVID-19 lockdown periods may have inadvertently over-estimated
the severity or prevalence of depression symptoms.
The current findings are subjected to some limitations. First, given that the COVID-19 situation and its
associated lockdown can vary very differently across countries and cities, it would be difficult to generalize our
results to other older adult populations in other countries and cities. Second, given that the data collection for
the pre-COVID-19 time point spanned across almost two years, the follow-up durations are highly variable
across participants and may potentially confound our results. Subjects with longer follow-up durations are more
likely to experience significant social and/or personal events that would influence their levels of depression,
Scientific Reports | (2021) 11:14739 | https://doi.org/10.1038/s41598-021-94301-6 8
Vol:.(1234567890)www.nature.com/scientificreports/
anxiety, and social isolation between the pre-COVID-19 baseline and the lockdown timepoints. This meant
that the changes in these socio-affective variables between both timepoints are less likely to be attributed to the
COVID-19 lockdown for these subjects. Third, although the CS coefficients were satisfactory (≥ 0.25), they were
still below the recommended 0.5026. This meant that the associations between nodes across the study participants
were not as stable as desired—it is possible that a small group of participants with extreme scores are driving
these associations. Thus, the findings of the current study would require validation in larger sampled studies.
Finally, while it is tempting to interpret these results from a within-person perspective (i.e., symptom becomes
more tightly coupled within a person), this would not be justified because our results are derived from between-
subject networks. Nevertheless, these between-subject findings do reveal on a macroscopic level, the general
structural changes of affective symptomology in relation to perceived social isolation during a lockdown. These
networks also generate testable hypotheses on the psychiatric developmental trajectories shared by i ndividuals11.
Data availability
The datasets generated during and/or analysed during the current study are not publicly available due to the
conditions of our ethics approval but are available from the corresponding author on reasonable request.
Code availability
The R code for executing these analyses and generating the figures are available at https://osf.io/gu4wd/files/.
Received: 23 February 2021; Accepted: 6 July 2021
References
1. Borg, K., Boulet, M., Smith, L. & Bragge, P. Digital inclusion & health communication: A rapid review of literature. Health Com-
mun. 34, 1320–1328 (2019).
2. Domènech-Abella, J., Mundó, J., Haro, J. M. & Rubio-Valera, M. Anxiety, depression, loneliness and social network in the elderly:
Longitudinal associations from The Irish Longitudinal Study on Ageing (TILDA). J. Affect. Disord. 246, 82–88 (2019).
3. Rosi, A. et al. Risk perception in a real-world situation (COVID-19): How it changes from 18 to 87 years old. Front. Psychol. 12,
1–8 (2021).
4. Klaiber, P., Wen, J. H., DeLongis, A. & Sin, N. L. The ups and downs of daily life during COVID-19: Age differences in affect, stress,
and positive events. J. Gerontol. B. Psychol. Sci. Soc. Sci. 76, e30–e37 (2021).
5. Ceccato, I. et al. Age-related differences in the perception of COVID-19 emergency during the Italian outbreak. Aging Mental.
Health. 25, 1305–1313 (2020).
6. Ho, C. S. H., Chee, C. Y. & Ho, R. C. Mental health strategies to combat the psychological impact of COVID-19 beyond paranoia
and panic. Ann. Acad. Med. Singapore 49, 1–3 (2020).
7. Ahorsu, D. K. et al. The fear of COVID-19 scale: Development and initial validation. Int. J. Ment. Health Addict. 1, 1–9 (2020).
8. Mayer, Y., Etgar, S., Shiffman, N. & Lurie, I. The Fear of COVID-19 Familial Infection Scale: Initial Psychometric Examination. (2020).
9. Adhanom Ghebreyesus, T. Addressing mental health needs: An integral part of COVID-19 response. World Psychiatry 19, 129–130
(2020).
10. Koffman, J., Gross, J., Etkind, S. N. & Selman, L. Uncertainty and COVID-19: How are we to respond?. J. R. Soc. Med. 113, 211–216
(2020).
11. Borsboom, D. & Cramer, A. O. J. Network analysis: An integrative approach to the structure of psychopathology. Annu. Rev. Clin.
Psychol. 9, 91–121 (2013).
12. Goldberg, D. The heterogeneity of ‘major depression’. World Psychiatry 10, 226–228 (2011).
13. McNally, R. J. Can network analysis transform psychopathology?. Behav. Res. Ther. 86, 95–104 (2016).
14. Di Blasi, M. et al. Psychological distress associated with the COVID-19 lockdown: A two-wave network analysis. J. Affect. Disord.
284, 18–26 (2021).
15. Zavlis, O. et al. How does the COVID-19 pandemic impact on population mental health? A network analysis of COVID influ-
ences on depression, anxiety and traumatic stress in the UK population. Psychol. Med. https://doi.org/10.1017/S00332917210006
35 (2021).
16. Dahlberg, L. Loneliness during the COVID-19 pandemic. Aging Mental. Health. 25, 1161–1164 (2021).
17. Lee, R. Z. Y. et al. CHI study: Protocol for an observational cohort study on ageing and mental health in community-dwelling
older adults. BMJ Open 10, e035003 (2020).
18. Sheikh, J. I. & Yesavage, J. A. Geriatric depression scale (GDS): Recent evidence and development of a shorter version. Clin. Ger-
ontol. 5, 165–173 (1986).
19. Nyunt, M. S. Z., Fones, C., Niti, M. & Ng, T.-P. Criterion-based validity and reliability of the Geriatric Depression Screening Scale
(GDS-15) in a large validation sample of community-living Asian older adults. Aging Ment. Health 13, 376–382 (2009).
20. Pachana, N. A. et al. Development and validation of the geriatric anxiety inventory. Int. Psychogeriatr. 19, 103–114 (2007).
21. Yan, Y., Xin, T., Wang, D. & Tang, D. Application of the geriatric anxiety inventory-Chinese version (GAI-CV) to older people in
Beijing communities. Int. Psychogeriatr. 26, 517–523 (2014).
22. Hawthorne, G. Measuring social isolation in older adults: Development and initial validation of the friendship scale. Soc. Indic.
Res. 77, 521–548 (2006).
23. Nikmat, A. W., Hashim, N. A., Omar, S. A. & Razali, S. Depression and loneliness/social isolation among patients with cognitive
impairment in nursing home. ASEAN J. Psychiatry 16, 222–231 (2015).
24. Epskamp, S., Cramer, A. O. J., Waldorp, L. J., Schmittmann, V. D. & Borsboom, D. {qgraph}: Network visualizations of relationships
in psychometric data. J. Stat. Softw. 48, 1–18 (2012).
25. Jones, P. J., Ma, R. & McNally, R. J. Bridge centrality: A network approach to understanding comorbidity. Multivariate Behav. Res.
https://doi.org/10.1080/00273171.2019.1614898 (2019).
26. Epskamp, S., Borsboom, D. & Fried, E. I. Estimating psychological networks and their accuracy: A tutorial paper. Behav. Res.
Methods 50, 195–212 (2018).
27. van Borkulo, C. D. et al. Comparing network structures on three aspects: A permutation test. J. Stat. Softw. https://doi.org/10.
13140/RG.2.2.29455.38569 (2017).
28. Strawbridge, W. J., Deleger, S., Roberts, R. E. & Kaplan, G. A. Physical activity reduces the risk of subsequent depression for older
adults. Am. J. Epidemiol. 156, 328–334 (2002).
29. Bernstein, E. E. & McNally, R. J. Acute aerobic exercise helps overcome emotion regulation deficits. Cogn. Emot. 31, 834–843
(2017).
Scientific Reports | (2021) 11:14739 | https://doi.org/10.1038/s41598-021-94301-6 9
Vol.:(0123456789)www.nature.com/scientificreports/
30. Kwag, K. H., Martin, P., Russell, D., Franke, W. & Kohut, M. The impact of perceived stress, social support, and home-based physical
activity on mental health among older adults. Int. J. Aging Hum. Dev. 72, 137–154 (2011).
31. Marroquín, B. Interpersonal emotion regulation as a mechanism of social support in depression. Clin. Psychol. Rev. 31, 1276–1290
(2011).
32. Hofmann, S. G., Sawyer, A. T., Fang, A. & Asnaani, A. Emotion dysregulation model of mood and anxiety disorders. Depress.
Anxiety 29, 409–416 (2012).
33. Crowell, S. E., Puzia, M. E. & Yaptangco, M. The ontogeny of chronic distress: emotion dysregulation across the life span and its
implications for psychological and physical health. Curr. Opin. Psychol. 3, 91–99 (2015).
34. Lee, S. A., Mathis, A. A., Jobe, M. C. & Pappalardo, E. A. Clinically significant fear and anxiety of COVID-19: A psychometric
examination of the Coronavirus Anxiety Scale. Psychiatry Res. 290, 113112 (2020).
35. Killgore, W. D. S., Cloonan, S. A., Taylor, E. C., Miller, M. A. & Dailey, N. S. Three months of loneliness during the COVID-19
lockdown. Psychiatry Res. 293, 113392 (2020).
36. Rodebaugh, T. L. et al. Does centrality in a cross-sectional network suggest intervention targets for social anxiety disorder?. J.
Consult. Clin. Psychol. 86, 831–844 (2018).
37. Papini, S., Rubin, M., Telch, M. J., Smits, J. A. J. & Hien, D. A. Pretreatment posttraumatic stress disorder symptom network metrics
predict the strength of the association between node change and network change during treatment. J. Trauma. Stress 33, 64–71
(2020).
38. Spiller, T. R. et al. On the validity of the centrality hypothesis in cross-sectional between-subject networks of psychopathology.
BMC Med. 18, 297 (2020).
39. Hamilton, M. A rating scale for depression. J. Neurol. Neurosurg. Psychiatry 23, 56–62 (1960).
Acknowledgements
This work was supported by Research Donations from Kwan Im Thong Hood Cho Temple and Lee Kim Tah
Holdings Pte Ltd, under the Mind Science Centre, Department of Psychological Medicine, National University
of Singapore.
Author contributions
J.Y. designed the study, analyzed the data and wrote the manuscript. R.M. obtained funding for the study and
assisted in the writing of the manuscript.
Competing interests
The authors declare no competing interests.
Additional information
Supplementary Information The online version contains supplementary material available at https://doi.org/
10.1038/s41598-021-94301-6.
Correspondence and requests for materials should be addressed to J.Y. or R.M.
Reprints and permissions information is available at www.nature.com/reprints.
Publisher’s note Springer Nature remains neutral with regard to jurisdictional claims in published maps and
institutional affiliations.
Open Access This article is licensed under a Creative Commons Attribution 4.0 International
License, which permits use, sharing, adaptation, distribution and reproduction in any medium or
format, as long as you give appropriate credit to the original author(s) and the source, provide a link to the
Creative Commons licence, and indicate if changes were made. The images or other third party material in this
article are included in the article’s Creative Commons licence, unless indicated otherwise in a credit line to the
material. If material is not included in the article’s Creative Commons licence and your intended use is not
permitted by statutory regulation or exceeds the permitted use, you will need to obtain permission directly from
the copyright holder. To view a copy of this licence, visit http://creativecommons.org/licenses/by/4.0/.
© The Author(s) 2021
Scientific Reports | (2021) 11:14739 | https://doi.org/10.1038/s41598-021-94301-6 10
Vol:.(1234567890)You can also read