Deterra Royalties Demerger Briefing - 10 September 2020 Julian Andrews Chief Executive Officer - Iluka Resources
←
→
Page content transcription
If your browser does not render page correctly, please read the page content below
Deterra Royalties
Demerger Briefing
10 September 2020
Julian Andrews
Chief Executive Officer

Important notices and disclaimer
     This presentation has been prepared by Iluka Resources Limited (Iluka). By accessing this presentation you acknowledge that you have read and understood the following statement.
     This presentation contains s ummary informa tion about Iluka, Deterra Royalties Limited (Deterra Royalties) and each of their activities current as at 10 Septembe r 2020. The information in this presenta tion is of a general background nature and does not purport to be comple te. It
     should be read in conjunction with Iluka’s othe r periodic a nd continuous disclosure announceme nts, including the Deme rger Booklet date d 10 Septem ber 2020 rela ting to the proposed deme rger of Dete rra Royalties from Iluka (Demerger Booklet), which is available at
     www.iluka.com.
     Decisions regarding voting on the demerger should be made on the basis of the Demerger Booklet. Decisions regarding investing in Deterra Royalties shares should be made on the basis of the information memorandum tha t will be lodged in connection with its listing on the
     Australian Securities Exchange.
     This document provides a n indica tive outlook for the Iluka bus iness in the 2020 financial year. The information is provide d to assist s ophisticate d investors with the modelling of the company, but s hould not be relied upon as a predictor of future pe rformance. The current outlook
     parameters supersede all previous key physical and financial parameters.
     This information is based on Iluka forecasts and as such is subject to variation related to, but not restricted to, economic, market dema nd/supply and competitive factors. I t is Iluka’s approach to modify its production settings based on market demand, a nd this can have a
     significant effect on operational parameters and associated physical and financial characteristics of the company.
     Forward Looking Statements
     This prese ntation contains ce rtain stateme nts which constitute “forward-looking statements”. Often, but not always, forwa rd looking statements can gene rally be ide ntified by the use of forward looking words such as “may”, “will”, “e xpect”, “plan”, “be lieves”, “estimate”,
     “anticipate”, “outlook” and “guida nce”, or similar expressions, and may include, without limita tion, statements regarding plans; strategies and objectives of management; anticipated production and production potential; estimates of future capital expenditure or cons truction
     commencement dates; expected costs or production outputs; estimates of future product supply, demand and consumption; statements regarding future product prices; and statements regarding the expectation of future Mineral Resources and Ore Reserves.
     Where Iluka expresses or implies an expectation or belief as to future events or results, such expectation or belief is expressed in good faith and on a reasonable basis. No representa tion or wa rranty, express or implied, is made by Iluka tha t the matters stated in this presentation
     will in fact be achieved or prove to be correct.
     Forward-looking statements are only predictions and are subject to known and unknown risks, uncerta inties, assumption a nd othe r important factors that could cause the actua l results, pe rformances or achievements of Iluka to differ materially from future results, performances
     or achievements expressed, projected or implied by such forwa rd-looking s tatements. Readers are cautione d not to place undue reliance on these forward-looking statements, which speak only as of the date thereof. Such risks and factors include, but a re not limited to: changes
     in e xchange rate assumptions; changes in product pricing assumptions; major changes in mine plans and/or resources; changes in equipme nt life or capa bility; emergence of previously unde restima ted technical challenges; increased costs and demand for production inputs; a nd
     environmental or social factors which may affect a licence to operate, including political risk.
     Capital estimates include contingency and risk allowances commensurate with international estimating classification systems.
     To the exte nt pe rmitted by law, Iluka, its officers, employees and advisors expressly disclaim any res ponsibility for the accuracy or comple teness of the mate rial contained in this presentation and exclude all liability whatsoever (including in neglig ence) for any loss or damage
     which may be suffe red by a pers on as a consequence of any information in this presenta tion or any e rror or om ission therefrom. Iluka does not undertake to release publicly any revisions to any forward-looking sta tement to reflect events or circumstances afte r the date of this
     presentation, or to reflect the occurrence of unanticipated events, except as may be required under applicable securities laws.
     No independent third party has reviewed the reasonableness of the forward-looking statements or any underlying assumptions.
     Non-IFRS Financial Information
     This docume nt contains non-IFRS financial measures including cash production costs, non-production cos ts, Mineral Sands EBITDA, Underlying Group EBITDA, EBIT, free cash flow, and ne t debt amongst othe rs. Iluka management considers these to be key fina ncial pe rformance
     indicators of the business and they are defined and/or reconciled in Iluka’s annual results materials and/or Annual report. Non-IFRS measures have not been subject to audit or review.
     All figures are expressed in Australian dollars unless stated otherwise.

2.
Contents
1 Demerger Overview 5
2 Introduction to Deterra Royalties 9
3 MAC Royalty: The Cornerstone Asset 14
4 Growth Opportunities: Organic 16
4 Growth Opportunities: Investment 19
5 Dividend Policy 23
6 Conclusion: Investment Highlights 25
Appendices
A Royalty Industry 28
B Deterra Royalties Background Information 31
C Supporting Financial Information 35
D Background to Iron Ore Markets 37
E Key Risks 40
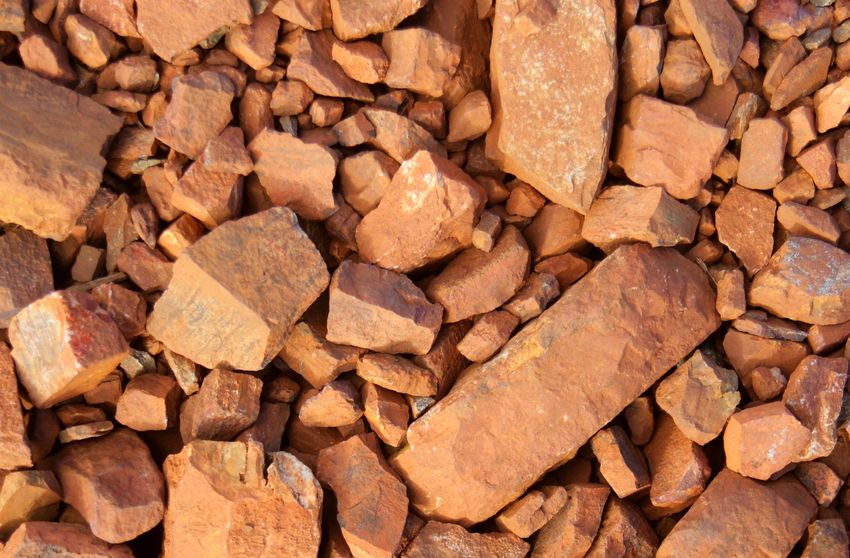
Source: BHP
3.
Key Management                                                                                                4

   Iluka Resources                                       Deterra Royalties

         Tom O’Leary              Adele Stratton            Julian Andrews             Brendan Ryan
     Chief Executive Officer   Chief Financial Officer    Chief Executive Officer   Chief Financial Officer
Subsection
     1. Demerger
     Title Description
     Overview

5.
Demerger Overview                                                                                                                                               6

Demerger will result in two separate ASX-listed businesses – Iluka will continue to be a global leader in the mineral sands industry
while Deterra Royalties will be the largest ASX-listed resources focused royalty company

Overview                                                                                    Post-demerger Structure
• The demerger will result in two independent ASX listed companies – Iluka and
  Deterra Royalties – each with a management team focused on pursuing its
  growth strategy                                                                                                   Iluka shareholders
• Iluka shareholders will have the opportunity to vote on the Demerger at the
  Extraordinary General Meeting on 16 October 2020
                                                                                                       100%                                        80%
      ‒   Iluka Directors unanimously recommend that Iluka shareholders vote in favour of
          the Demerger Resolution                                                                        Iluka                20%
                                                                                                                                       Deterra Royalties
                                                                                                  (ex. royalty business)
      ‒   The Independent Expert has also concluded that the Demerger is in the best                                                         ASX:DRR
                                                                                                         ASX:ILU
          interests of Iluka shareholders
                                                                                              Leading international mineral         Australia’s largest resources
• Iluka shareholders will be entitled to receive 1 share in Deterra Royalties for                   sands company                         royalty company
  each existing share held in Iluka
• Iluka has received a favourable draft class ruling from the Australian Tax Office
  (ATO) for demerger tax relief. As is usual, any final class ruling will only be
  issued after implementation of the demerger.
• Iluka will retain a 20% interest in Deterra Royalties as a long-term investment
Demerger Rationale                                                                                                                                                                                                                  7

  Iluka’s Mineral Sands business and Royalty business are two fundamentally different businesses, consequently a demerger has the
  potential to unlock shareholder value over time

                                       Mineral Sands Business                                                        Royalty Business

Business                               A leading pure play mineral sands company globally                            Australia’s largest ASX-listed resources royalty company
                                                                                                                                                                                Demerger has the potential to unlock
Current commodity mix                  Mineral sands (zircon and titanium feedstocks)                                Iron ore (primarily)
                                                                                                                                                                                shareholder value by:
                                       Rare earths
                                                                                                                                                                                  • empowering Board and management to focus on
Key assets                             Cataby, Capel, Narngulu and Eneabba, Western Australia                        MAC Royalty, Western Australia                                 the individual business plans and distinct
                                       Jacinth-Ambrosia, South Australia                                             Portfolio of five small royalties (two in production)          growth strategies for each business;
                                       Sierra Rutile, Sierra Leone
Management areas of                    Large-scale mining and processing operations                                  Mining investment                                            • allowing clearer choice for shareholders;
expertise required                     Engineering and project delivery                                              Project finance
                                       Exploration and geology                                                       Mergers and acquisitions                                     • allowing greater flexibility and focus when
                                       Occupational health and safety management                                     Business development                                           pursuing growth opportunities for each
                                       Customer marketing and offtake                                                Capital markets                                                business;
                                       Technical and financial analysis of development options

Relative cost of capital               Higher                                                                        Lower                                                        • providing the ability to adopt an appropriate
                                                                                                                                                                                    capital structure for each business; and
Capital intensity                      Yes                                                                           No
                                                                                                                                                                                  • allowing enhanced management focus and
Operating cost exposure                Yes                                                                           No1                                                            alignment of incentives to drive business
Dividend policy                        40% of FCF (not required for investment or balance sheet                      Intended policy will be to payout 100 per cent of net          performance.
                                       purposes)                                                                     profit after tax 2

Growth profile                         Investment focused on organic growth profile                                  Organic: extension or expansion of Mining Area C,
                                       Project delivery and mine life extension                                      including BHP’s South Flank expansion
                                       Exploration success                                                           Investment: acquisition of value accretive
                                                                                                                     complementary royalties

1. MAC Royalty has limited operating cost exposure other than to the extent operating costs impacts the economic viability of the underlying mine.
2. Deterra’s approach to dividends and dividend policy will be determined by the Deterra Board at its discretion and may change over time.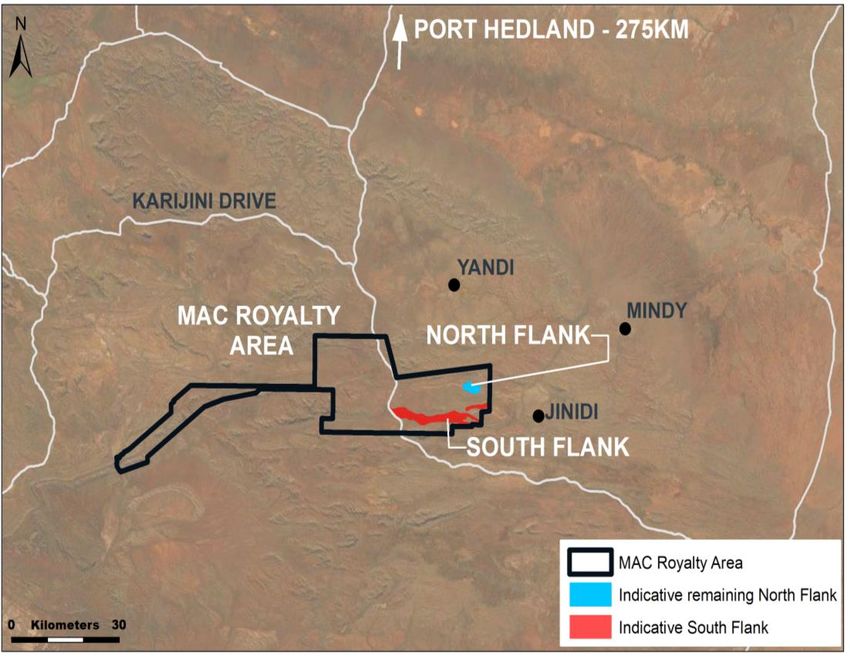
Key dates                                                                                                                                                                          8

Subject to a shareholder vote on 16 October 2020, Deterra Royalties will commence trading on the ASX as a separately listed entity on
23 October 2020 on a deferred settlement basis
Event                                                                                                                                                                            Date

Last time and date for determining eligibility to vote at the Extraordinary General Meeting                                              4.00pm (AWST) Wednesday, 14 October 2020

Extraordinary General Meeting                                                                                                                 9.30am (AWST) Friday, 16 October 2020

Last time and date by which Sale Facility Forms must be received by Iluka Share Registry                                                   2.00pm (AWST) Thursday, 22 October 2020

Last date Iluka Shares trade on ASX cum-entitlements under the Demerger                                                                                    Thursday, 22 October 2020

ASX listing of Deterra Royalties (ASX: DRR)                                                                                                                   Friday, 23 October 2020

Deterra Royalties Shares to be distributed to Iluka Shareholders commence trading on ASX on a deferred settlement basis                                       Friday, 23 October 2020

Time and date for determining entitlement to Deterra Royalties Shares under the Demerger (the Record Date)                                  4.00pm (AWST), Monday, 26 October 2020

Implementation Date and transfer of Deterra Royalties Shares to Eligible Shareholders (other than Selling Shareholders and Sale Agent)                     Monday, 2 November 2020

Normal trading of Deterra Royalties Shares on ASX commences                                                                                                Tuesday, 3 November 2020

Completion of sale of Deterra Royalties Shares under Sale Facility                                                                                     By Monday, 30 November 2020

                                                                                                                                            Expected to occur on or before Tuesday, 17
Dispatch of payment to Ineligible Overseas Shareholders and Selling Shareholders
                                                                                                                                                                       December 2020

All dates in the above timetable are indicative only and are subject to change. A more detailed indicative timetable is inclu ded in the Demerger Booklet.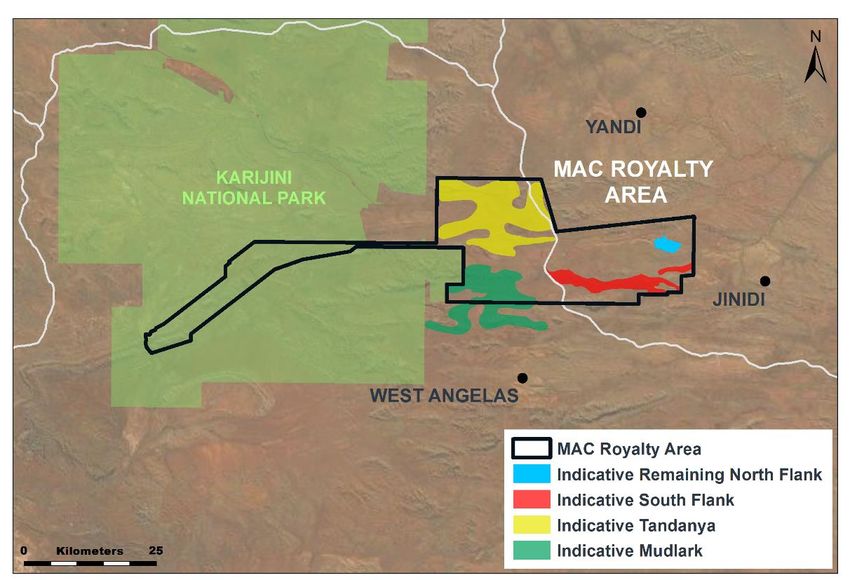
Subsection
     2. Introduction to
     Title Description
     Deterra  Royalties

                          Source: BHP

9.
Experienced Board and Senior Management

      Board and senior management reflects a diverse range of expertise across the global resources sector
      Board Member                    Biography                                                         Executive Member               Biography
             Jenny Seabrook       •    Over 30 years experience across capital markets, mergers                Julian Andrews      •    Extensive experience in diversified portfolio investment,
             Independent Chair         and acquisitions and accounting advisory roles and numerous             Managing Director        project finance, capital raising and mergers and acquisitions
                                       directorships                                                           & Chief Executive        across a range of industries including mining, energy and
                                  •    Currently a non-executive director of BGC and Australian Rail           Officer                  chemicals.
                                       Track Corporation. Select previous directorships include Iluka                              •    Joined Iluka as Head of Business Development in 2017 and in
                                       Resources, MMG and Export Finance                                                                2018 expanded his role to Head of Strategy, Planning and
                                                                                                                                        Business Development
             Graeme Devlin        •    Highly experienced mining executive, served as BHP’s head                                   •    Previously held various roles at Wesfarmers, including
                                       of acquisitions and divestments from 2009 to 2016                                                General Manager, Business Development and Chief Financial
             Independent Non-
                                  •    Previous experience in variety of business development,                                          Officer in Wesfarmers Chemicals, Energy & Fertilisers division
             Executive Director        investment evaluation, project and structured finance roles
                                       within BHP group, Rio Tinto and CRA Limited
                                                                                                               Brendan Ryan        •    Over 30 years of commercial and operational experience in
             Joanne Warner        •    Extensive global asset management experience in mining and                                       the global mining industry.
                                       energy sector, including 8 years as Head of Global Resources
                                                                                                               Chief Financial     •    Most recently served as Chief Financial Officer and Chief
             Independent Non-                                                                                  Officer                  Business Development Officer at Boart Longyear, an ASX-
                                       at Colonial First State Global Asset Management
             Executive Director   •    Currently a non-executive director of First Quantum Minerals                                     listed global drilling services company.
                                       and Geo40 Limited                                                                           •    Previously held a number of senior business development
                                                                                                                                        roles at Rio Tinto with a focus on evaluation and delivery of
             Adele Stratton       •    Joined Iluka in 2011 and was appointed Chief Financial                                           investment opportunities, culminating in serving as Rio
                                       Officer in September 2018.                                                                       Tinto’s Global Head of Business Evaluation 2012-2015.
             Non-Executive                                                                                                         •    Mr Ryan began his career in engineering and operations roles
                                  •    Qualified chartered accountant with 20 years’ experience
             Director                  working in both professional practice and public listed                                          at Shell / Anglo Coal in Queensland, Australia.
             (Iluka nominee)           companies

10.
A structurally advantaged business model
Listed royalty companies provide investors with exposure to the value created through the discovery, extraction and sale of
natural resources, typically without full exposure to some of the key operating risks of mining businesses
The royalty business model Royalty companies structural advantages relative to alternatives
• Royalty: contractual agreements that involve a one-time up-front payment (or Royalty Mining Physical
asset transfer) in return for future payments, typically based on a percentage of companies companies commodity
revenue or profit from a specific project or set of tenements. Exposure to:
• Stream: contractual agreements whereby the holder purchases a percentage of
the production from an identified mine, for an upfront payment plus an additional
Commodity price changes ✓ ✓ ✓
✓ ✓
payment when the product is delivered.
Income potential3 ×
• Royalty companies that hold revenue based royalties typically have an
advantaged position in a mining company’s capital structure, accessing cash
flows ahead of debt and equity capital providers
Exploration or production upside ✓ ✓ ×
Limited exposure to:
Established business model in other jurisdictions
+50
Capital development costs4 ✓ × ✓
listed royalty companies globally US$56bn increase in market cap
(primarily in North America and UK) of major royalty players over 10 years 1 Asset level operating costs4 ✓ × ✓
336% return over 10 years from a
global index of royalty companies 2
No ASX-listed
companies today of scale
royalty Environmental costs and OH&S
risks4 ✓ × ✓
Notes: (1) Based on increase in market capitalisation f rom 31 July 2010 to 31 July 2020 of the f ollowing major roy alty companies: Franco-Nev ada, Wheaton Precious Metals, Roy al Gold Inc, Osisko Gold Roy alties,
Sandstorm Gold, Altius Minerals Corporation, Mav erix Metals Inc, Nomad Roy alty Company, Anglo Pacif ic Group and Labrador Iron Ore Corporation. (2) Total shareholder returns with div idends reinv ested. Roy alties index
11. weighted by market capitalisation in US dollars. Note: Roy alty companies included in the Roy alties Index are exposed to v arious dif f erent commodities to Deterra and interests are ty pically held within a portf olio of roy alty
and / or streaming interests. (3) Ty pically recurring income is by way of div idends associated with the business perf ormance compared to holding the phy sical commodity . (4) Risk is limited to extent that the mine or project
is not closed due to one of these risk f actors.A new investment vehicle in the Australian resources sector
Deterra Royalties’ business model is simple and structurally advantaged relative to other forms of investment in resources
• Business model is simple with initially one Deterra Business Model
primary source of revenue Revenue royalties portfolio
• Growth strategy focused on increasing Cornerstone MAC Royalty Other royalties New Investments
earnings and diversification through Royalty revenue = 1.232% of A$
value accretive investments over time revenue from MAC Royalty Area1 New royalties Adjust capital structure
as required
• Funded by significant debt carrying
Strong free cash flow and growth outlook
capacity and a conservative approach
to capital management DETERRA ROYALTIES New royalty Acquire new
revenue royalties
Low overheads & debt
Shareholder distributions 2 target 100% NPAT
payout ratio, franked to extent possible
DETERRA ROYALTIES Ability to access capital
SHAREHOLDERS
Notes: (1) Deterra Roy alties also receiv ed capacity pay ments under the MAC Roy alty Agreement; (2) Deterra’s approach to div idends and div idend policy will be determined by the Deterra Board
at its discretion and may change ov er time.
12.High margin business with strong earnings
Deterra Royalties is a high margin business with revenue driven by the MAC Royalty, which is linked to iron ore prices, sales
volumes from the MAC Royalty Area and the AUD:USD exchange rate
MAC Royalty revenue and pro-forma EBITDA margin (A$ million; %)1 Pro-forma income statement
Year end 31 December 2018 2019 H1 2019 H1 2020
H1 MAC Revenue H2 MAC Revenue Deterra Pro-forma EBITDA margin
93% Sales volumes (North Flank) MDMT 51.6 55.4 27.6 28.6
92%
Average iron ore price A$/t 64.3 86.7 84.8 87.4
88% MAC Royalty Revenue A$m 55.6 85.1 41.2 48.0
Other royalty revenue A$m 0.4 0.6 0.3 0.1
44 Pro-forma costs A$m (6.7) (6.8) (3.4) (3.5)
EBITDA A$m 49.3 78.9 38.1 44.6
26 EBITDA margin % 88% 92% 92% 93%
Depreciation A$m (0.4) (0.4) (0.2) (0.2)
48
41 Interest & finance A$m (0.4) (0.4) (0.2) (0.2)
29
Profit before income tax A$m 48.5 78.1 37.7 44.2
Income tax A$m (14.7) (23.6) (11.4) (13.3)
2018 2019 2020
Source: (1) Iluka periodic reports and Deterra pro forma accounts.
Profit / (loss) after tax A$m 33.8 54.5 26.3 30.9
13.Subsection
3. MAC Royalty
Title Description
The Cornerstone
Asset
Source: BHP
14.MAC Royalty Overview
Ownership of the MAC Royalty gives Deterra Royalties exposure to one of the premier iron ore mines globally as measured by
scale, cost position, credibility of the operator and remaining asset life
• Operated by BHP, world’s largest diversified mining company, ASX-listed
Mining Area C
• A long-life, high-grade, low-cost asset forming part of BHP’s integrated Western Australia Iron Ore Operations
• >30 year asset life, with BHP having a track record of Reserves replacement
• Three ‘A’ credit rated owners of Mining Area C - BHP, Mitsui and Itochu
Iron ore total cash cost curve (2023F)1: MAC North & South Flank MAC Royalty is Deterra Royalties’ cornerstone asset2
Total cash cost
(US$/dmt) 1st quartile 2nd quartile 3rd quartile 4th quartile
200 MAC Royalty
Ongoing 1.232% One-off A$1 million per
150 of Australian dollar one million tonne
A$85.1 million
denominated FOB revenue increase in annual
from the MAC Royalty Area production MAC Royalty CY19 revenue
100 (Revenue Payments) (Capacity Payments)
MAC Operations
50
BHP 139 million dmtpa
55 million dmt
Operated mine Production capacity +30 years
CY19 sales volume
within its WAIO post completion of remaining mine life
0 Mining Area C
0 200 400 600 800 1,000 1,200 1,400 1,600 1,800 2,000 South Flank
Million tonnes (dry)
Notes: (1) Source: Wood Mackenzie. Total cash costs are def ined as direct cash cost associated with the mining, processing and transport of the marketable product, including general and
administration ov erhead costs directly related to mine production, roy alties, lev ies and other indirect taxes. (2) Ref er to page 34 f or summary of Deterra Roy alties’ other roy alty interests.
15.Subsection
4. Growth
Title Description
Opportunities:
Organic
16.Near term organic growth driven by South Flank
MAC iron ore sales volumes are expected to more than double by 2023 due to BHP’s South Flank expansion, which is now
over 76% complete
Mining Area C sales volumes (million dmt)1,2
• 145 million wmtpa (139 million dmtpa) iron ore production rate from MAC s a les volumes
(mi llion dmt) Revenue (A$M)
2023 expected to be sustained for more than thirty years, with BHP 160 200
having a history of Reserves replacement at its Western Australian Sales Volumes (LHS) Revenue (RHS) (historical only) 139 180
140
Iron Ore Operations
Mining Area C sales volumes expected to 160
120
• No operating or capital contribution required from Deterra Royalties - more than double by 2023 through the 140
development of South Flank
attractive free cash flow conversion characteristics 100
120
80 100
– one-off $1 million per 1 million tonne increase in annual production
80
60 55
– 1.232% of increased revenue from MAC Royalty Area 60
40
40
20
20
- -
2003
2004
2005
2006
2007
2008
2009
2010
2011
2012
2013
2014
2015
2016
2017
2018
2019
2020
2021
2022
2023
Notes: (1) Source: Iluka reported MAC Roy alty sales volumes, Wood Mackenzie, Iron Ore Markets and Asset Rev iew, June
2020; (2) 100 per cent basis. Assumes f orecast sales v olumes is equal to production.
Forecast
17.Multiple future growth options at Mining Area C
Current MAC operations expected to continue until ~2050 with two potential mining areas identified by BHP in its long-term
plan, Tandanya and Mudlark, likely to fall at least partially within the Royalty Area extending the potential royalty cash flows
BHP’s current operations at North Flank and South Flank are Future Mines - BHP’s 50-100 Year Plan1
expected to continue until ~2050:
“First ore from South Flank is targeted in the 2021 calendar year,
with the project expected to produce ore for more than 25
years.”
ASX Announcement, BHP approves South Flank project, 14 June 2018
“It is expected that the life of the Mining Area C mining
operation, inclusive of Northern and Southern Flanks, will be
approximately 30 years, commencing in approximately 2020.”
Mining Area C Southern Flank Public Environmental Review, May 2017.
… with potential for future development to extend operations
well beyond that date:
“The long-term strategy for Mining Area C is to continue
operations to 2073.”
Mining Area C Mine Closure Plan AML7000281 Rev 3.1 October 2017
Notes: (1) Source: BHP, overlay of illustrative MAC Royalty Area. Location and mineralisation outline are for illustrative pu rposes only.
18.Subsection
4. Growth
Title Description
Opportunities:
Investment
19.Growth strategy focused on
value accretive investment
Deterra Royalties will seek to build a portfolio of royalty
interests focusing on earnings growth and diversification by
making complementary and value accretive investments
Key objectives of this strategy are to achieve:
• Multiple sources of earnings growth – new royalties with attractive
returns, exposure to mine life extensions and production increases
• Greater cash flow resilience and lower risk – through portfolio
diversification
• Leverage to scaleable cost structure – very limited incremental
operating costs are expected to be required for new investments
• Disciplined approach – to investment and capital allocation
20.Unique position as only listed Australian royalty investment company of scale
Deterra Royalties’ growth parameters Deterra Royalties’ competitive advantage
In evaluating opportunities within these parameters, Deterra Royalties will focus
Types of Focus on revenue or sales based royalties on opportunities where it brings a competitive advantage
royalties Production or near production assets
✓ Only ASX-listed Australian royalty investment company of scale: Local
headquarters and Board and management’s knowledge and relationships
Broad commodity focus – bulk commodities, precious metals, base make the company well placed to identify opportunities across Australia’s
Types of metals, battery materials and energy will be considered. Will target significant resources sector
commodities transparent end markets and avoid commodities that are subject to
potential regulatory restrictions or environmental pressures. ✓ Valuable scrip currency: ASX-listed scrip will provide the currency to
monetise assets for natural sellers of these assets.
Primary focus on Australian opportunities ✓ Commodity scope: Commodity strategy will be driven by the ability to
Geography Other geographies assessed on case-by-case basis generate value, and will consider a broad range of commodities and
opportunities. The company will not operate under the same investment
policies as many other global royalty sector participants
All projects and investments will be assessed across a range of ESG
✓ Strong board and management team: The company is led by a dedicated
ESG criteria (i.e. environmental, OH&S, community and indigenous
management team and board with broad relationships and expertise in a
relationships)
diverse range of commodities, financing and deal structuring.
21.Strong capacity to fund growth through the conservative use of debt and equity
Deterra Royalties has been set up with low debt, providing it with significant debt funding capacity in order to pursue value
accretive growth
Low debt at inception Pro-forma net debt A$14.2 million
provides significant debt
funding capacity Debt facility of A$40m for general corporate and working capital purposes
Debt funding to be Intention to maintain a conservative balance sheet in line with international peers
supplemented by equity While acquisitions can be funded through debt, this will be supplemented by equity to the extent
to extent required required to maintain a conservative balance sheet
Disciplined funding
model that focuses on 100% NPAT dividend payout ratio2
consistent cash returns The company’s funding model may evolve over time depending on the nature of future acquisitions
to shareholders
Notes: (1) Source: Factset as at 31 July 2020; (2) Deterra’s approach to div idends and div idend policy will be determined by the Deterra Board at its discretion and may change ov er time.
22.Subsection
5. Dividend
Title
PolicyDescription
23.Attractive dividends expected to flow from ownership of long life MAC Royalty
Low debt and a scaleable corporate structure are designed to support the flow of dividends to shareholders
• Dividend policy to pay out 100% of Illustrative EBIT Sensitivity (A$ million, real) assuming MAC sales of 139 million dmtpa 2
NPAT as dividends, fully franked to Future steady state Iron Ore Fines: US$/DMT, 62% Fe (CFR)
extent possible1 production (2023 onward)
139 million dmtpa 55 65 75 Spot (106)
• Earnings will be sensitive to iron ore
0.75 $109m $133m $157m $231m
prices, sales volumes and foreign
0.70 $117m $143m $169m $248m
AUD:USD
exchange rates
Spot (0.70) $116m $142m $168m $247m
• Deterra Royalties will have a
0.65 $126m $154m $182m $268m
conservative capital structure in place,
0.60 $138m $168m $198m $291m
which will limit interest costs
The potential EBIT sensitivity table incorporates the following assumptions:
• Scaleable corporate structure and low • MAC Royalty Revenue Payments are based on quarterly sales volumes – sensitivity table assumes sales volumes equal to 100 per cent of
G&A cost base production in the period, being 139 million dmtpa;
• assumed Australia to China freight charges of US$7.8/dmt as per Wood Mackenzie average forecast freight rates between 2020 and 2027 to
convert the benchmark CFR price index to FOB terms to align with MAC Royalty Revenue Payment terms which are based on FOB rev enue;
• assumed overall lump proportion as a percentage of total sales volumes of 35 percent post South Flank ramp -up based on BHP estimates;
• 22 per cent Lump premium over the 62% Fe CFR index price for fines based on the historical five-year average premium to 31 July 2020; and
• standalone corporate costs of A$6.9 million based on 2020 pro forma accounts.
Notes: (1) Deterra’s approach to div idends and div idend policy will be determined by the Deterra Board at its discretion and may change ov er time. (2) Iron ore price range based on Wood Mackenzie long term real price
24. f orecast of US$65/dmt plus and minus US$10.0/dmt and spot price of US$106/dmt based on the 31-day av erage of the 62% Fe CFR iron ore price to 31 July 2020; f oreign exchange rate range based on f iv e cent
increments within the last two y ear trading range and spot based on the 31-day av erage to 31 July 2020 of 0.704 AUD:USD; MAC EBIT sensitiv ity table excludes expected one-of f capacity payments, pay able to Deterra
Roy alties as annual tonnages increase with South Flank ramp up.Subsection
6. Conclusion:
Title Description
Investment
Highlights
Source: BHP
25.Royalty sector companies trade at premium multiples
Large royalty companies tend to trade on higher multiples relative to large mining companies given the attractive operating
model and exposure to the commodity outlook and growth
Attractive valuation compared to large Multiples Comparison – Largest royalty companies vs Largest Miners1,2,3,4,5,6,7
mining companies
EV / EBITDA (CY21)
• Large royalty sector companies typically trade at Precious Metals Focused Royalty Companies Gold Miners Large Iron Ore Exposed Miners
higher multiples relative to large mining companies 33.6x
Average: 24.1x Average: 6.1x
Average: 8.4x
‒ reflects structural advantages royalties have 27.9x
22.1x 21.3x
relative to investment in large mining companies 15.5x
9.9x 9.2x 9.1x 8.4x
5.5x 7.2x 6.9x 6.6x
‒ upside exposure to production growth and 3.8x
commodity prices, with minimal exposure to Franco- Wheaton Sandstorm Royal Gold Osisko Agnico Eagle Barrick Newcrest Newmont AngloG old BHP RIO FMG Vale
Nevada Mines Ashanti
capital, operating and environmental costs
Price / NAV
• Large royalty companies also typically trade at
Precious Metals Focused Royalty Companies Gold Miners Large Iron Ore Exposed Miners
premiums to market assessed net asset values (ie
broker assessed valuations, typically on a 3.5x 3.3x Average: 2.6x
Average: 1.7x Average: 1.2x
discounted cash flow basis) 2.8x
2.0x 1.9x 1.8x 1.9x
1.9x
• Over time, with successful execution of its strategy, 1.3x 1.3x 1.4x
0.9x
1.3x
0.8x
Deterra Royalties would aim to emulate the success
of these larger royalty groups Franco- Wheaton Sandstorm Royal Gold Osisko Agnico Eagle Barrick Newcrest Newmont AngloGold BHP RIO FMG Vale
Nevada Mines Ashanti
Notes: (1) Source: Factset as at 31 July 2020; (2) The largest listed roy alty companies ty pically have a signif icant skew towards gold and precious metals in their asset bases. To compare v aluation metrics on a like-f or-like
basis, set out abov e is a comparison of the largest listed roy alty companies to the largest listed gold miners f rom a v aluation perspectiv e.(3) The enterprise v alue is calculated as the sum of equity v alue (calculated as the
closing share price as at 31 July 2020 multiplied by the total shares on issue) plus net debt and minority interests as at the last audited balance date. (4) Forecast EBITDA is the median av ailable broker f orecast. The av erage
of 2021 and 2022 is used to create a CY 2021 f orecast where companies hav e a June f inancial y ear end. Details regarding the broker f orecasts used in this section are set out in Appendix A of the Demerger Booklet. (5) Share
26. prices, equity v alues, net asset v alues and EBITDA f orecasts are conv erted f rom local currency to USD at the prev ailing spot rate on 31 July 2020. Debt and minority interests are conv erted f rom local currency to USD at the
prev ailing spot rate on the last audited balance date. (6) P/NAV ratio is the current share price div ided by the broker consensus net asset v aluation per share, essentially a measure of what premium or discount a company
trades at relativ e to assessed broker discounted cash f low v aluation f or the company . (7) The net asset v alue per share is the median av ailable broker f orecast. Details regarding the broker f orecasts used in this section are set
out in Appendix A of the Demerger Booklet.Key drivers of success
Deterra Royalties will initially focus on maximising earnings and dividends to shareholders from Mining Area C and will look to
execute a disciplined growth strategy that builds a portfolio of royalties over time
Maximise value from existing portfolio Execute disciplined growth strategy
Invest in new royalties that are complementary and
Strong and growing Strong cash flows with embedded growth from the MAC Increase scale and value accretive
cash flows Royalty diversification Build a portfolio of royalties that provides strong
earnings growth and diversification
Scaleable corporate
Scaleable corporate structure and low G&A cost base Maintain discipline Management focused on disciplined capital allocation
structure
Significant debt
Target dividend payout of 100% NPAT 1 that will be Significant debt carrying capacity to fund value accretive
Maximise dividends carrying capacity to
franked to the maximum extent possible acquisitions
fund growth
Maximise shareholder value
Notes: (1) Deterra’s approach to div idends and div idend policy will be determined by the Deterra Board at its discretion and may change ov er time.
27.Subsection
Appendix A:
Title Description
Royalty Industry
28.Evolution of the royalty industry
The listed resources royalty industry has grown significantly over the last decade given its appeal to investors relative to other
resources investments and an attractive form of financing for mining projects
Growing business model1,2 Track record of delivering superior returns1,3
Market capitalisation
(US$ million)
70 Franco-Nevada 500
S&P/TSX Global Mining
Wheaton Precious Metals
Royal Gold S&P/ASX200 Resources 336%
60
Sandstorm Gold 369% growth in market
400 Royalties Index
Osisko Gold cap over 10 years
50 Labrador Iron Ore Royalty
Maverix Metals
Nomad Royalty Company 300
40
Anglo Pacific
Altius Minerals
30
200
20
35%
100 27%
10
- -
2010 2011 2012 2013 2014 2015 2016 2017 2018 2019 2020 2010 2012 2014 2016 2018 2020
Notes: (1) Source: Factset as at 31 July 2020; (2) Selected companies hold a combination of roy alties and streams. Ref er to Section 2.2.3 of the Demerger Booklet f or the def initions of each. Market capitalisation calculated in
US dollars. (3) Total shareholder returns with div idends reinv ested. Roy alties index weighted by market capitalisation in US dollars. Constit uents include: Franco-Nev ada, Wheaton Precious Metals, Roy al Gold Inc, Osisko Gold
29. Roy alties, Sandstorm Gold, Altius Minerals Corporation, Mav erix Metals Inc, Nomad Roy alty Company , Anglo Pacif ic Group and Labrador Iron Ore Corporation. Note: Roy alty companies included in the Roy alties Index are
exposed to v arious dif f erent commodities to Deterra Roy alties and interests are ty pically held within a portf olio of roy alty and / or streaming interestsListed royalty companies
The listed resources royalty business model is well-established in North America. However there are no pure-play non-precious
royalty companies of similar scale and quality to Deterra Royalties
Market cap Approximate
Select peers1 (US$bn) Listing # of royalties Commodity focus
• There are over 50 listed royalty companies globally
who are primarily located in North America 30.4 TSE, NYSE 374 Precious metals
24.3 TSE, NYSE 29 Precious metals
• The listed royalty sector historically focused on
precious metals 9.2 NASDAQ 187 Precious metals
• Over time, the business model has evolved: 1.9 TSE, NYSE 135 Precious metals
‒ precious metals royalty companies now also 1.8 TSE, NYSE 200 Precious metals
have non-precious metals royalties
1
1.2 TSE Iron ore
‒ royalties and streams are now an alternative (mine equity + royalty) 2
source of financing for greenfield mining
projects, exploration and recapitalisations 0.6 TSE, NYSE 100 Precious metals
0.6 TSE 10 Precious metals
‒ companies have looked to acquire historical
royalties which are often established in M&A or 0.3 LON, TSE 15 Coal, Iron ore
through legacy commercial relationships
Base metals, Potash,
0.3 TSE 52
Iron ore
Notes: (1) Based on company disclosures as at 31 July 2020. Market capitalisation f or each company calculated as the closing share price as at 31 July 2020 multiplied by the total number of shares on issue. (2) This
30. company ’s scope of inv estment is limited by its constitution to this one iron ore mine only .Appendix B:
Subsection
Title Description
Deterra Royalties
Background
Information
31.History of Mining Area C
Mining Area C has a long history dating back to when the Mount Goldsworthy JV was created in 1962.
South Flank expansion drives decision
to review the Mining area C’s position
within Iluka portfolio
1962 1994 2018 2019
Establishment of Mount Goldsworthy JV Creation of the MAC Royalty South Flank expansion Iluka commenced a
review of the businesses
The Mount Goldsworthy Joint Venture was created The MAC Royalty was created to release BHP and South Flank project commenced
optimal corporate &
in February 1962 between Consolidated Gold Fields the other joint venture parties from the deferred construction in July 2018 and as at June capital structure
(Australia) Pty. Limited, an antecedent of Iluka now consideration due under the 1977 Sale and 2020, the project construction was more than
known as Deterra Royalties (MAC) Limited, and two Purchase Agreement. 76 per cent complete and on schedule and
other joint venture parties. budget to reach first production in 2021.
Once at full ramp up, Mining Area C is
Note: Iluka has evolved through several predecessor
companies before being formed in 1998 as a result of expected produce 139 million dmtpa.
merger between Westralian Sands and Renison Goldfields
Consolidated.
1977 2003
Sale of the joint venture interest Mining Area C commenced production
One-third interest in the Mount Goldsworthy joint In April 2002, the BHP board approved the development of MAC. The 2020
venture was sold in 1977, a portion which was paid as project was commissioned in 2003, with first ore railed from the MAC
deferred consideration. Subsequently, further changes Royalty Area to the port at Nelson Point on 16 August 2003. Iluka announced its
in ownership occurred, including the acquisition of an intention to demerge
The first shipment of ore departed Nelson Point on 24 September 2003. Deterra Royalties
interest in the joint venture by BHP Iron (BHP) in 1979.
The initial production capacity was 15 Mtpa. Since then, production has
increased significantly and in 2019 produced 60 million wmt.
32.Map of Mining Area C
Mining Area C Royalty Area1
• Mining Area C is located in WA ~90km
north west of Newman Township in the
Pilbara region
• The MAC Royalty area is the area of
mining area ‘C’ as defined under the Iron
Ore (Mount Goldsworthy) Agreement Act
and principally relates to the Mining Area
C operation
• The Pilbara region is one of the premier Western Australia
iron ore regions in the world
Notes: (1) Source: BHP, ov erlay of illustrative MAC Roy alty Area. Note: Location and mineralisation outline digitised f rom sm all scale map and should be used f or illustrativ e purposes only ; (2) Wood
Mackenzie, Iron Ore Markets and Asset Rev iew, June 2020.
33.Portfolio of royalties
Deterra Royalties holds five other royalties (in addition to the MAC Royalty) as part of its existing portfolio
Deterra Royalties
Project 1 Counterparty Location Commodity Status Royalty Key Terms
Revenue (2019)
Yoongarillup Mineral Sands Mine
Doral Mineral Sands Pty 2% of revenue from
(certain tenements) South West, WA Mineral sands Producing A$0.6 million
Limited sales of Minerals
(under two royalty agreements)
Sheffield Resources
1.5% of gross revenue
Eneabba Project Limited Mid West, WA Mineral sands Exploration n/a
from sales of Minerals
Cable Sands (W.A.) Pty $0.70 per tonne of
Wonnerup Project South West, WA Mineral sands Production Nil
Ltd Valuable Heavy Mineral
St Ives Gold Mining No known 3% of gross revenue
St Ives Gold Project Eastern Goldfields, WA Minerals n/a
Company Pty Limited activity (subject to conditions)
Notes: Ref er to section 2.8 of the Demerger Booklet f or additional inf ormation on the portf olio of other roy alties.
34.Appendix C:
Subsection
Title Description
Supporting
Financial
Information
35.Prudent capital structure to support business strategy
Deterra Royalties has been established with a conservative capital structure to provide it with the financial flexibility to pursue
value accretive growth
Capital Structure Balance Sheet
Pro-forma capital structure (as at 30 June 2020) A$ million, pro forma Pro-forma balance sheet (as at 30 June 2020) A$ million, pro forma
Drawn debt 14.2 Cash nil
Cash and cash equivalents nil Total Assets 17.0
Net debt 14.2 Debt 14.2
Undrawn debt 40 Total Liabilities 15.9
Total liquidity 25.8 Total Equity 1.1
• Deterra Royalties has been established with a conservative capital structure,
providing it with financial flexibility to pursue value accretive growth • Deterra Royalties’ book equity reflects the MAC Royalty held on balance sheet
at $10.2 million
• Deterra Royalties’ dividend policy is to pay 100% of NPAT as dividends which are
franked to the maximum extent possible1
• Deterra Royalties’ first dividend paid will be for half year ending 31 December 2020
1. Deterra Roy alties’ approach to div idends and div idend policy will be determined by the Deterra Board at its discretion and may change ov er time.
36.Appendix D:
Subsection
Title Description
Background to
Iron Ore Markets
37.Iron ore market outlook – Demand
Demand commentary Global seaborne iron ore demand
CAGR
• Global seaborne iron ore demand has more than tripled over the past two decades Mt
1600 1.2%
‒ Demand has been primarily driven by China’s rapidly growing steel production
‒ China represents 71% of international demand for seaborne iron ore in 2019 1400
• Outlook for iron ore is underpinned by China given the large market share, key
observations on the outlook: 1200
‒ demand from China of iron ore has rapidly rebounded post COVID-19
1000
lockdowns, with the resumption in industrial production
‒ long-term while demand from China is expected to continue to grow, this 800
growth is expected to be slower than that experienced during the last decade
‒ China’s aging population and the slowing rate of urbanization are expected to 600
be major influences on the long-term demand for seaborne iron ore
• Developing countries e.g. India, Indonesia and Vietnam, have experienced rapid 400
growth in economic activity over the past decade
200
‒ continued growth from developing countries has the potential to favourably
impact long term demand
0
2015 2016 2017 2018 2019 2020
Source: Wood Mackenzie, Iron Ore Markets and Asset Rev iew, June 2020. China Japan Other Asia Europe RoW
38.Iron ore market outlook – Supply
Supply commentary Global seaborne iron ore supply
• Seaborne iron ore supply is heavily concentrated with the top four major producers Mt
CAGR
representing approximately 70% and two countries contributing 80% of supply: 1800
1.3%
Supply by producer (2019) Supply by country (2019) 1600
1400
Rio
Tinto Other
Other
23% 19% 1200
29%
Brazil Australia 1000
Vale 22% 58%
FMG
19% 800
12%
BHP
18% 600
• Some of the major factors that are expected to influence the long-term supply include: 400
‒ continued strong Australian production 200
‒ the stabilisation and recovery of Brazilian production; and
0
‒ the potential development of large scale projects outside of current production 2015 2016 2017 2018 2019 2020
regions e.g. the Simandou deposit in Guinea Australia Brazil South Africa Canada Sweden RoW
Source: Wood Mackenzie, Iron Ore Markets and Asset Rev iew, June 2020.
39.Appendix E:
Subsection
TitleRisks
Key Description
40.Key risks associated with an investment in Deterra Royalties
Some of the key risks associated with an investment in Deterra include:
• Fluctuations in commodity prices (particularly, iron ore) and foreign exchange rates • Political events
• Exposure to sales volumes • Changing expectations with respect to ESG standards
• Third parties control operations and development of mining assets • Deterra’s counterparty risk
• Operating risks for underlying mining assets • Access to information regarding the operation of Deterra’s royalties
• Access to infrastructure and provision of third party services • Disputes
• Environmental, heritage and native title impacts • MAC Royalty concentration
• Ability to access future growth opportunities • Accidents or incidents
• Licences and permits • Financial risks
• Climate risks • Ongoing employee attraction and retention
• Government regulations
(1) See Section 2.15 of the Demerger Booklet for a description of these and other risk factors associated with an investment in Deterra shares.
41.You can also read