Use of near-infrared luminescent gold nanoclusters for detection of macrophages
←
→
Page content transcription
If your browser does not render page correctly, please read the page content below
Use of near-infrared luminescent gold
                 nanoclusters for detection of
                 macrophages

                 Veronika Sapozhnikova
                 Brian Willsey
                 Reto Asmis
                 Tianyi Wang
                 James Travis Jenkins
                 Jacob Mancuso
                 Li Leo Ma
                 Roman Kuranov
                 Thomas E. Milner
                 Keith Johnston
                 Marc D. Feldman

Downloaded From: https://www.spiedigitallibrary.org/journals/Journal-of-Biomedical-Optics on 11 Nov 2020
Terms of Use: https://www.spiedigitallibrary.org/terms-of-use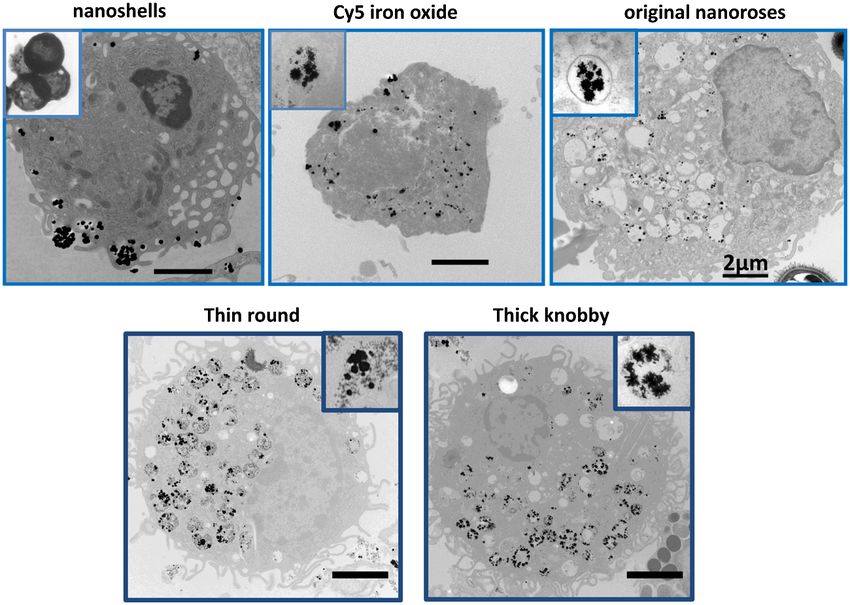
Journal of Biomedical Optics 17(2), 026006 (February 2012)

                Use of near-infrared luminescent gold nanoclusters for
                detection of macrophages
                Veronika Sapozhnikova,a Brian Willsey,b Reto Asmis,c Tianyi Wang,d James Travis Jenkins,e Jacob Mancuso,e Li Leo Ma,b
                Roman Kuranov,f Thomas E. Milner,g Keith Johnston,b and Marc D. Feldmanh
                a
                  University of Texas Health Science, Center at San Antonio, Departments of Medicine and Pathology, 7703 Floyd Curl Drive, San Antonio, 78229 Texas
                b
                  University of Texas at Austin, Department of Chemical Engineering, 1 University Station C0400, Austin, 78712 Texas
                c
                  University of Texas Health Science, Center at San Antonio, Departments of Clinical Laboratory Sciences and Biochemistry,
                7703 Floyd Curl Drive, San Antonio, 78229 Texas
                d
                  University of Texas at Austin, Department of Biomedical Engineering, 1 University Station, C0800, Austin, 78712-1084 Texas
                e
                  University of Texas Health Science, Center at San Antonio, Department of Medicine, 7703 Floyd Curl Drive, San Antonio, 78229 Texas
                f
                  University of Texas Health Science, Center at San Antonio, Department of Ophthalmology, 7703 Floyd Curl Drive, San Antonio, 78229 Texas
                g
                  University of Texas at Austin, Institute for Cellular and Molecular Biology, Department of Biomedical Engineering,
                BME 1.108F, 1 University Station, C0800, Austin, 78712-1084 Texas
                h
                  University of Texas Health Science, Center at San Antonio, South Texas Veterans Health Care System, Department of Medicine,
                7703 Floyd Curl Drive, San Antonio, 78229 Texas

                              Abstract. We determined the effect of aggregation and coating thickness of gold on the luminescence of
                              nanoparticles engulfed by macrophages and in gelatin phantoms. Thin gold-coated iron oxide nanoclusters
                              (nanoroses) have been developed to target macrophages to provide contrast enhancement for near-infrared optical
                              imaging applications. We compare the brightness of nanoroses luminescent emissions in response to 635 nm laser
                              excitation to other nanoparticles including nanoshells, nanorods, and Cy5 conjugated iron oxide nanoparticles.
                              Luminescent properties of all these nanoparticles were investigated in monomeric and aggregated form in gelatin
                              phantoms and primary macrophage cell cultures using confocal microscopy. Aggregation of the gold nanoparticles
                              increased luminescence emission and correlated with increased surface mass of gold per nanoparticle (nanoshells
                              37  14.30 × 10⁻³ brightness with 1.23 × 10⁻⁴ wt of gold (g)/nanoparticle versus original nanorose 1.45  0.37 ×
                              10−3 with 2.10 × 10⁻¹⁶ wt of gold/nanoparticle, p < 0.05). Nanoshells showed greater luminescent intensity than
                              original nanoroses or Cy5 conjugated iron oxide nanoparticles when compared as nanoparticles per macrophage
                              (38  10 versus 11  2.8 versus 17  6.5, p < 0.05, respectively, ANOVA), but showed relatively poor macrophage
                              uptake (1025  128 versus 7549  236 versus 96; 000 nanoparticles∕cell, p < 0.05, student t-test nanoshells ver-
                              sus nanoroses). Enhancement of gold fluorescent emissions by nanoparticles can be achieved by reducing the
                              thickness of the gold coating, by clustering the gold on the surface of the nanoparticles (nanoshells), and by cluster-
                              ing the gold nanoparticles themselves. © 2012 Society of Photo-Optical Instrumentation Engineers (SPIE). [DOI: 10.1117/1.JBO.17.2.026006]
                              Keywords: nanoparticles; imaging; luminescence spectroscopy; biophotonics.
                              Paper 11377 received Jul. 17, 2011; revised manuscript received Nov. 25, 2011; accepted for publication Dec. 13, 2011; published
                              online Mar. 7, 2012.

                1     Introduction                                                                 including surface plasmon resonance (SPR), photostability,
                Fluorescent dyes are useful tools for detecting protein and ima-                   tuning to the near infrared (NIR), and low-toxicity. Any recent
                ging protein interactions in cells. However, fluorescent dyes can                  concerns about gold toxicity have been related to the surface
                generate reactive oxygen species (ROS) during illumination, are                    coating,6,7 and not to the gold itself. The SPR reflectance wave-
                susceptible to photobleaching, and at times provide insufficient                   length of small (4 to 40 nm) spherical pure gold nanoparticles
                signal to noise ratios in cell culture.1,2 One solution has been                   when unaggregated and exposed to white light is 510 to 530 nm.
                semiconductor crystals (quantum dots), which have a higher                         Forming small aggregates of gold nanoparticles increases the
                brightness and photostability, a high quantum yield, and high                      scattering cross section per particle, shifting the plasmon reso-
                extinction coefficients. Unfortunately, quantum dots have poten-                   nance reflectance frequency to the NIR. Nanorods under white
                tial cell toxicity depending on multiple factors including size,                   light exposure also have reflectance in the NIR due to high
                charge, concentration, and type of coating,3 which restricts                       aspect ratios.6 These properties of gold nanoparticles have
                their application for in vivo studies.4 Recently developed bio-                    many applications in biology and medicine.7–9
                compatible magneto-fluorescent silica quantum dots show                               Gold nanoparticles also possess fluorescent properties. Bulk
                potential for biomedical application,5 although there is little                    gold material has a weak fluorescent signal with a low quantum
                data on their toxicity in vivo and in vitro.                                       yield of 10−10 (Ref. 10). However, small gold nanoparticles and
                    Pure gold nanoparticles are a promising material for                           nanoclusters (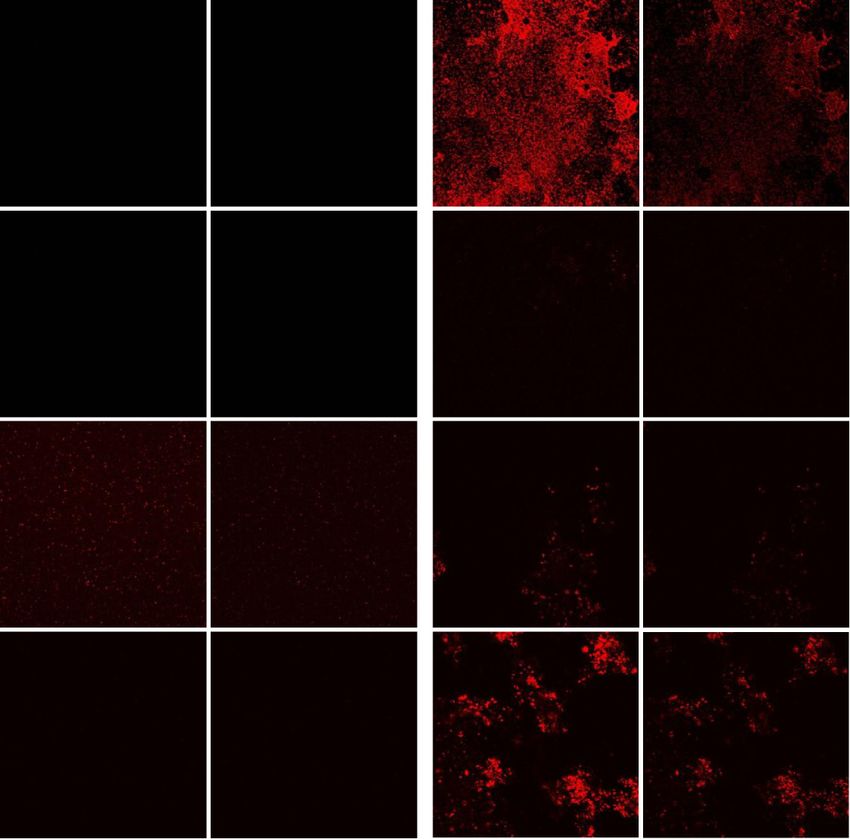
Sapozhnikova et al.: Use of near-infrared luminescent gold nanoclusters for detection of macrophages

                the mechanism can be distinguished from SPR and Raman                              from MP Biomedicals LLC. (Solon, OH). mPEG-SH was
                emission.14 Small gold nanoclusters less than 1 to 2 nm in dia-                    purchased from Nanocs, Inc. (New York, NY).
                meter and consisting of 25 gold atoms have also been shown to                          Original nanorose (thin knobby) synthesis and characteriza-
                produce emissions with quantum yields as high as 6%.11 These                       tion were performed as described previously.18 Additional
                nanoparticles show promise for in vivo identification of tissue-                   nanoroses of varying size and gold composition (thin round
                based macrophages, however, their small size makes them                            and thick knobby) were prepared. Iron oxide nanoclusters synth-
                unpractical due to first-pass removal by the liver, providing                      esis was performed by a modification of the method described
                insufficient time for uptake by macrophages in vulnerable                          by Sahoo.21 These nanoclusters were dispersed in deionized
                atherosclerotic plaques.17                                                         water with vigorous stirring to produce 100 ml of a
                    Recently, we developed gold nanoclusters (nanoroses) that                      0.1-mg Fe∕ml dispersion. To adjust the pH to 9.3, 320 μL of
                are composed of iron oxide clustered cores coated with a                           7% by weight ammonium hydroxide was added for different
                thin layer of gold, resulting in a rough surface topography.18                     initial pH values, corresponding lower amounts of ammonium
                Nanoroses are 30 nm in size and possess a dextran coating                          hydroxide were added to the reaction mixture. Two milliliters of
                to maximize uptake by macrophages via mannose receptors.                           1% (w∕v) hydroxylamine hydrochloride was added as the redu-
                Their small size allows nanoroses to avoid rapid clearance by                      cing agent for the Au precursor. Four mg∕ml methoxylPEG-SH
                the reticulo-endothelial system, providing sufficient time in                      (PEG MW 20,000) solution was added to provide steric stabi-
                the circulation for the particles to enter atherosclerotic lesions                 lization. Two milliliters of HAuCl4 solution (2.5 mg Au∕ml)
                and be engulfed by macrophages in these plaques. Further,                          was added to the reaction mixture to obtain an Au3þ ∕Fe
                nanoroses are biodegradable due to their cluster chemistry,                        mass ratio of 0.5 in all cases. From visual observation, the
                and nontoxic due to their composition of inert substances                          color of the initial iron oxide dispersion was brown and did
                including iron oxide and gold, implying the potential for clinical
                                                                                                   not change for a few seconds after addition of the Au precursor.
                applications.
                                                                                                   Next, the dispersion became slightly turbid, and the color
                    In the present study, we focus on the observation that clus-
                                                                                                   rapidly changed to greenish-brown. When the color change
                tering enhances the luminescence of gold.12,13,19 Further, we
                                                                                                   to greenish-brown started, the reactions were quenched with
                determine the effect of aggregation, coating thickness, and dis-
                                                                                                   1% nitric acid down to a pH of below 6 to ensure minimal
                tribution of gold on the luminescence of nanoparticles. To this
                                                                                                   further nucleation. The solution was allowed to stand with con-
                end, the luminescent behavior of nanoroses aggregated in gel
                phantoms and macrophage cells are investigated. Luminescence                       stant stirring for half an hour to allow time for further mPEG-SH
                properties of nanoroses are compared to leading gold nanopar-                      reaction with the surface of Au coatings. The reaction mixture
                ticles published in the literature, including nanorods,14 and                      was then centrifuged at 6000 rpm for 6 min to separate the
                nanoshells,20 as well as to nanoroses of varying size and gold                     Au-coated particles from the uncoated iron oxide particles.
                composition (thin knobby—original nanorose versus thin                             The precipitates were redispersed by using 1 ml of dilute
                round and thick knobby). As a control fluorescent nanoparticle,                    mPEG-SH solution (0.2 mg∕ml) and bath-sonicated for five min-
                Cy5 conjugated iron oxide nanoparticles are also studied.                          utes to produce a colloidally stable suspension. Basic differences
                                                                                                   in synthesis of thin knobby (original nanoroses), thin round and
                                                                                                   thick knobby are presented in Table 1. Basic characterization
                2     Materials and Methods                                                        of different iron oxide-gold nanoclusters presented in Table 2.
                2.1     Nanoparticle Synthesis and Characterization
                2.1.1    Nanoroses                                                                 2.1.2    Nanoshells

                All reagents were of analytical grade. Ferrous chloride, ammo-                     Nanoshells were purchased from NanospectraBiociences
                nium hydroxide, hydroxylamine hydrochloride, nitric acid, and                      (Houston, TX) and consisted of 120-nm diameter silica cores
                sodium hydroxide were purchased from Fisher Chemicals                              coated with 15-nm–thick gold shells, the later composed of 1
                (Fairlawn, NJ). Ferric chloride was purchased from Acros                           to 2 nm gold spheres covering the surface. The concentration
                Organics (Morris Plains, NJ). Citric acid was purchased from                       used was 2.6 × 10¹¹ particles in ml. The nanoshells were synthe-
                EM Science (Gibbstown, NJ). HAuCl4 trihydrate was purchased                        sized using the seed-mediated method of Duff et al.22

                                     Table 1 Basic differences in synthesis of thin knobby (original nanoroses), thin round, and thick knobby.

                Type of                     Primary iron         Primary iron                                                       Gold addition         Gold-Coated
                nanoroses                    oxide size         oxide stabilizer      Gold reduction           pH conditions          method            cluster stabilizer

                Thin round                45 nm cluster              Citrate         Hydroxylamine         Initially at 9.3,       Single addition        PEG thiol
                Thick Knobby              of 5 nm particles                          Hydrochloride         quenched to 6.0         of entire amount     (20,000 MW)
                                                                                     (NH2 OH · HCl)        after turbidity onset
                                                                                                           Initially at 7.0

                Thin knobby               20 nm cluster             Dextran          Hydroxylamine         Initially at 9.3,       Gold is added            Dextran
                (original nanoroses)      of 5 nm particles                          Hydrochloride         pH maintained           over 4 iterations,   (10,000 MW)
                                                                                     (NH2 OH · HCl)        above 8.0 using         10 min. between         and PVA
                                                                                     and Glucose           Ammonium hydroxide      each iteration        (5,000 MW)

                Journal of Biomedical Optics                                              026006-2                                           February 2012   •   Vol. 17(2)

Downloaded From: https://www.spiedigitallibrary.org/journals/Journal-of-Biomedical-Optics on 11 Nov 2020
Terms of Use: https://www.spiedigitallibrary.org/terms-of-use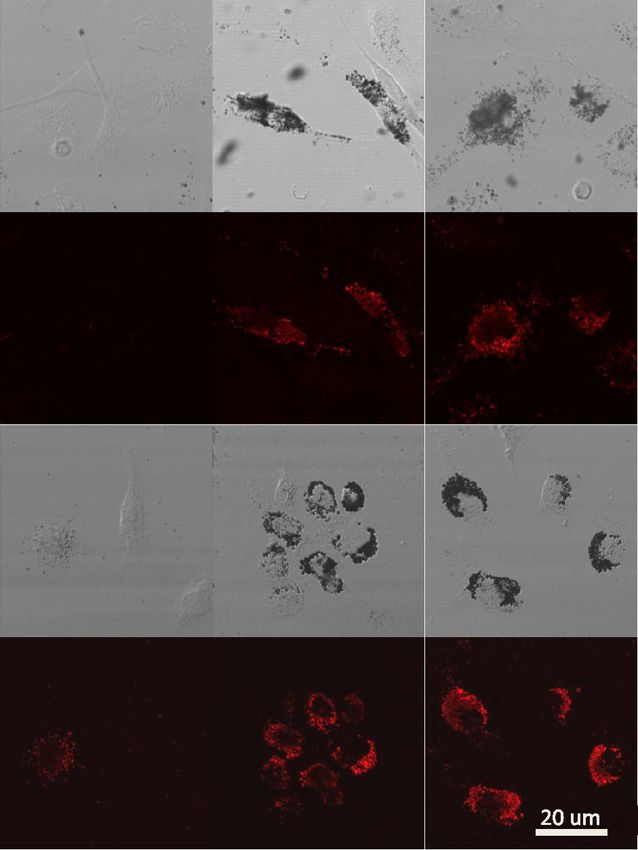
Sapozhnikova et al.: Use of near-infrared luminescent gold nanoclusters for detection of macrophages

                                                    Table 2 Characterization of different iron oxide-gold nanoclusters (nanoroses).

                                              Au/Fe initial          UV-VIS maximum             Au/PEG-SH initial              Weight gold per                      Dynamic light
                Type of nanoroses              mass ratio            Absorbance (nm)            ratio (mole/mole)             nanoparticle, g, Au                scattering size (nm)

                Thin round                        0.25                      600                            6.3                     3.1 × 10⁻¹⁶                      179  15.5

                Thick knobby                      0.50                      850                        12.6                        6.8 × 10⁻¹⁵                        54  2.4

                Thick knobby                      0.63                      700                      Dextran                       2.1 × 10⁻¹⁶                        35  1.5
                (original nanoroses)

                2.1.3    Nanorods/750                                                                 For TEM analysis peritoneal macrophages were isolated
                                                                                                   from the mice as previously described, placed in Teflon-coated
                The nanorods purchased from Nanopartz, Inc. (Loveland, CO),                        Petri dishes (Welch Fluorocarbon, NH) with DMEM (Sigma,
                were pure gold 23.5 nm × 7.3 nm in size. The concentration                         MO) with 10% FCS (Hyclone, Logan, UT), 2 mM L-glutamine,
                used was 1.65 × 10¹³ particles per ml, and they were synthe-                       penicillin (50 U∕ml), and streptomycin (100 μg∕ml).Macro-
                sized using the method developed by Jana.23                                        phages were grown on Teflon dishes for two to three days
                                                                                                   (Lab Tek, Rochester, NY) at 37°C and 5% CO2 before addition
                2.1.4    Nanorods/600                                                              of nanoparticles. Nanoparticles were added in a concentration of
                                                                                                   3 × 10⁻⁹ particles per plate for 24 h. Before fixation cells were
                The nanorods purchased from Nanopartz, Inc. (Loveland, CO),                        placed in 4°C for 1 h and after macrophages detached they were
                were pure gold 25 × 45 nm in size. The concentration used was                      fixed with a mixture of 2.5% glutaraldehyde, 2% (para)formal-
                5.2 × 10¹¹ particles, or 235 ppm.                                                  dehyde in 100 mM cacodylate buffer (pH 7.0) with 2 mM CaCl2
                                                                                                   by mixing equal volumes of fixative and cell suspension for two
                2.1.5    Cy5 labeled iron oxide nanoparticles                                      days at 4°C. Cells were postfixed with 1% OsO4 in 0.1 M PB for
                                                                                                   1 h, washed several times with PBS, and dehydrated and
                Cy5 labeled iron oxide nanoparticles were purchased from                           embedded in epoxi-resin. Macrophage imaging was performed
                Nanocs, Inc. (New York, NY), ranging in size from 25 to                            with transmission electron microscopy (TEM) using a Philips
                35 nm, at a concentration of 5 mg∕ml.                                              208 S system with digital imaging system. Determination of
                                                                                                   the number of nanoparticles per macrophage is described in
                2.2     Phantom Study                                                              the Supplementary section.
                Gel phantoms (G9382, Sigma) were composed of 50% gelatin
                and deionized (DI) water. Nonaggregated nanoparticles were                         2.4       Optical and TEM Imaging
                dispersed in DI water with gelatin at a concentration                              Luminescence was detected with an Olympus IX FV1000 con-
                1.2 × 10¹¹ nanoparticles per ml. Aggregated nanoparticles in                       focal microscope with a spectral scanning system, employing a
                phantoms were prepared from pellets of gold nanoparticles                          2 mW diode laser with excitation wavelength of 635 nm. Laser
                after overnight incubation with highly saturated NaCl solutions.                   light was focused and collected with a UPLSAPO objective,
                Gold nanoparticles were mixed with 50% gelatin in a hot-water                      60 × oil, and numerical aperture (NA) 1.46. Light was delivered
                bath (60°C) to prepare final concentrations of 1.2 × 10¹¹ nano-                    to the sample with an 80∕20 beam splitter. Spectral lumines-
                particles (for both aggregated and nonaggregated), and 25 μL of                    cence profiles were collected between 600 and 800 nm, with
                gel with nanoparticles were cover slipped on a glass microscopic                   2 nm resolution. For visualization of luminescence from differ-
                slide, air-dried overnight, and imaged the following day.                          ent types of nanoparticles, 0.4 mW laser power was used due to
                                                                                                   the high signal produced by the nanoshells. For visualization of
                2.3     Peritoneal Macrophage Cell Culture Study                                   different types of nanorose, 2 mW laser power was used. Finally,
                                                                                                   for differential interference contrast (DIC), images were col-
                Nanoparticles were evaluated in primary peritoneal macro-                          lected in transmittance mode, while luminescence images
                phage cultures harvested from C57/blk6 mice. Isolation of                          were recorded in reflectance mode.
                macrophages was performed as described.24,25 After isolation
                macrophages were grown in Dulbecco’s modified Eagle’s med-
                                                                                                   2.5       Determination of the Number of Nanoparticles
                ium, DMEM (Sigma, MO) with 10% FBS (Hyclone, Logan,
                                                                                                             per Macrophage
                UT), 2 mM L-glutamine, penicillin (50 U∕ml), and streptomy-
                cin (100 μg∕ml).Macrophages were grown on dual chamber                             A slightly modified formula26 was applied to transform the two-
                slide for two to three days (Lab Tek, Rochester, NY) at 37°C                       dimensional (2-D) TEM determination of the number of nano-
                and 5% CO2 before the addition of nanoparticles. Nanoparticles                     particles per macrophage, to a three-dimensional (3-D) volume.
                were incubated at 3 × 10⁻⁹ nanoparticles per well for 24 h at 37°                  Given a 2-D TEM image, the diameter of the section (d) will be
                C. For time-course studies, macrophages were incubated with                        much more than the average distance between nanoparticles (L).
                nanoparticles for 1, 4, and 24 h followed by washing with                          We can calculate the average distance between nanoparticles as:
                PBS 5×, fixation with 4% formaldehyde, and sealing of the                                         qffiffiffiffiffiffiffiffiffiffiffiffiffiffiffiffiffiffiffiffiffiffiffiffi
                coverslip with Fluoromount (Sigma-Aldrich, Saint Luis, MO)                                                pffiffiffiffi             pffiffiffiffiffiffiffiffiffi            pffiffiffiffi
                before imaging.                                                                              L¼    S∕ð N − 1Þ ≈ S∕N ;                      for     N ≫ 1;          (1)

                Journal of Biomedical Optics                                              026006-3                                                       February 2012   •   Vol. 17(2)

Downloaded From: https://www.spiedigitallibrary.org/journals/Journal-of-Biomedical-Optics on 11 Nov 2020
Terms of Use: https://www.spiedigitallibrary.org/terms-of-use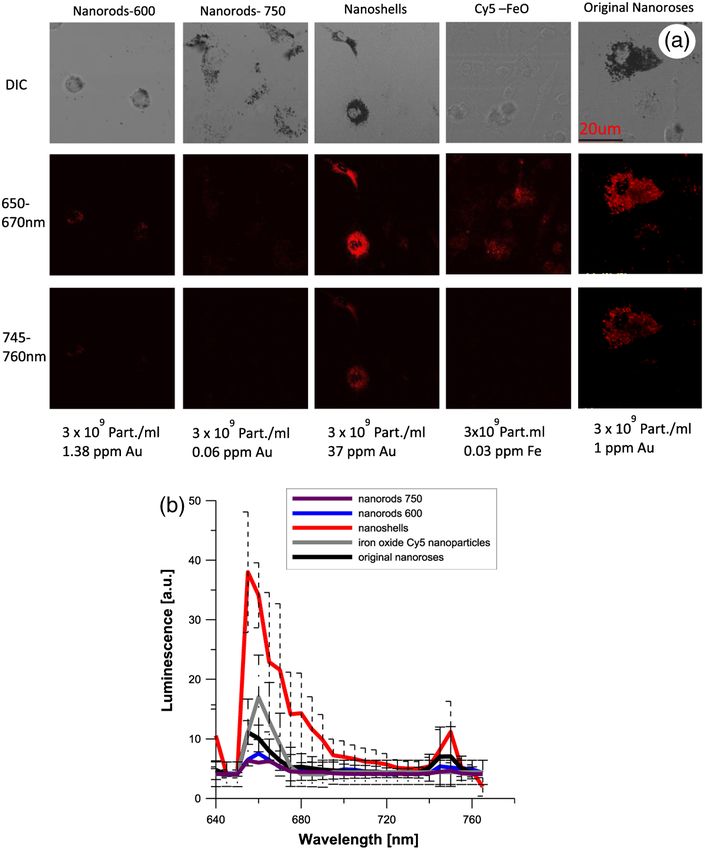
Sapozhnikova et al.: Use of near-infrared luminescent gold nanoclusters for detection of macrophages

                where N is the number of particles in the macrophage and S                         600 and 800 nm wavelengths were collected for analysis. The
                is the macrophage cross-sectional area.                                            extinction spectra for all nanoparticles are shown in Fig. 1, with
                    If we employ a spherical configuration,S ¼ π4 d2 , then Eq. (1)                typical phantom results shown in Fig. 2.
                can be rewritten:                                                                     No emission peaks were observed when the nanoroses were
                                                 rffiffiffiffi                                             dispersed in the gelatin in a nonaggregated state (n ¼ 5). How-
                                               d π                                                 ever, two emission peaks were observed at 650 to 670 nm and
                                          L¼           ;                        (2)                745 to 760 nm (n ¼ 5) when the nanoroses were aggregated
                                               2 N
                                                                                                   prior to embedding into the gelatin. The first emission peak
                and the volume of the macrophage is given as:                                      detected at 650 to 670 nm was stronger than the second peak
                                              π                                                    at 745 to 760 nm.
                                      V cell ¼ d 3 ;                                    (3)           Next, we compared the luminescent properties of nanoroses
                                              6
                                                                                                   with other commercially available gold nanoparticles of varying
                where d is the macrophage diameter. The volume that                                coating thickness and composition, including nanoshells, and
                one nanoparticle will occupy, given spherical symmetry, is                         nanorods with either a maximal extinction at 600 nm (nanor-
                as follows:                                                                        ods/600) orat 750 nm (nanorods/750). The extinction spectra
                                                                                                   of these nanoparticles are shown in Fig. 1. Nanorods/600 and
                                                π 3   d3 π 5∕2                                     nanoshells produced the same two peaks of luminescence at
                                        VL ¼      L ¼          .                        (4)        the same wavelengths as nanoroses (n ¼ 5, Fig. 2). Further,
                                                6     48N 3∕2
                                                                                                   nanoshells have the same two fluorescent peaks without aggre-
                The number of the nanoparticles in a single macrophage can                         gation (n ¼ 5). Nanorods/750 with an extinction maximum
                be written as:                                                                     away from the excitation frequency of 635 nm did not produce
                                                                                                   luminescence when analyzed in a colloid state, but were weakly
                                                   V cell 8N 3∕2                                   luminescent when aggregated.
                                        N cell ¼         ¼ 3∕2 :                        (5)
                                                   VL      π
                                                                                                   3.2                    Studies of Nanoparticles Engulfed
                   The number of nanoparticles per macrophage were deter-                                                 by Macrophages
                mined by averaging results from n ¼ 20 macrophages per
                each type of nanoparticle.                                                         To examine the impact of gold aggregation in a biological
                                                                                                   system, nanoparticles were examined after uptake by macro-
                2.6     Statistical Analysis                                                       phages. Typical results are shown in Fig. 3(a) and quantitative
                                                                                                   results are shown in Fig. 3(b). All gold nanoparticles that
                ANOVA and paired t-tests were performed with the SPSS                              aggregated within macrophages demonstrated the same two
                software package, version 13.0. Differences were considered                        luminescent emission peaks as in the gelatin phantom studies.
                as statistically significant when the p-value was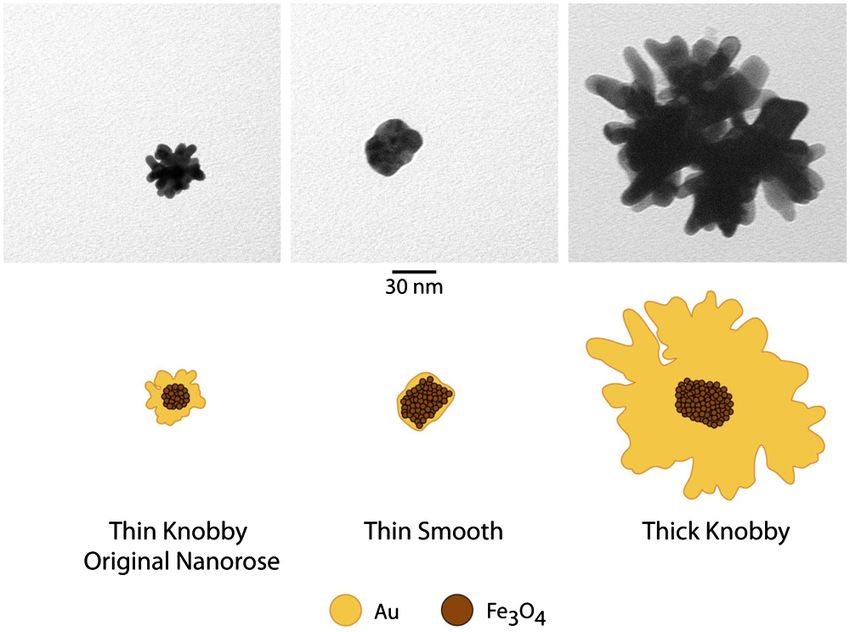
Sapozhnikova et al.: Use of near-infrared luminescent gold nanoclusters for detection of macrophages
Fig. 2 Phantom studies of nanoparticles. Two peaks of luminescence with confocal of nonaggregated and aggregated gold nanoparticles are shown.
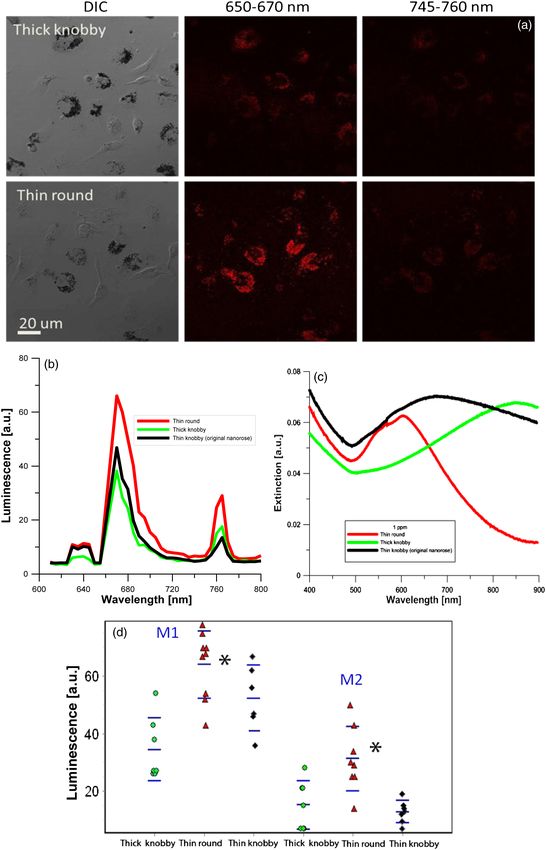
an emission wavelength of 650 to 670 nm Cy5 conjugated iron larger size, nanoshells localized in the cytoplasm close to the
oxide nanoparticles produced approximately 1.5-fold the signal cell plasma membrane, while the smaller original nanoroses
intensity of original nanoroses, but did not have the second and Cy5 conjugated iron oxide nanoparticles were located
luminescent peak at 745 to 760 nm we observed for other within deeper cellular structures. For original nanoroses, 7549
gold nanoparticles. Nanorods/600 and nanorods/750 both pro- 236 particles/macrophage was determined, whereas nanoshells
duced two luminescent peaks, but the intensity of both peaks were less concentrated in macrophages (1025 128 particles/
were weak and half that measured for original nanoroses. macrophage). For Cy5 conjugated nanoparticles and Cy5 mole-
Despite being tuned to the excitation frequency of 635 nm, cules, published values of 96,000 and 288,000, respectively,
nanorods/600 were not superior to nanorods/750, because were used per macrophage.27
nanorods/600 do not have a surface coating that is as ideal The luminescence intensity per macrophage at 650 to 670 nm
for cellular uptake. In contrast, Nanorods/750 are coated with emission was greatest for nanoshells, followed by Cy5 conju-
polyethylene glycol (PEG), which does not prevent uptake by gated nanoparticles and Cy5 molecules, followed by original
macrophages in culture. Due to the weakness of the lumines- nanoroses (Table 3, p < 0.05). Further, the brightness per nano-
cence of both nanorods, they were not included in the quanti- particle or molecule was greatest for nanoshells, followed by
tative comparison of nanoparticles presented in the next section. original nanorose, and was less for Cy5 conjugated nanoparti-
cles, and least for Cy5 molecules (Table 3). These results are
consistent with the interpretation that luminescence increases
3.3 Luminescent Intensity of Nanoparticles when gold nanoparticles cluster because the overall surface
of gold per nanoparticle increases (weight of gold per nanopar-
To determine the impact of differing morphologies of surface ticle was greater for nanoshells compared to original nanoroses).
gold on luminescence, the relative luminescent intensities of However, when the brightness per gram of material was com-
the two brightest gold nanoparticles (nanoshells and nanoroses) pared, the fluorescent dyes were more intense than nanoshells
were compared in a more quantitative fashion to Cy5 conjugated and original nanoroses, the intensity for the latter two being
nanoparticles (Table 3).The average number of nanoparticles per similar (Table 3).
macrophage was determined by counting individual nanoparti-
cles identified by transmission electron microscopy (TEM) with
Image J. Twenty macrophages were analyzed per type of nano- 3.4 Time-Dependent Uptake of Nanoshells
particles, and the mean results are presented. Because Cy5 con- and Original Nanoroses by Macrophages
jugated nanoparticles and Cy5 molecules are below the
resolution of TEM, the number of these nanoparticles and mole- To further verify that gold nanoparticles gain luminescence
cules per macrophage was taken from the literature.27 after clustering, confocal imaging was performed to follow
Figure 4 shows the typical appearance of nanoparticles’ the accumulation of nanoshells and original nanoroses inside
accumulation and distribution inside macrophages. Due to their macrophages over time. Macrophages were incubated with
Journal of Biomedical Optics 026006-5 February 2012 • Vol. 17(2)
Downloaded From: https://www.spiedigitallibrary.org/journals/Journal-of-Biomedical-Optics on 11 Nov 2020
Terms of Use: https://www.spiedigitallibrary.org/terms-of-useSapozhnikova et al.: Use of near-infrared luminescent gold nanoclusters for detection of macrophages
Fig. 3 (a). Confocal images of various near-infrared nanoparticles in macrophages cell culture. Gray upper panels are differential interference
contrast microscopy images (DIC) of macrophages, and two red lower panels represent luminescent images at two wavelengths at 650
to 670 and 745 to 760 nm. Second emission at 745 to 760 nm was not observed from Cy5 iron oxide nanoparticles. (b). The calculated luminescence
intensity profile from n ¼ 20 macrophages/each nanoparticles, shows that nanoshells produced a signal approximately four times stronger than
original nanoroses.
Table 3 Luminescent intensity of nanoshells, original nanoroses, and Cy5 iron oxide nanoparticles and molecules.
Nanoparticles Luminescent intensity Weight material Brightness Brightness per nanoparticle
Sample per macrophage per macrophage, a. u. per nanoparticle, g per g of material (molecule) ×10−3
Nanoshell 1025 128c 38 10.0d 1.23 × 10⁻¹⁴ b (Au) 3.00 × 10¹² (Au) 37.00 14.30d
Original nanorose 18
7549 236 11 2.8 2.10 × 10⁻¹⁶ (Au) 6.90 × 10¹² (Au) 1.45 0.37
Cy-5 iron oxide 96,000a 1.01 × 10⁻¹⁷ FeO 1.75 × 10¹³ FeO 0.18 0.07
nanoparticles
Cy-5 molecules 2,88,000a 17 6.5 1.32 × 10⁻²¹ Cy5 4.47 × 10¹⁶ Cy5 0.06 0.02
a
Based on Ref. 27.
b
Based on Ref. 20.
c
Students t test significant at level p < 0.05.
d
ANOVA, p < 0.05. The laser power was reduced to 0.4 mW due to the brightness of the nanoshells.
Journal of Biomedical Optics 026006-6 February 2012 • Vol. 17(2)
Downloaded From: https://www.spiedigitallibrary.org/journals/Journal-of-Biomedical-Optics on 11 Nov 2020
Terms of Use: https://www.spiedigitallibrary.org/terms-of-useSapozhnikova et al.: Use of near-infrared luminescent gold nanoclusters for detection of macrophages
Fig. 4 Typical TEM images of different nanoparticles accumulated in a representative macrophage.
nanoparticles and examined after 1, 4, and 24 h (Fig. 5). After 4 h, DIC imaging suggested that both nanoparticles had
After the first hour of incubation, DIC imaging revealed been internalized by macrophages, and there was a marked
no evidence of intracellular nanoparticles. Consistent with increase in the corresponding luminescence brightness. Similar
the phantom studies, individual nanoshells demonstrated results were obtained after 24 h, with greater visible lumines-
luminescence without clustering, while the original nanorose cence intensity per macrophage for nanoshells compared to
did not. original nanoroses, as quantified in Table 3.
Fig. 5 Time-dependent accumulation of original nanoroses and nanoshells in macrophages.
Journal of Biomedical Optics 026006-7 February 2012 • Vol. 17(2)
Downloaded From: https://www.spiedigitallibrary.org/journals/Journal-of-Biomedical-Optics on 11 Nov 2020
Terms of Use: https://www.spiedigitallibrary.org/terms-of-useSapozhnikova et al.: Use of near-infrared luminescent gold nanoclusters for detection of macrophages
due to PVA, dextran, citric acid, and/or PEG. The more gold
on the surface of the nanoroses, the greater the NIR shift.
All three nanorose extinction spectra tune to the NIR, with
maximal extinction for thin round at 600 nm, thin knobby
(original nanorose) at 700 nm, and thick knobby at 850 nm.
As shown in Fig. 7 and Table 6, thin round and the original
nanoroses (thin knobby) were taken up similarly by macro-
phages (6032 719 versus 7549 236), but thick knobby to
a lesser extent, 2643 337 (p < 0.05, ANOVA). All three
nanoroses demonstrated similar peaks of luminescent emissions
at 650 to 670 and 745 to 760 nm but different intensity (Fig. 7).
Figures 7(b) and 7(d) compare the relative luminescence
of the three nanoroses, and demonstrates that the thinner
consistent gold shell of the thin round generated greater
luminescence intensity than the thick knobby with the greatest
mass of gold per nanorose nanoparticle, or the thin knobby
(original nanorose) with variation in the thin gold coating
Fig. 6 The upper panel are TEM images of typical original nanoroses (p < 0.05, ANOVA). Thick knobby produces less luminescence
(thin knobby, left); thin round (middle) and thick knobby (right). The because 1. there are fewer per macrophage (2643 337 versus
lower panel is a schematic drawing of composition and relative size
7549 236—thin knobby—and 6032 719—thin round), and
of the nanoroses.
2. their extinction maximum was farthest from the excitation
wavelength of 635 nm. In contrast, the extinction maximum
3.5 Luminescence of Different Nanoroses with of thin round has been tuned to 600 to 650 nm, which coincides
Varying Gold and Ironoxide Composition with laser excitation wavelength.
To determine if the luminescence of the original nanorose could
be enhanced by altering the consistency of the gold coating and 4 Discussion
its thickness, two sister nanoparticles were synthesized and The major findings of the current study include: 1. two peaks of
examined. Representative drawings of the three different luminescent emission in response to excitation by a 635 nm laser:
nanoroses are shown in Fig. 6, and their characterization and 650 to 670 and 745 to 760 nm, the first peak similar to Cy5 fluor-
synthesis is compared in Tables 4 and 5. Descriptive names escent dye, and the second peak not observed with Cy5 and spe-
for these nanoparticles include thin knobby for the original cific to gold; 2. nanoshells produce luminescent signal without
nanorose, thin round for the more consistent thin gold coating, clustering due top re-existing clustered gold on the surface of
and thick knobby for the increased gold mass. Specifically, thin each nanoparticle, while nanoroses and nanorods produce lumi-
knobby (original nanorose) consists of more densely packed nescence only if clustered in gels and macrophages; 3 per gram of
5-nm iron oxide clusters with a variable gold coating. Thin material, brightness of original nanoroses (thin knobby) and
round has a less densely packed iron oxide core and surface nanoshells are similar, but Cy5 conjugated nanoparticles are
deposition of a more consistent thin layer of gold, coated an order of magnitude brighter; 4. per nanoparticle, nanoshells
with 20 kDa PEG. Thick knobby contains the greatest mass are 25 times brighter than original nanoroses, but the nanoroses
of gold per nanoparticle of the nanoroses, has a similar density are eight times brighter than Cy5 conjugated nanoparticles; and 5.
of 5-nm iron oxide clusters to the thin round, and with a dia- greater gold luminescence is present when increased gold mass
meter of 179 16 nm, is the largest nanorose. Thick knobby per nanoparticle is clustered on the surface (nanoshells) and when
is also coated with 20 kDa PEG polymer in contrast to the thinning of the nanorose gold coating in a consistent manner (thin
original nanorose, which is coated with dextran. The NIR round) is achieved.
shift and single photon luminescent signal is due to the gold There appears to be a contradiction between two conclu-
coating, and not the iron oxide core or its density, and not sions: greater gold luminescence is achieved when increased
Table 4 Differences in synthesis of thin knobby (original nanoroses), thin round and thick knobby.
Primary iron Primary iron Gold addition Gold-coated
Type of nanoroses oxide size oxide stabilizer Gold reduction pH conditions method cluster stabilizer
Thin round 45 nm cluster Citrate Hydroxylamine Initially at 9.3, quenched Single addition PEG thiol
Thick Knobby of 5 nm particles Hydrochloride to 6.0 after turbidity of entire amount (20,000 MW)
(NH2 OH · HCl) onset Initially at 7.0 of gold
Thin knobby 20 nm cluster Dextran Hydroxylamine Initially at 9.3, pH Gold is added over Dextran
(original nanoroses) of 5 nm particles Hydrochloride maintained above 4 iterations, 10 min. (10,000 MW)
(NH2 OH · HCl) 8.0 using Ammonium between each iteration and PVA
and Glucose hydroxide (5,000 MW)
PEG-SH—thiol reactive polyethilenglycol, PVA—poly vinyl alcohol, and MW–molecular.
Journal of Biomedical Optics 026006-8 February 2012 • Vol. 17(2)
Downloaded From: https://www.spiedigitallibrary.org/journals/Journal-of-Biomedical-Optics on 11 Nov 2020
Terms of Use: https://www.spiedigitallibrary.org/terms-of-useSapozhnikova et al.: Use of near-infrared luminescent gold nanoclusters for detection of macrophages
Table 5 Characterization of different iron oxide-gold nanoclusters (nanoroses).
Au/Fe initial UV-VIS maximum Au/PEG-SH initial Weight gold per Dynamic light
Type of nanoroses mass ratio extinction (nm) ratio (mole/mole) nanoparticle, g, Au scattering size (nm)
Thin knobby 0.25 850 6.3 3.1 × 10⁻¹⁶ 179 15.5
Thin round 0.50 600 12.6 6.8 × 10⁻¹⁵ 54 2.4
Thin Knobby 0.63 700 Dextran 2.1 × 10⁻¹⁶ 35 1.5
(original nanoroses)
gold mass per nanoparticle is clustered on the surface (nano- nanoparticles examined both per nanoparticle and when
shells) and when thinning of the nanorose gold coating in a engulfed in macrophages. However, nanoshells are so large
consistent manner (thin round) is achieved. However, closer that they are removed too quickly by the reticulo-endothelial
examination provides an explanation. First, the nanoshells’ system to allow prolonged residence in the circulation for pla-
surface is composed of a series of 1- to 2-nm spherical deposits que-based macrophage uptake. Thus, the ideal gold nanoparticle
of gold, which itself is a clustering of gold. Second, the would have a symmetrically clustered, consistent gold surface
increased luminescence is not due to the increased mass of similar to nanoshells, but a reduced diameter per nanoparticle
gold per se, but rather the organization of the surface gold. of 30 to 50 nm. The size reduction will allow adequate time
For instance, thick knobby nanorose has the highest mass of in the circulation following intravenous injection for uptake
gold among the nanoroses, but had the same brightness per by plaque-based macrophages, to enhance aggregation and
nanoparticle as thin round nanoroses. Complicating these con- luminescence signal above the background noise of the free
clusions is that luminescent brightness is, in part, dependent nanoparticles that remain in the bloodstream.
upon the wavelength of maximum extinction of the nanopar- Cy5 conjugated iron oxide nanoparticles have an order of
ticles. The inability of thick knobby to increase its lumines- magnitude greater uptake by macrophages than nanoroses.
cence is also due, in part, to its maximum absorption being However, Cy5 has a single emission frequency of 650 to
shifted further away from the excitation wavelength of 670 nm, which will be problematic because other plaque com-
635 nm, toward the NIR (maximum at 850 nm). The enhance- ponents, such as Lipofuscinand red blood cells, themselves
ment of luminescence observed for the nanoroses when the maybe competing materials (although this issue could also be
gold surface coating was thinned in a symmetrical fashion resolved with Cy7 or other 800 nm dyes). Thus, the second
(thin round) was an unexpected finding. emission peak at 745 to 760 nm unique to gold will be important
The mechanism of luminescence with the first observed both for identification of nanoparticles in intact tissues and,
emission maximum (650 to 670 nm) can be explained by inter- ultimately, in application to patients with vulnerable plaques.
band transitions of free electrons,14,15 the amplitude of which is Further, one Cy5 conjugated iron oxide nanoparticle produced
proportional to the size of spherical nanoparticles.1,28 Lumines- less luminescence than a single original nanorose (Table 3). The
cence in the visible wavelength range (500 to 700 nm) has been similar brightness of both the Cy5 conjugated nanoparticle and
previously observed from smooth and rough surfaces of noble original nanorose per macrophage is explained by the improved
metal films.15 The mechanism underlying the second observed uptake of the Cy5 conjugated nanoparticle compared to
emission with a maximum at 745 to 760 nm is likely due to an nanoroses (Table 3). However, increasing the number of Cy5
intraband electron transition,14,15 which is dependent upon molecules on a single iron oxide nanoparticle, which has
aggregation of gold, a mechanism distinct from that for the three, has not been accomplished to date. In contrast, gold
650 to 670 emission. An alternative explanation for the nanoroses and nanoshells offer greater flexibility because
second peak, based upon investigations with nanorods, is they can be tuned to enhance optical properties, including
metal–molecule charge-transfer interaction.14 We believe that reflectance, luminescence efficiency, and SPR absorption
our observation of two distinct emission peaks for gold nano- peak, by altering how the gold is deposited on the surface of
particles is a novel finding. For instance, Beversluis et al. the nanoparticle.
(Ref. 15) excited 15 nm gold tips at 390 nm and observed Another advantage nanoroses and nanoshells have over
fluorescence from visible to the NIR, but did not observe Cy5 conjugated iron oxide nanoparticles is their photostability
two distinct peaks.15 under laser excitation. Cy5 is known to photobleach.29
Gold nanoclusters (nanoroses) have been developed by our Resistance of gold nanoparticles in cells or in phantoms to
group to target macrophages with the goal of providing contrast photobleaching was first reported by He and Zhang.1,13 We con-
enhancement for NIR optical imaging applications. The ultimate firmed the photostability of nanoroses using the photobleaching
goal is the identification of macrophages in plaque because mode of the Zeiss (510NLO Axiovert 200) confocal micro-
increased macrophage content in advanced lesions is associated scope, and were unable to detect any loss of fluorescent signal
with plaques prone to rupture and increase risk of heart attacks from nanoroses in macrophage culture over weeks of time.
and strokes. Of all the nanoparticles examined, the one that There were several limitations to the current study. First,
has the greatest clinical applicability is the thin round nanorose, nanorods/600 did not possess a coating that would enhance
due to its combination of a symmetrical gold surface and ideal macrophage uptake. Thus, their poor performance in lumines-
size. Nanoshells have the greatest luminescence of all gold cence brightness in macrophage culture [Figs. 3(a) and 3(b)]
Journal of Biomedical Optics 026006-9 February 2012 • Vol. 17(2)
Downloaded From: https://www.spiedigitallibrary.org/journals/Journal-of-Biomedical-Optics on 11 Nov 2020
Terms of Use: https://www.spiedigitallibrary.org/terms-of-useSapozhnikova et al.: Use of near-infrared luminescent gold nanoclusters for detection of macrophages
Fig. 7 Comparison of the three varieties of nanoroses. (a) DIC and confocal images of the thick knobby and thin round in macrophage culture,
with original nanorose (thin knobby) shown in Figs. 3 and 5. (b) Quantitative comparison of luminescence intensity of the three nanoroses, average
spectrum from Fig. 7(d). (c) Extinctionspectrum of thin round, thick knobby and thin knobby (original nanoroses). (d) Maximum luminescence
from individual experiments in A. M1 firstluminescence peak at 650 to 670 nm, M2 is the second luminescence peak at 745 to 760 nm.
p < 0.05.
Journal of Biomedical Optics 026006-10 February 2012 • Vol. 17(2)
Downloaded From: https://www.spiedigitallibrary.org/journals/Journal-of-Biomedical-Optics on 11 Nov 2020
Terms of Use: https://www.spiedigitallibrary.org/terms-of-useSapozhnikova et al.: Use of near-infrared luminescent gold nanoclusters for detection of macrophages
Table 6 Luminescent intensity of different types of nanoroses.
Nanoparticles Luminescent intensity Weight gold per Brightness Brightness per
Sample per macrophage per macrophage, a. u. nanoparticle, g per g of gold nanoparticle ×10−3
Thin knobby 7549 236 46.7 16 2.1 × 10⁻¹⁶ 2.9 × 10¹³ 6 1.9
(original nanoroses)
Thin round 6032 719 66.6 16a 3.1 × 10⁻¹⁶ 3.5 × 10¹³ 11 1.3
Thick knobby 2643 337a 38.0 12 6.8 × 10⁻¹⁵ 2.0 × 10¹² 14 2.7
Laser power of 2 mW was utilized resulting in greater brightness of original nanoroses compared to Table 3.
a
The difference is significant using ANOVA, p < 0.05.
yet excellent brightness in the phantoms may be due, inpart, 6. D. P. Lyvers et al., “Gold nanorod arrays as plasmonic cavity
to insufficient uptake. Second, the size of both the Cy5 resonators,” ACS Nano. 2(12), 2569–2576 (2008).
7. J. M. Nam, S. I. Stoeva, and C. A. Mirkin, “Bio-bar-code-based
conjugated iron oxide nanoparticles and the Cy5 molecules
DNA detection with pcr-like sensitivity,” J. Am. Chem. Soc. 126(19),
were below the resolution of our TEM. Thus, we were unable 5932–5933 (2004).
to determine the number of these particles/molecules in cultured 8. S. Kumar et al., “Plasmonic nanosensors for imaging intracellular
macrophages. Instead, the literature was used for these biomarkers in live cells,” Nano. Lett. 7(5), 1338–1343 (2007).
determinations, which does not include a standard deviation. 9. S. Kumar, J. Aaron, and K. Sokolov, “Directional conjugation of
Our statistical comparisons with nanoshells, and the nanoroses antibodies to nanoparticles for synthesis of multiplexed optical contrast
were, thus, limited to student t-tests, which prevented the use of agents with both delivery and targeting moieties,” Nat. Proto. 3(2),
314–320 (2008).
more robust statistical comparisons such as ANOVA. Finally, 10. A. Mooradia, “Photoluminescence of metals,” Phys. Rev. Lett. 22(5),
the high luminescence of nanoshells is causing them to be visi- 185–187 (1969).
ble whereas the others nanoparticles are not bright enough—and 11. J. Xie, Y. Zheng, and J. Y. Ying, “Protein-directed synthesis of highly
not necessarily luminescent only on clustering. fluorescent gold nanoclusters,” J. Am. Chem. Soc. 131(3), 888–889
In conclusion, enhancement of gold luminescent emission (2009).
per macrophage relevant for improving contrast in NIR 12. C. T. Yuan et al., “Single fluorescent gold nanoclusters,” Opt. Express
17(18), 16111–16118 (2009).
optical imaging applications can be achieved by reducing the
13. J. Zhang, Y. Fu, and J. R. Lakowicz, “Luminescent images of single
thickness of the gold coating in a consistent manner, tuning gold nanoparticles and their labeling on silica beads,” Opt. Express
the maximum extinction of the nanoparticle to the stimulating 15(20), 13415–13420 (2007).
laser wavelength, or clustering the gold on the surface of 14. S. Eustis and M. El-Sayed, “Aspect ratio dependence of the enhanced
the nanoparticles (nanoshells), or by clustering the gold fluorescence intensity of gold nanorods: experimental and simulation
nanoparticles themselves. study,” J. Phys. Chem. B. 109(34), 16350–16356 (2005).
15. M. R. Beversluis, A. Bouhelier, and L. Novotny, “Continuum
Acknowledgments generation from single gold nanostructures through near-field mediated
intraband transitions,” Phys. Rev. B. 68(11), 1154331–11543310
The authors would like to thank Hunter Barbara for assistance (2003).
with TEM imaging and cell culture processing. Confocal images 16. S. Eustis and M. A. El-Sayed, “Why gold nanoparticles are more
were generated in the Core Optical Imaging Facility, which is precious than pretty gold: noble metal surface plasmon resonance
supported by UTHSCSA, NIH-NCI P30 CA54174 (CTRC at and its enhancement of the radiative and nonradiative properties of
nanocrystals of different shapes,” Chem. Soc. Rev. 35(3), 209–217
UTHSCSA) and NIH-NIA P01AG19316.The current study
(2006).
was supported by Veterans Administration Merit Grant, and 17. H. S. Choi et al., “Renal clearance of quantum dots,” Nat. Biotechnol.
NIH NRSA Grant #HL07446. 25(10), 1165–1170 (2007).
18. L. L. Ma et al., “Small multifunctional nanoclusters (nanoroses) for tar-
geted cellular imaging and therapy,” ACS Nano. 3(9), 2686–2696
References (2009).
1. H. He, C. Xie, and J. Ren, “Nonbleaching fluorescence of gold 19. Z. Jian et al., “Fluorescence spectrum properties of gold nanochains,”
nanoparticles and its applications in cancer cell imaging,” Anal. Phys. E: Low-dimensional Syst. Nanostruct. 25(1), 114–118
Chem. 80(15), 5951–5957 (2008). (2004).
2. S. W. Tsai, Y. Y. Chen, and J. W. Liaw, “Compound cellular imaging of 20. C. Loo et al., “Nanoshell-enabled photonics-based imaging and therapy
laser scanning confocal microscopy by using gold nanoparticles and of cancer,” Tech. Can. Res. Treat. 3(1), 33–40 (2004).
dyes,” Sensors 8(4), 2306–2316 (2008). 21. Y. Sahoo et al., “Aqueous ferrofluid of magnetite nanoparticles:
3. R. Hardman, “A toxicologic review of quantum dots: toxicity fluorescence labeling and magnetophoretic control,” J. Phys.
depends on physicochemical and environmental factors,” Environ. Chem. B. 109(9), 3879–3885 (2005).
Health Perspect. 114(2), 165–172 (2006). 22. D. G. Duff, A. Baiker, and P. P. Edwards, “A new hydrosol of gold
4. L. W. Zhang and N. A. Monteiro-Riviere, “Mechanisms of quantum clusters .1. Formation and particle-size variation,” Langmuir 9(9),
dot nanoparticle cellular uptake,” Toxicol. Sci. 110(1), 138–155 2301–2309 (1993).
(2009). 23. N. R. Jana, L. Gearheart, and C. J. Murphy, “Seed-mediated growth
5. F. Erogbogbo et al., “Biocompatible magnetofluorescent probes: approach for shape-controlled synthesis of spheroidal and rod-like
luminescent silicon quantum dots coupled with superparamagnetic gold nanoparticles using a surfactant template,” Adv. Mater. 13(18),
iron(iii) oxide,” ASC Nano. 4(9), 5131–5138 (2010). 1389–1393 (2001).
Journal of Biomedical Optics 026006-11 February 2012 • Vol. 17(2)
Downloaded From: https://www.spiedigitallibrary.org/journals/Journal-of-Biomedical-Optics on 11 Nov 2020
Terms of Use: https://www.spiedigitallibrary.org/terms-of-useSapozhnikova et al.: Use of near-infrared luminescent gold nanoclusters for detection of macrophages
24. B. Bennett, “Isolation and cultivation in vitro of macrophages 27. A. Moore, R. Weissleder, and A. Bogdanov, “Uptake of dextran-coated
from various sources in mouse,” Am. J. Pathol. 48(1), 165–181 monocrystalline iron oxides in tumor cells and macrophages,” JMRI
(1966). 7(6), 1140–1145 (1997).
25. E. Davenas, B. Poitevin, and J. Benveniste, “Effect on mouse peritoneal- 28. S. Klein et al., “Quantitative visualization of colloidal and intracellular
macrophages of orally-administered very high dilutions of silica,” gold nanoparticles by confocal microscopy,” J. Biomed. Opt. 15(3),
Eur. J. Pharm 135(3), 313–319 (1987). 0360151–03601511 (2010).
26. J. Lucocq, “Quantitation of gold labelling and antigens in immunola- 29. C. Y. Deng, J. M. Li, and W. Y. Ma, “Detection of fret efficiency in imaging
belled ultrathin sections,” J. Anat. 184(Pt. 1), 1–13 (1994). systems by photo-bleaching acceptors,” Talanta 82(2), 771–774 (2010).
Journal of Biomedical Optics 026006-12 February 2012 • Vol. 17(2)
Downloaded From: https://www.spiedigitallibrary.org/journals/Journal-of-Biomedical-Optics on 11 Nov 2020
Terms of Use: https://www.spiedigitallibrary.org/terms-of-useYou can also read