Spectroscopic Evaluation of Red Blood Cells of Thalassemia Patients with Confocal Microscopy: A Pilot Study - MDPI
←
→
Page content transcription
If your browser does not render page correctly, please read the page content below
sensors
Letter
Spectroscopic Evaluation of Red Blood Cells of
Thalassemia Patients with Confocal Microscopy:
A Pilot Study
Laura Rey-Barroso 1, *, Mónica Roldán 2,3 , Francisco J. Burgos-Fernández 1 ,
Susanna Gassiot 3,4 , Anna Ruiz Llobet 5 , Ignacio Isola 3,4 and Meritxell Vilaseca 1
 1    Centre for Sensors, Instruments and Systems Development, Technical University of Catalonia,
      08222 Terrassa, Spain; francisco.javier.burgos@upc.edu (F.J.B.-F.); meritxell.vilaseca@upc.edu (M.V.)
 2    Unit of Confocal Microscopy, Service of Pathological Anatomy, Pediatric Institute of Rare Diseases,
      Hospital Sant Joan de Déu, 08950 Esplugues de Llobregat, Spain; mroldanm@sjdhospitalbarcelona.org
 3    Institute of Pediatric Research, Hospital Sant Joan de Déu, 08950 Esplugues de Llobregat, Spain;
      sgassiot@sjdhospitalbarcelona.org (S.G.); imisola@sjdhospitalbarcelona.org (I.I.)
 4    Laboratory of Hematology, Service of Laboratory Diagnosis, Hospital Sant Joan de Déu,
      08950 Esplugues de Llobregat, Spain
 5    Service of Pediatric Hematology, Hospital Sant Joan de Déu, 08950 Esplugues de Llobregat, Spain;
      aruizl@sjdhospitalbarcelona.org
 *    Correspondence: laura.rey.barroso@upc.edu; Tel.: +34-97-739-8905

 Received: 5 June 2020; Accepted: 15 July 2020; Published: 21 July 2020

 Abstract: Hemoglobinopathies represent the most common single-gene defects in the world and pose
 a major public health problem, particularly in tropical countries, where they occur with high frequency.
 Diagnosing hemoglobinopathies can sometimes be difficult due to the coexistence of different causes
 of anemia, such as thalassemia and iron deficiency, and blood transfusions, among other factors, and
 requires expensive and complex molecular tests. This work explores the possibility of using spectral
 confocal microscopy as a diagnostic tool for thalassemia in pediatric patients, a disease caused by
 mutations in the globin genes that result in changes of the globin chains that form hemoglobin—in
 pediatric patients. Red blood cells (RBCs) from patients with different syndromes of alpha-thalassemia
 and iron deficiency (including anemia) as well as healthy (control) subjects were analyzed under a
 Leica TCS SP8 confocal microscope following different image acquisition protocols. We found that
 diseased RBCs exhibited autofluorescence when excited at 405 nm and their emission was collected
 in the spectral range from 425 nm to 790 nm. Three experimental descriptors calculated from the
 mean emission intensities at 502 nm, 579 nm, 628 nm, and 649 nm allowed us to discriminate between
 diseased and healthy cells. According to the results obtained, spectral confocal microscopy could
 serve as a tool in the diagnosis of thalassemia.

 Keywords: red blood cells; thalassemia; spectroscopy; confocal microscopy; spectral imaging;
 autofluorescence

1. Introduction
     Red blood cells (RBCs) are specialized cells in charge of oxygen transportation throughout the
body. They contain a tetramer called hemoglobin that is able to bind oxygen and carbon dioxide
molecules. Healthy RBCs have a biconcave shape with an average volume of 90 to 95 µm3 and great
deformation capacity when passing through capillaries of the circulatory system. Due to defects in
genetic information coding for RBCs, their shape, number, and deformability can be altered, as well
as their capacity to transport oxygen in the blood. In thalassemia, mutations in the globin genes

Sensors 2020, 20, 4039; doi:10.3390/s20144039                                      www.mdpi.com/journal/sensors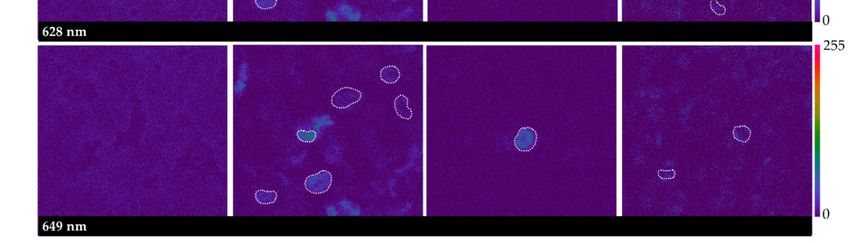
Sensors 2020, 20, 4039                                                                               2 of 13

result in a quantitative reduction in the rate of synthesis or the absence of globin chains which form
hemoglobin (alpha or beta-thalassemia) [1]. Clinical manifestations of thalassemia syndromes range
from no symptoms in asymptomatic carriers to serious abnormalities that include severe anemia,
extramedullary hematopoiesis, skeletal and growth deficits and iron overload, with a significantly
shortened life expectancy in the absence of treatment. The severity of the clinical features correlates
with the number of functioning globin genes that are lost [2]. Iron deficiency is the other major cause
of microcytic anemia besides thalassemia, and this can be associated with a markedly abnormal RBC
morphology, including hypochromic/microcytic cells, as in the more severe forms of thalassemia.
      The diagnosis of thalassemia is based on RBC morphology under conventional optical microscopy
and RBC indices, which consist of estimating the levels of adult hemoglobin A1 (HbA), its variant
hemoglobin A2 (HbA2), and fetal hemoglobin (HbF), which are most frequently determined by
automated high-performance liquid chromatography [3]. These techniques are sometimes not
sufficiently specific enough to distinguish between mild and minor forms of the disease, which show no
symptoms or very mild symptoms and have similar blood hemoglobin and corpuscular volume values;
additionally, thalassemia can also be confused with other causes of anemia such as iron deficiency.
Therefore, complex and expensive genetic studies are often required to diagnose individuals with
this disease, because although they remain asymptomatic, even if the parents have a mild form, their
offspring can be affected with severe forms.
      Authors have analyzed RBCs under experimental and commercial spectroscopic systems with the
aim of overcoming the limitations of traditional techniques. To date, research studies have attempted
to establish reflectance, emission and/or absorption differences in the ultraviolet (UV), visible (VIS)
and near infrared (NIR) ranges between healthy and unhealthy RBCs. These techniques were shown
to be useful for automatizing blood cell classification since they showed different spectral signatures.
Akuwudike et al. [4] used spectral absorbance to distinguish sickle cell hemoglobin from normal
adult hemoglobin, evaluating the range from 250 nm to 650 nm. Gunasekaran et al. [5] proved that
there are statistically significant optical density differences in the UV and VIS ranges (200–700 nm)
between RBCs of patients with leukemia, anemia, liver cirrhosis, thalassemia and diabetes with respect
to healthy individuals. To better understand the variability and determinants of oxygen affinity
on a cellular level, Di Caprio et al. [6] designed a microfluidic chip to illuminate RBCs with blue
and red light-emitting diodes (LEDs). Blue light was used to differentiate between oxygenated and
deoxygenated hemoglobin, and red light was employed for cell volume quantification. Liu et al. [7]
proved that the infrared (IR) response revealed changes in the secondary structure of hemoglobin
from beta-thalassemic patients compared to controls. Alsalhi et al. [8] used a spectrofluorometer
for the spectral detection of thalassemia in a preliminary study. They observed two peaks in the
autofluorescence emission of RBCs at 580 nm and 630 nm, mostly due to the basic and neutral forms of
porphyrin—a type of nitrogenous biological pigment that forms the heme group. In order to better
discriminate between thalassemia and iron deficiency anemia, Devanesan et al. [3] identified and
quantified a certain set of fluorescent metabolites in blood samples of subjects affected by these diseases.
Nevertheless, in all of the aforementioned studies, the spectral differences that may underlie different
clinical presentations of thalassemia (especially mild forms) were not reported. This might be due to a
lack of spectral differences, in the case of asymptomatic forms, or because none of these studies made
use of imaging sensors; therefore, the integrated spectroscopic information provided is not sufficiently
spatially accurate to reveal such differences.
      The use of spectral imaging improves RBC analysis since it adds spatial resolution to spectroscopic
data. Dai et al. [9] used a molecular hyperspectral imaging system to identify blood cells. This system
was developed according to a push-broom approach and covered the VIS and NIR ranges (400–860 nm);
spectral pattern traits and similarity measures were obtained from the background, red cells,
lymphocytes, nuclei, and plasma of tumor cells. Conti et al. [10] made use of hyperspectral dark field
microscopy to measure the scattering spectra of RBCs from 400 nm to 1700 nm. The analyses were
carried out with a hyperspectral microscope equipped with a high-power halogen lamp, and eight
Sensors 2020, 20, 4039 3 of 13
spectral signatures were identified for RBC molecular components. Kurtuldu et al. [11] developed
a hyperspectral microscope based on a liquid crystal tunable filter to analyze RBCs and detect by
image classification the different elements in a cell from 420 nm to 730 nm. Robison et al. [12]
designed a snapshot hyperspectral system capable of capturing several spectral bands simultaneously
(419–494 nm) by combining a commercial snapshot system and a microscope. They found that white
blood cell features were most prominent in the 428 nm to 442 nm band.
Other authors have analyzed RBCs under confocal microscopy, which, unlike traditional
microscopy, allows the sample to be scanned at different depths. Axial cuts of the sample contain
autofluorescence or reflectance information as well as the actual morphology of RBCs, which could
have numerous potential applications in the diagnosis of RBC diseases. For instance, reflectance
confocal microscopy (RCM) has been demonstrated to be useful for obtaining information about the
physiological properties of RBCs at high resolution and without the need for fluorescence labeling [13,14].
Golan et al. [13] combined RCM with flow cytometry, taking advantage of the unidirectional flow
of blood within small capillary vessels. Zeidan et al. [14] simulated and obtained actual reflectance
confocal images of RBCs in combination with flow cytometry to study their morphology and physiology.
Khairy et al. [15] obtained tridimensional (3D) confocal microscope images of RBCs labeled with
fluorescent dyes and compared them to mathematical simulations of the shapes by means of spherical
harmonic series expansions. Rappaz et al. [16] compared the morphological values obtained from
different imaging techniques, including confocal microscopy. In order to perform a volume assessment
of RBCs under confocal laser scanning microscopy (CLSM), cells were labeled with a fluorescent
dye and excited at 561 nm, and the emission was collected from 580 nm to 700 nm. Lima et al. [17]
made use of confocal microscopy in a more innovative way to measure individual RBC motions
through micro-vessels by combining the former imaging technique with a particle tracking velocimetry
system. Yakimov et al. [18] used fluorescence lifetime imaging microscopy, an imaging modality
implemented in confocal microscopy, to determine the biochemical state of white blood cells provided
by native fluorophores.
As can be inferred from the state-of-the-art approaches, the use of spectral imaging techniques
together with CLSM could provide simultaneous spectroscopic and 3D information about the
composition of functional molecular complexes or substances that characterize the metabolic state of
RBCs. Therefore, this approach can be a potential tool in diagnosing RBC diseases, providing more
data beyond an accurate representation of their morphology, as spectral information would also be
available. Then, RBCs could be studied by building 3D maps of the functional information of the cell,
collecting the reflectance, autofluorescence, or even fluorescence arising from the staining of different
cellular components with the use of extrinsic fluorescent probes.
The purpose of the present work is to analyze the spectral and morphological characteristics
of healthy and diseased RBCs—specifically RBCs from pediatric patients with thalassemia, under a
spectral confocal microscope, which is a powerful imaging instrument that has not yet exploited as a
diagnostic tool for RBC diseases. Spectral confocal microscopy allows the sequential study of the cell
structure and molecular components, which is very helpful in diagnosing RBC diseases, where the
isolated assessment of the cell shape is insufficient. In addition, blood samples from patients with iron
deficiency are also studied and compared to thalassemia samples.
2. Materials and Methods
2.1. Sample Preparation
The management of blood samples in confocal microscopy is somewhat special and has not often
been described in the literature. Therefore, in this work, we had to establish a protocol for loading blood
samples into the microscope, carefully choosing the container dish, anticoagulant agents, the time
for the samples to stabilize and the conditions inside the microscope cabin to perform live imaging.
Living RBCs are delicate structures that need to remain under the same conditions as inside the humanSensors 2020, 20, 4039 4 of 13
body in order to preserve their shape and molecular complexes. Therefore, neither the addition of
solvents, such as saline solution, nor the centrifugation of the sample to remove other cellular types
and components in blood was considered. Nevertheless, it was necessary to acquire spectral image
acquisition sequences over several areas or fields to reduce the variability that could be found within
the sample. This made the duration of the experiments to be relatively long so in order for RBCs
to remain unaltered, the addition of two frequently used anticoagulant agents, lithium heparin and
ethylenediaminetetraacetic acid (EDTA), was considered to avoid sample corruption. Lithium heparin
was found to be technically more suitable for the experimental assays, preserving the optical properties
of RBCs for a longer time.
Blood samples from 17 pediatric patients were evaluated, comprising 12 males and five females
between 1 and 17 years old, including patients with different forms of alpha-thalassemia, patients with
different degrees of iron deficiency and healthy individuals as controls. Samples were not labeled with
extrinsic fluorescent probes to avoid overlying spectral information. Since living cells move inside
their medium, the use of dishes with no coating to load samples would have made the selection of
cells during image post-processing significantly more difficult. Therefore, CELLview™ cell culture
dishes with four compartments (Greiner Bio One GmbH, Courtaboeuf, France), which incorporate a
cell-adhesion layer preventing the movement of cells during measurement, were used. Blood samples
were collected in tubes containing lithium heparin. RBC indices were analyzed using an ADVIA 2120i
hematology analyzer (Siemens Healthcare Diagnostics Inc., Erlangen, Germany) within 2 hours after
blood collection.
The study group consisted of eight healthy subjects, labeled TC1–TC8, including one patient with
HbH alpha-thalassemia (homozygous for a HbA2 c.*93_*94delAA mutation), which is considered
severe, labeled T1; a patient with alpha-thalassemia minor (Southeast Asian [SEA] heterozygous
deletion), identified as T2; and four asymptomatic alpha-thalassemia carriers (3.7 kb heterozygous
deletion), labeled T3–T6. In addition, the samples of the three patients suffering from different degrees
of iron deficiency were analyzed and labeled TA1–TA3. Samples were characterized in terms of the
amount of hemoglobin in the blood (Hb) in grams per deciliter (g/dL); the mean corpuscular volume
(MCV) in femtoliters (fL), which indicates the average size of RBCs; and mean corpuscular hemoglobin
(MCH) in picograms (pg), which quantifies the amount of hemoglobin per RBC. These RBC indices are
presented in Table 1 along with the average values for each study group. Patient T1 was evaluated
again one year after the initial analysis; these data are labeled T1_2.
Table 1. Indices for control, thalassemic, and iron-deficient patients: hemoglobin (Hb) in g/dL; medium
corpuscular volume (MCV) in fL; medium corpuscular hemoglobin (MCH) in pg.
Indices Hb (g/dL) MCV (fl) MCH (pg)
TC1 14.1 ± 0.32 87 ± 0.71 29.4 ± 0.42
TC2 11.8 ± 0.49 80 ± 1.77 26.9 ± 0.46
TC3 13.3 ± 0.03 89 ± 1.41 29.5 ± 0.46
TC4 13.7 ± 0.18 85 ± 0.00 28.5 ± 0.11
TC5 13.6 ± 0.14 83 ± 0.71 28.0 ± 0.07
TC6 13.3 ± 0.03 80 ± 1.77 26.7 ± 0.53
TC7 12.3 ± 0.32 88 ± 1.06 28.6 ± 0.14
TC8 13.5 ± 0.11 86 ± 0.35 28.2 ± 0.00
Mean 13.2 ± 0.00 85 ± 0.00 28.2 ± 0.00
T1 7.8 ± 1.17 68 ± 1.51 16.8 ± 2.08
T1_2 9.0 ± 0.72 75 ± 1.13 18.2 ± 1.55
T2 10.8 ± 0.04 63 ± 3.40 19.4 ± 1.09
T3 10.4 ± 0.19 74 ± 0.76 25.1 ± 1.06
T4 14.3 ± 1.29 74 ± 0.76 25.4 ± 1.17
T5 11.3 ± 0.15 75 ± 1.13 25.4 ± 1.17
T6 12.6 ± 0.64 78 ± 2.26 25.6 ± 1.24
Mean 10.9 ± 0.00 72 ± 0.00 22.3 ± 0.00
TA1 9.9 ± 0.69 81 ± 4.04 25.0 ± 0.98
TA2 12.9 ± 1.04 77 ± 1.73 26.0 ± 1.55
TA3 10.6 ± 0.29 65 ± 5.19 18.9 ± 2.54
Mean 11.1 ± 0.00 74 ± 0.00 23.3 ± 0.00Sensors 2020, 20, 4039 5 of 13
Approximately 200 µL of each blood sample was introduced in an adherent Petri dish and
mounted inside the cabin in the microscope for temperature and CO2 control in live imaging.
2.2. Spectral Confocal Imaging
The samples were analyzed under a Leica TCS SP8 confocal microscope with stimulated
emission depletion (STED) at 3× super resolution (Leica Microsystems GmbH, Mannheim, Germany),
equipped with a detection unit that allowed spectral discrimination using hybrid detectors.
These detectors are capable of detecting signals arising from RBCs from 400 nm to 790 nm.
The microscope incorporates two lasers for excitation, a diode laser with an emission of 405 nm
and a white laser that emits from 470 nm to 670 nm, combined with an acoustic-optic tunable filter
(AOTF). The imaging acquisition protocol followed for the confocal microscope to collect spectral traits
of RBCs corresponded to the emission (fluorescence) configuration. Preliminary experiments on the
reflectance configuration did not show differences between diseased and healthy cells, and consequently
this analysis was dropped.
To collect the spectral emission of RBCs produced by autofluorescence, a 63× (NA 1.4, oil)
plan-apochromatic objective was used. The confocal microscope could focus at several depths
within the volume of blood, where RBCs were clearly differentiated and displaced throughout the
sample, acquiring several fields to evaluate emission uniformity. The image format chosen was
400 pixels × 400 pixels using a four airy unit (AU) pinhole. Samples were excited at 405 nm with a
blue diode laser line and the AOTF was set at 65%. Emission images from 425 nm to 790 nm were
acquired with a spectral window of 20 nm and in steps of 7 nm in a so-called xyλ scanning sequence.
The variation in intensity of a particular spectral component, encoded using 8 bits, was represented on
the screen using a pseudo-color look-up table. Emission detection was performed at a galvanometric
bidirectional speed of 1000 Hz to avoid artefacts of cell movement and at the same time provide
sufficient exposure time to excite the sample at each point. The choice of wavelength can be critical
in cell discrimination. Greiner et al. [19] proved in a flow cytometry study that better discrimination
between RBC and white blood cell populations could be obtained at a shorter wavelength of 413 nm
compared to 488 nm. Similarly, the excitation wavelength of a 488 nm argon laser was also tested
in this work to excite the samples. However, no difference other than lower-intensity emissions
compared with the 405 nm excitation was observed. Accordingly, only the results from the experiments
with excitation at 405 nm are described below. The high sensitivity of the hybrid detectors allowed
us to amplify the low autofluorescence emission of RBCs and reduce the noise due to their higher
dynamic range.
Data from all studies were analyzed using the Leica Application Suite X (LAS X) software
(Leica Microsystems GmbH, Mannheim, Germany). This software allows the determination of spectral
signatures of different regions of interest (ROIs) within the imaged area of the sample (field) and
displays the mean intensity of all pixels for each ROI versus the wavelength. Between 10 and 20 areas
or fields over each sample were studied. Mean values of the selected ROIs within a field were obtained.
Numerical data were exported to a spreadsheet (Excel 2000; Microsoft Corp., Redmond, WA, USA).
The mean spectral emission intensity and standard error were calculated for all fields examined
and were expressed in arbitrary units (a.u.). The significance of differences in terms of the spectral
values collected at several wavelengths (from 425 nm to 790 nm in steps of 7 nm) were compared
among controls, patients with thalassemia and patients with anemia (by pairs) using an unpaired
Student’s t-test with statistical significance set at p = 0.05 (IBM SPSS Statistics for Windows, version 24.0;
IBM Corp., Armonk, NY, USA).
3. Results and Discussion
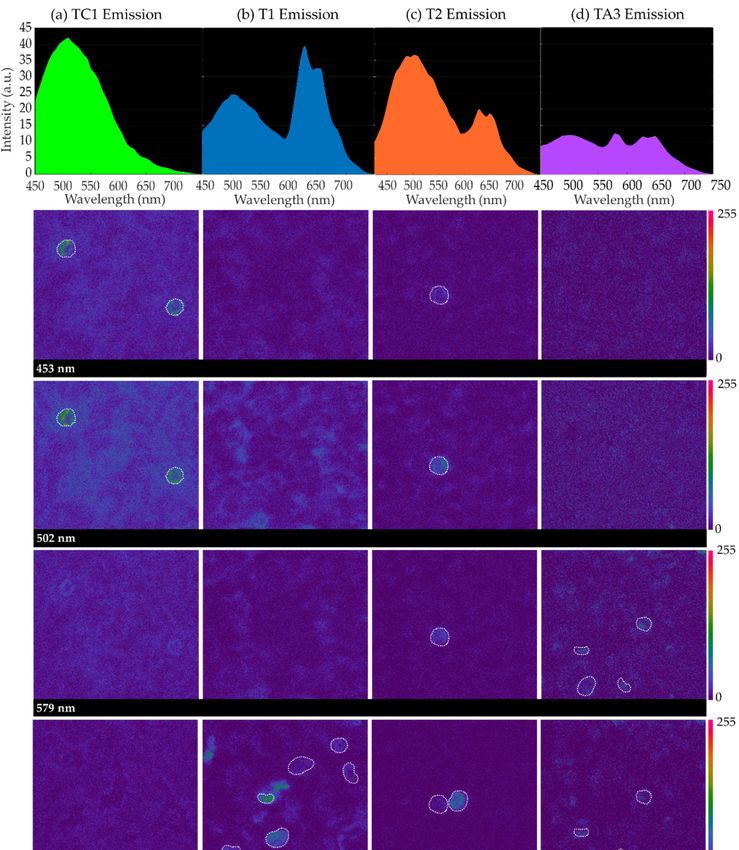
Figure 1 contains sequences of confocal emission images captured at different wavelengths
for some samples when excited at 405 nm: TC1 in the control group; T1 and T2 corresponding to
individuals with HbH alpha-thalassemia (severe) and SEA alpha-thalassemia (mild), respectively;Sensors 2020, 20, 4039 6 of 13
and TA3, corresponding to iron-deficiency anemia. For each sample, spectral emission images at
Sensors
453 nm, 5022020,
nm,20, x579
FORnm,
PEER628
REVIEW
nm, and 649 nm of a given imaged field are included, as well6 of 12
as the
average emission curves considering the cellular structures (RBCs, surrounded by a dashed white
emission curves considering the cellular structures (RBCs, surrounded by a dashed white contour,
contour, and neutrophils) that appeared to emit differently to the entire background of the samples.
and neutrophils) that appeared to emit differently to the entire background of the samples.
Figure 1. Intensity
Figure vs. vs.
1. Intensity wavelength
wavelength(top)
(top)and
andimages fromautofluorescence
images from autofluorescence of red
of red blood
blood cellscells (RBCs)
(RBCs)
(bottom) corresponding to 453 nm, 502 nm, 579 nm, 628 nm, and 649 nm wavelengths,
(bottom) corresponding to 453 nm, 502 nm, 579 nm, 628 nm, and 649 nm wavelengths, for the for the following
samples: (a) TC1,
following from (a)
samples: a control patient;
TC1, from (b) T1,
a control HbH(b)
patient; (severely
T1, HbHdiseased);
(severely (c) T2, SEA(c)heterozygous
diseased); T2, SEA
deletion; (d) TA3,deletion;
heterozygous from a (d)patient witha iron-deficiency
TA3, from anemia. It
patient with iron-deficiency can be
anemia. appreciated
It can that that
be appreciated cellular
cellular
structures structures
appear appear
brighter in brighter in T1,TA3.
T1, T2, and T2, and TA3.Sensors 2020, 20, 4039 7 of 13
It can be seen that, in all instances, there is a peak around 502 nm created by all sample emission,
background and cellular structures. Paying attention to the spectral images collected at 579 nm, 628 nm
and 649 nm, it can be inferred that, for samples corresponding to HbH disease (T1), SEA deletion (T2)
and iron deficiency (TA3), some cellular structures appear brighter. Sometimes, one of the latter peaks
of emission is greater than that at 502 nm (T1 and TA3). Specifically, in the case of iron-deficiency
anemia, the cells that appear brighter in the spectral image at 579 nm contribute to the average emission
curve, providing a prominent peak at this wavelength.
Emission images were captured for different areas of the samples where a sufficiently large
number of RBCs were visible. These cells were experimentally determined to emit differently than
the rest of the structures in the background, emitting more intensively at the longest wavelengths.
The populations of these cells were found to be especially high in the samples of the diseased groups
(HbH thalassemia, SEA thalassemia, thalassemia carrier and iron deficiency). In order to obtain a
general overview of the emission, circular regions of 4 µm were sketched on top of one to 10 RBCs as
ROIs on every field, depending on whether the sample had a higher or lower population number over
which the sequences of confocal images were captured. The selection of round-shaped neutrophils was
avoided, which were identified experimentally for their shape, larger size and very bright emission at
502 nm. Only spectral sequences in which cellular movement was relatively low were included in
the ROI emission analysis. Finally, T4 and TC2 were not included due to the insufficient number of
evaluated fields for their analysis.
The specific emission intensity values from 450 nm to 649 nm of some representative subjects are
included in Table 2; Figure 2 depicts the corresponding spectra as the average emission autofluorescence
of the aforementioned ROIs. In the spectrum, a common emission peak was observed around 502 nm,
although in some samples this could be shifted some nanometers above or below. In addition, samples
T1 (HbH), T2 (SEA heterozygous deletion) and all samples corresponding to iron deficiency (TAs)
showed higher emissions around 628 nm and 649 nm. The intensity of these three peaks was different
for all samples analyzed. Moreover, we observed that the number of RBCs with a different spectrum
than the background varied from one sample to another; control samples presented the most uniform
emission within blood structures.
Table 2. Average emission intensity (a.u.) at principal screening wavelengths and their associated
standard error, depending on variability of the spectrum within the selected regions of interest (ROIs)
and number of fields analyzed within the sample. Only data from some subjects of each group
are shown.
Wavelength (nm) 450 502 579 628 649
TC1 42.0 ± 13.0 58.8 ± 13.5 26.5 ± 3.5 9.5 ± 1.2 6.2 ± 0.8
TC5 30.2 ± 6.8 46.0 ± 11.6 26.6 ± 6.7 14.7 ± 3.7 11.8 ± 3.1
T1 13.5 ± 1.9 24.2 ± 3.3 12.6 ± 1.4 37.9 ± 7.8 31.6 ± 4.1
T1_2 7.6 ± 1.3 13.3 ± 2.6 8.7 ± 1.3 42.9 ± 4.0 20.3 ± 2.1
T2 6.5 ± 0.3 7.3 ± 0.8 5.2 ± 1.1 36.6 ± 12.5 37.9 ± 5.1
T5 12.8 ± 0.4 16.6 ± 0.7 9.7 ± 0.7 11.1 ± 2.3 8.5 ± 2.0
TA2 16.0 ± 0.6 15.7 ± 0.6 35.0 ± 4.9 36.9 ± 2.5 19.1 ± 1.3
TA3 9.6 ± 0.2 10.9 ± 0.2 16.9 ± 1.2 18.4 ± 1.3 19.2 ± 1.3
Studies using the state-of-the-art approaches have obtained similar emission spectra for normal
and diseased RBCs. We excited RBCs at around 400 nm, but according to Zheng et al. [20], hemoglobin
can also be two-photon excited at around 600 nm, and a very similar emission spectrum for healthy
RBCs to the one described in this work would be obtained. The common peak around 500 nm might
be produced by lipofuscins, lipofuscin like-lipids or retinoids, whose autofluorescence in terms of
their spectral shape and amplitude is related to senescence and oxidation degree [21]. Distinct and
well-defined bands beyond 600 nm are generally attributed to porphyrins and a heme-altered
metabolism. For instance, Liu et al. [7] detected a peak around 628 nm produced in the emission curvesSensors 2020, 20, 4039 8 of 13
of some samples, which was attributed to porphyrin. This compound is a nitrogenized biological
pigment whose derivative products include hemoproteins, which are made of a combination of
porphyrin, metals
Sensors 2020, 20, x FORand
PEERproteins.
REVIEW Porphyrin provides RBCs with their characteristic red color. 8Itofis12
thought that the amount of free porphyrin in blood is greater in patients suffering from alpha-thalassemia
characteristic
and red color.
iron-deficiency anemiaIt isthan
thought that the
in healthy amount of[22],
individuals free which
porphyrin in blood with
is consistent is greater in patients
the findings of
suffering from alpha-thalassemia and iron-deficiency anemia than in healthy individuals
our study. Stockman et al. [23] proved that free porphyrin in blood with iron-deficiency anemia was [22], which
is consistent
even with thewith
higher. Patients findings of our study.
protoporphyria Stockman
also present et al. [23]
similar proved
spectra to that free porphyrin
thalassemia, with thein most
blood
with iron-deficiency anemia was
prominent emission peak around 630 nm [24]. even higher. Patients with protoporphyria also present similar
spectra to thalassemia, with the most prominent emission peak around 630 nm [24].
(a) (b)
(c) (d)
Figure2.2.Intensity
Figure vs. vs.
Intensity wavelength (average
wavelength curves)
(average computed
curves) from autofluorescence
computed images ofimages
from autofluorescence samplesof
(a) TC1 and
samples (a)TC5
TC1(healthy
and TC5subjects);
(healthy (b) T1 and(b)
subjects); T1_2
T1 (HbH disease);
and T1_2 (HbH(c) T2 (SEA
disease); (c)heterozygous deletion)
T2 (SEA heterozygous
and T5 (3,7and
deletion) kb heterozygous deletion); (d)
T5 (3,7 kb heterozygous TA2 and
deletion); TA3
(d) (iron
TA2 anddeficiency).
TA3 (iron deficiency).
In
Inorder
ordertotoquantify
quantifythis
thisconcept,
concept,the
theratio
ratiobetween
betweenthe theintensity
intensityatatthe
thefirst
firstand
andsecond
secondemission
emission
peaks
peaks of 502 nm and 628 nm was calculated, as well as the ratio between peaks at 502and
of 502 nm and 628 nm was calculated, as well as the ratio between peaks at 502 nm nm 649
andnm.649
Innm.
addition, in order
In addition, in to account
order for the number
to account of RBCs of
for the number that werethat
RBCs found to emit
were foundwith
to aemit
special
withspectrum,
a special
selected
spectrum,as ROIs on as
selected each sample,
ROIs on eachwesample,
multiplied the ratios by
we multiplied thethe average
ratios number
by the averageofnumber
cells peroffield
cells
found for found
per field each, asforfollows:
each, as follows:
Ratio 1 = (I502 /I628 )·RBC, (1)
Ratio 1 = (I502/I628)∙RBC, (1)
Ratio 2 = (I502 /I649 )·RBC, (2)
Ratio 2 = (I502/I649)∙RBC, (2)
where Iλ is the intensity at different wavelengths and RBC is the average number of RBCs per field.
where Iλ is the intensity at different wavelengths and RBC is the average number of RBCs per field.
Table 3 shows that the higher the severity of alpha-thalassemia, the larger the calculated rates.
Mild and minor alpha-thalassemia individuals (T2, T3, and T6) showed intermediate values which
were slightly higher than those of control patients, while HbH alpha-thalassemia (T1 and T1_2) and
iron-deficient patients (TA1–TA3) in addition to T5—an alpha-thalassemia carrier—presented higher
intensity ratios. Therefore, a higher ratio seems to be associated with a greater severity of anemia. IfSensors 2020, 20, 4039 9 of 13
Table 3 shows that the higher the severity of alpha-thalassemia, the larger the calculated rates.
Mild and minor alpha-thalassemia individuals (T2, T3, and T6) showed intermediate values which
were slightly higher than those of control patients, while HbH alpha-thalassemia (T1 and T1_2) and
iron-deficient patients (TA1–TA3) in addition to T5—an alpha-thalassemia carrier—presented higher
intensity ratios. Therefore, a higher ratio seems to be associated with a greater severity of anemia. If an
additional ratio between the intensity recorded at 502 nm and 579 nm (prominent for iron deficiency)
is taken into account (Equation (3)), it becomes possible to differentiate iron-deficiency samples from
thalassemia samples (Table 3).
Ratio 3 = I502 /I579 (3)
Table 3. Averaged ratios for main emission peaks. Iλ : intensity at different wavelengths; RBC: average
number of RBCs per field.
Ratio 1 Ratio 2 Ratio 3
Patient
(I502 /I628 )·RBC (I502 /I649 )·RBC I502 /I579
TC1 0.00 0.00 1.97
TC3 0.12 0.20 1.54
TC4 0.41 0.52 1.53
TC5 0.00 0.00 1.72
TC6 0.36 0.47 1.41
TC7 0.45 0.79 1.76
TC8 0.63 0.72 1.16
T1 2.96 3.55 1.95
T1_2 1.15 2.42 1.66
T2 0.99 1.11 1.80
T3 0.68 0.94 1.71
T5 2.09 2.72 1.70
T6 0.80 1.10 1.18
TA1 6.43 6.29 1.69
TA2 1.53 2.96 0.98
TA3 2.90 2.79 0.92
In the statistical analysis in terms of ratio 1, (I502 /I628 )·RBC, the student’s t-test showed significant
differences between control patients and those with thalassemia (p = 0.01) and with anemia (p = 0.002),
whereas it yielded smaller, but still significant, differences between individuals with thalassemia and
anemia (p = 0.045). Similar results were found in terms of ratio 2, (I502 /I649 )·RBC, although in this case
differences between patients with thalassemia and anemia were not significant: for control–thalassemia,
p = 0.001; for control–anemia, p = 0.001, and for thalassemia–anemia, p = 0.120.
On the other hand, the use of ratio 3, I502 /I579 , only provided statistically significant differences
between patients with thalassemia and anemia (p = 0.048), whereas the comparisons between control
individuals and those with thalassemia (p = 0.718) and with anemia (p = 0.243) were not significant.
Figure 3 graphically represents the results of Table 3; it can be seen that the different diseases are
differentiated for the two first calculated ratios (Figure 3a), whereas the third ratio (Figure 3b) computed
between 502 nm and 579 nm, is useful to discriminate samples corresponding to iron deficiency from
the others (except in one case).between patients with thalassemia and anemia (p = 0.048), whereas the comparisons between control
individuals and those with thalassemia (p = 0.718) and with anemia (p = 0.243) were not significant.
Figure 3 graphically represents the results of Table 3; it can be seen that the different diseases
are differentiated for the two first calculated ratios (Figure 3a), whereas the third ratio (Figure 3b)
computed between 502 nm and 579 nm, is useful to discriminate samples corresponding to10iron
Sensors 2020, 20, 4039 of 13
deficiency from the others (except in one case).
(a) (b)
Figure
Figure 3.
3. Graphical
Graphicalrepresentation
representation ofof averaged
averaged ratios
ratios of
of main
main peaks
peaks of of emission.
emission. (a)
(a)Circles
Circles represent
represent
values
values of
of ratio
ratio 1,
1, (I
(I502 /I628)∙RBC,
/I
502 628
and
)·RBC, X’s
and correspond
X’s correspond to ratio
to 2,
ratio (I
2, 502/I649
(I /I
502 649
)∙RBC. (b)
)·RBC. Ratio
(b) 3,
Ratio I
3,502I/I579/I
.
502 579 .
4. Conclusions
Table 3. Averaged ratios for main emission peaks. Iλ: intensity at different wavelengths; RBC: average
number of RBCs perof
The combination field.
CLSM with spectrofluorometry techniques is a powerful tool that allows
the direct analysis of global and unique fluorescent
Ratio 1 Ratiopixels
2 and 3their 3D location ex-vivo in the
Ratio
Patient
whole specimen, minimizing the artefacts (I502/I628)∙RBC I502/I649)∙RBC
associated I502/I579
with sample processing; other techniques,
such as atomic force microscopyTC1 [25], may 0.00
allow the0.00 1.97
RBC membrane to be inspected in detail but
TC3 0.12 0.20 1.54
cannot retrieve images at any desiredTC4
thickness
0.41
of the
0.52
specimen.
1.53
Our approach also allows RBC
discrimination with particular endogenous
TC5 0.00fluorescence0.00 signals.1.72 Other techniques, such as phase
imaging by interferometry, whichTC6 0.36 to quantify
is often used 0.47 changes 1.41in RBCs, may allow the imaging of
TC7 0.45 0.79 1.76
the specimen at specific depths from which the signal of interference arises, but they do not provide
TC8 0.63 0.72 1.16
sufficient wavelengths of excitation T1 as well 2.96as spectral3.55windows of
1.95 detection to explore the different
spectral traits in depth [26]. Since T1_2 thalassemia
1.15 has 2.42
unspecific1.66imaging characteristics, of the few
described state-of-the-art approaches T2 that we 0.99tried to reproduce,
1.11 1.80
the best tool to work with is confocal
imaging and the super-resolutionT3 provided 0.68 0.94
by the microscope 1.71
used. The descriptors (I502 /I628 ) · RBC
T5 2.09 2.72 1.70
and (I502 /I649 ) · RBC (ratios 1 and 2)
T6related0.80 to the intensities
1.10 measured
1.18 at 502 nm, 628 nm and 649 nm
when exciting RBCs at 405 nm allowed TA1 a 6.43
discrimination 6.29 between 1.69 healthy and diseased individuals
TA2
that presented with anemia (thalassemia or1.53 2.96 and between
iron deficiency) 0.98 different degrees of influence
TA3 2.90 2.79 0.92
in alpha-thalassemia, with less accuracy due to the small sample size. Ratio 3, I502 /I579 , differentiates
most iron deficiencies from thalassemia, although additional samples should be analyzed to validate
its performance. The difference in fluorescence resulting from these parameters may reside in heme
group degradation, which is associated to oxidative stress, as described by some of the authors in
the literature [27]. Nagababu et al. [28] have found heme degradation products in thalassemic mice,
which share with humans the gene clones that might be affected in this and other hemoglobinopathies.
It is interesting that, in this case, instead of exciting at 405 nm, the authors excited samples with a
321 nm laser wavelength and obtained two fluorescent emission bands, with a predominant peak at
480 nm. It would have been interesting to excite our samples with shorter wavelengths than 405 nm
without compromising the viability of the cells; however, with commercial confocal microscopes,
this is the shortest wavelength available. In addition, the authors suggested that the cell membrane
might be affected due to the release of iron from the heme group degradation, with an increase in
immunoglobin G antibody binding. Other authors have also suggested that the function of the cell
membrane might be affected in some ways; for instance, membrane skeletal spectrin is thought to be
related to the amount of hemoglobin [29]. There is an imbalance in the bilipid membrane affecting the
cytoadherence; thus, these diseased RBCs have difficulties circulating through certain vessels—for
instance, the ones in the spleen, causing splenomegaly. Therefore, it would be interesting to carry outSensors 2020, 20, 4039 11 of 13
another type of assay, referred to as the immuno-labeling of the cell membrane, which can only be
carried out with the cells fixated; this would be helpful for detecting affectations in the structure of the
cell membrane, which are not currently clearly determined. Nevertheless, another advantage of the
combined use of the imaging techniques described in this work, unlike other classical tests (such as
complete blood count, blood smears, or electrophoresis), is that it does not necessarily require reactives
or the use of markers and fixating substances used to capture absorption spectra [30]. Thus, tests can
be carried out in normal physiological conditions without the need to prepare hemolyzed serums and
with a relatively low volume of RBCs.
Another conclusion that we have drawn is that the establishment of a diagnosis protocol in
hospitals that include a pathological anatomy service would be relatively easy, since the healthcare
circuit for hematology samples to be directly analyzed in a Confocal Microscopy Unit works efficiently.
In addition, a diagnosis protocol based on confocal imaging has been compared to the genetic studies
that are currently used and will certainly shorten the response time and reduce the costs of the analyses.
Future work will consist of expanding the set of samples to corroborate the effectiveness of
the ratios described. We will also need to corroborate the results by trying to reproduce the same
experiments in a different hospital. Open source neural network models will be used to analyze our
set of images in further detail, and thus we will obtain better screening results. The current research
and next experiments may offer hematologists with a new approach to improving diagnostic strategies
and searching for involved genes.
Author Contributions: Conceptualization, M.R. and M.V.; methodology, L.R.-B., M.R., F.J.B.-F. and M.V.; software,
L.R.-B.; validation, S.G., A.R.L. and I.I.; formal analysis, M.V.; investigation, L.R.-B., M.R., F.J.B-F. and M.V.;
resources, M.V., M.R., S.G., A.R.L. and I.I.; data curation, L.R.-B., M.R. and M.V.; writing—original draft preparation,
L.R.-B.; writing—review and editing, F.J.B.-F., M.R. and M.V.; visualization, S.G., A.R.L. and I.I.; supervision, M.R.,
F.J.B.-F. and M.V.; project administration, M.V.; funding acquisition, M.V. All authors have read and agreed to the
published version of the manuscript.
Funding: This research was funded by Spanish Ministry of Economy and Competitiveness, grant number
DPI2017-89414-R. L.R.-B. thanks the Ministry of Science, Innovation and Universities for the PhD (FPI) grant she
has received.
Conflicts of Interest: The authors declare no conflict of interest. The funders had no role in the design of the
study; in the collection, analyses, or interpretation of data; in the writing of the manuscript, or in the decision to
publish the results.
Ethics Statement: This study was carried out in accordance with recommendations of the Fundació Sant Joan de
Déu Ethics Committee. Written informed consent was obtained from patients and/or their parents or guardians
in accordance with the Declaration of Helsinki. The protocol was approved by the Fundació Sant Joan de Déu
Ethics Committee.
References
1. Desouky, O.S.; Selim, N.S.; El-Bakrawy, E.M.; El-Marakby, S.M. Biophysical characterization of β-thalassemic
red blood cells. Cell Biochem. Biophys. 2009, 55, 45–53. [CrossRef]
2. Provan, D.; Baglin, T.; Dokal, I.; de Vos, J. Oxford Handbook of Clinical Haematology, 4th ed.; Oxford University
Press: Oxford, UK, 2015; ISBN 9780199683307.
3. Devanesan, S.; Mohamad Saleh, A.; Ravikumar, M.; Perinbam, K.; Prasad, S.; Abbas, H.A.-S.; Palled, S.R.;
Jeyaprakash, K.; Masilamani, V.; Prasad, S.; et al. Fluorescence spectral classification of iron deficiency
anemia and thalassemia. J. Biomed. Opt. 2014, 19, 027008. [CrossRef]
4. Akuwudike, A.; Chikezie, P.; Chilaka, F. Absorption Spectra of Normal Adult and Sickle Cell Haemoglobins
Treated with Hydrogen Peroxide at Two pH Values. Adv. Biores. 2010, 1, 55–60.
5. Gunasekaran, S.; Natarajan, R.K.; Renganayaki, V. UV visible spectrophotometric approach and absorption
model for the discrimination of diseased blood. Asian J. Chem. 2008, 20, 48–54.
6. Di Caprio, G.; Stokes, C.; Higgins, J.M.; Schonbrun, E. Single-cell measurement of red blood cell oxygen
affinity. Proc. Natl. Acad. Sci. USA 2015, 112, 9984–9989. [CrossRef]
7. Liu, K.Z.; Tsang, K.S.; Li, C.K.; Shaw, R.A.; Mantsch, H.H. Infrared spectroscopic identification of
β-thalassemia. Clin. Chem. 2003, 49, 1125–1132. [CrossRef] [PubMed]Sensors 2020, 20, 4039 12 of 13
8. Alsalhi, M.S.; Algahtani, F.H.; Devanesan, S.; Vijmasi, V.T.; Jeyaprakash, K.; Alsaeed, A.H.; Masilamani, V.
Spectral detection of thalassemia: A preliminary study. J. Biomed. Sci. 2014, 21, 1–8. [CrossRef]
9. Dai, C.; Li, Q.; Liu, J. Blood cells classification using hyperspectral imaging technique. J. Bioinform. Biol. Eng.
2013, 1, 27–33.
10. Conti, M.; Scanferlato, R.; Louka, M.; Sansone, A.; Marzetti, C.; Ferreri, C. Building up spectral libraries for
mapping erythrocytes by hyperspectral dark field microscopy. Biomed. Spectrosc. Imaging 2016, 5, 175–184.
[CrossRef]
11. Kurtuldu, H.; Oktan, A.D.; Candan, H.; Cihangiroglu, B.S. Red Blood Cell Analysis by Hyperspectral
Imaging. Nat. Appl. Sci. J. 2018, 2, 9–15.
12. Robison, C.J.; Kolanko, C.; Bourlai, T.; Dawson, J.M. Imaging of blood cells based on snapshot Hyper-Spectral
Imaging systems. In Algorithms and Technologies for Multispectral, Hyperspectral, and Ultraspectral Imagery XXI;
International Society for Optics and Photonics: Baltimore, MD, USA, 2015; Volume 9472, p. 94721L.
13. Golan, L.; Yelin, D. Flow cytometry using spectrally encoded confocal microscopy. Opt. Lett. 2010, 35, 2218.
[CrossRef] [PubMed]
14. Zeidan, A.; Yelin, D. Reflectance confocal microscopy of red blood cells: Simulation and experiment.
Biomed. Opt. Express 2015, 6, 4335. [CrossRef]
15. Khairy, K.; Foo, J.; Howard, J. Shapes of Red Blood Cells: Comparison of 3D Confocal Images with the
Bilayer-Couple Model. Cell. Mol. Bioeng. 2008, 1, 173–181. [CrossRef] [PubMed]
16. Rappaz, B.; Barbul, A.; Emery, Y.; Korenstein, R.; Depeursinge, C.; Magistretti, P.J.; Marquet, P. Comparative
study of human erythrocytes by digital holographic microscopy, confocal microscopy, and impedance
volume analyzer. Cytom. Part A 2008, 73, 895–903. [CrossRef] [PubMed]
17. Lima, R.; Ishikawa, T.; Imai, Y.; Takeda, M.; Wada, S.; Yamaguchi, T. Measurement of Individual Red Blood
Cell Motions Under High Hematocrit Conditions Using a Confocal Micro-PTV System. Ann. Biomed. Eng.
2009, 37, 1546–1559. [CrossRef] [PubMed]
18. Yakimov, B.P.; Gogoleva, M.A.; Semenov, A.N.; Rodionov, S.A.; Novoselova, M.V.; Gayer, A.V.; Kovalev, A.V.;
Bernakevich, A.I.; Fadeev, V.V.; Armaganov, A.G.; et al. Label-free characterization of white blood cells
using fluorescence lifetime imaging and flow-cytometry: Molecular heterogeneity and erythrophagocytosis.
Biomed. Opt. Express 2019, 10, 4220. [CrossRef] [PubMed]
19. Greiner, C.; Hunter, M.; Huang, P.; Rius, F.; Georgakoudi, I. Confocal backscattering spectroscopy for
leukemic and normal blood cell discrimination. Cytom. Part A 2011, 79, 866–873. [CrossRef]
20. Zheng, W.; Li, D.; Zeng, Y.; Luo, Y.; Qu, J.Y. Two-photon excited hemoglobin fluorescence. Biomed. Opt. Express
2011, 2, 71. [CrossRef]
21. Croce, A.C.; Bottiroli, G. Autofluorescence spectroscopy and imaging: A tool for biomedical research and
diagnosis. Eur. J. Histochem. 2014, 58, 320–337. [CrossRef]
22. Meloni, T.; Gallisai, D.; Demontis, M.; Erre, S. Free erythrocyte porphyrin (FEP) in the diagnosis of
β-thalassaemia trait and iron deficiency anaemia. Haematologica 1982, 67, 341.
23. Stockman, J.A.; Weiner, L.S.; Simon, G.E.; Stuart, M.J.; Oski, F.A. The measurement of free erythrocyte
porphyrin (FEP) as a simple means of distinguishing iron deficiency from beta-thalassemia trait in subjects
with microcytosis. J. Lab. Clin. Med. 1975, 85, 113–119. [PubMed]
24. Lamola, A.A. Fluorescence methods in the diagnosis and management of diseases of tetrapyrrole metabolism.
J. Investig. Dermatol. 1981, 77, 114–121. [CrossRef] [PubMed]
25. Kozlova, E.K.; Chernysh, A.M.; Moroz, V.V.; Kuzovlev, A.N. Analysis of nanostructure of red blood cells
membranes by space Fourier transform of AFM images. Micron 2013, 44, 218–227. [CrossRef] [PubMed]
26. Yi, F.; Moon, I.; Javidi, B.; Boss, D.; Marquet, P. Automated segmentation of multiple red blood cells with
digital holographic microscopy. J. Biomed. Opt. 2013, 18, 026006. [CrossRef] [PubMed]
27. Amer, J.; Fibach, E. Oxidative status of platelets in normal and thalassemic blood. Thromb. Haemost. 2004, 92,
1052–1059. [CrossRef]
28. Nagababu, E.; Fabry, M.E.; Nagel, R.L.; Rifkind, J.M. Heme degradation and oxidative stress in murine
models for hemoglobinopathies: Thalassemia, sickle cell disease and hemoglobin C disease. Blood Cells
Mol. Dis. 2008, 41, 60–66. [CrossRef]Sensors 2020, 20, 4039 13 of 13
29. Datta, P.; Chakrabarty, S.B.; Chakrabarty, A.; Chakrabarti, A. Interaction of erythroid spectrin with hemoglobin
variants: Implications in β-thalassemia. Blood Cells Mol. Dis. 2003, 30, 248–253. [CrossRef]
30. Jia, W.; Chen, P.; Chen, W.; Li, Y. Raman characterizations of red blood cells with β-thalassemia using laser
tweezers Raman spectroscopy. Medicine 2018, 97, e12611. [CrossRef]
© 2020 by the authors. Licensee MDPI, Basel, Switzerland. This article is an open access
article distributed under the terms and conditions of the Creative Commons Attribution
(CC BY) license (http://creativecommons.org/licenses/by/4.0/).You can also read