Printing Parameter Requirements for 3D Printable Geopolymer Materials Prepared from Industrial Side Streams - MDPI
←
→
Page content transcription
If your browser does not render page correctly, please read the page content below
materials
Article
Printing Parameter Requirements for 3D Printable Geopolymer
Materials Prepared from Industrial Side Streams
Qaisar Munir *, Riku Peltonen and Timo Kärki

                                          Fiber Composite Laboratory, LUT School of Energy Systems, Lappeenranta-Lahti University of Technology,
                                          53850 Lappeenranta, Finland; riku.peltonen@lut.fi (R.P.); Timo.Karki@lut.fi (T.K.)
                                          * Correspondence: qaisar.munir@lut.fi

                                          Abstract: The objective of this investigation is to study the printing parameter requirements for sustainable
                                          3D printable geopolymer materials. Side streams of the paper, mining, and construction industries were
                                          applied as geopolymer raw materials. The effect of printing parameters in terms of buildability, mixability,
                                          extrudability, curing, Al-to-Si ratio, and waste materials utilisation on the fresh and hardened state of
                                          the materials was studied. The material performance of a fresh geopolymer was measured using setting
                                          time and shape stability tests. Standardised test techniques were applied in the testing of the hardened
                                          material properties of compressive and flexural strength. The majority of developed suitable 3D printable
                                          geopolymers comprised 56–58% recycled material. Heating was used to improve the buildability and
                                          setting of the material significantly. A reactive recyclable material content of greater than 20% caused
                                          the strength and material workability to decrease. A curing time of 7–28 days increased the compressive
                                          strength but decreased the flexural strength. The layers in the test samples exhibited decreased and
                                          increased strength, respectively, in compressive and flexural strength tests. Geopolymer development was
                                found to be a compromise between different strength values and recyclable material contents. By focusing

                                          on specialised and complex-shape products, 3D printing of geopolymers can compete with traditional
Citation: Munir, Q.; Peltonen, R.;
                                          manufacturing in limited markets.
Kärki, T. Printing Parameter
Requirements for 3D Printable
                                          Keywords: geopolymers; 3D printing; printing parameters; recyclable materials; industrial side
Geopolymer Materials Prepared from
                                          streams; compression; flexural strength
Industrial Side Streams. Materials
2021, 14, 4758. https://doi.org/
10.3390/ma14164758

Academic Editor: Thomas Kerstedjian       1. Introduction
                                                In recent years, 3D printing and additive manufacturing (AM) of concrete have
Received: 22 July 2021                    gained considerable recognition because they enable the fabrication of structures from
Accepted: 17 August 2021                  digital models [1,2]. The use of 3D printing techniques in the construction industry has
Published: 23 August 2021                 the potential to increase automation [3], minimise material waste [4], and reduce labour
                                          requirements [5,6]. Moreover, 3D printing of construction materials may dramatically
Publisher’s Note: MDPI stays neutral      change conventional construction methods by permitting the adoption of advanced digital
with regard to jurisdictional claims in   modelling practices in structural design and construction [7,8]. Among the numerous 3D
published maps and institutional affil-   printing techniques for construction products, the most familiar concrete AM process is
iations.
                                          based on material extrusion, wherein the required cementitious materials are deposited
                                          in a layering process [9–11]. The mixing ratios of the essential ingredients of 3D printable
                                          cementitious materials and the SiO2 and Al2 O3 percentages of their precursors have been
                                          revealed in numerous recent publications [12–15].
Copyright: © 2021 by the authors.               The adoption of concrete 3D printing for constructing structural and architectural
Licensee MDPI, Basel, Switzerland.        components has been broadly examined in present-day research [10,16,17]. Numerous
This article is an open access article    techniques and materials have been investigated to promote concrete 3D printing [18–20].
distributed under the terms and           However, various challenges involving the printing parameters, material composition,
conditions of the Creative Commons
                                          structural design, and usage of conventional materials (such as ordinary Portland cement
Attribution (CC BY) license (https://
                                          (OPC) in terms of energy required, cost, and CO2 emissions are linked with the substantial
creativecommons.org/licenses/by/
                                          limitations of the technology.
4.0/).

Materials 2021, 14, 4758. https://doi.org/10.3390/ma14164758                                               https://www.mdpi.com/journal/materials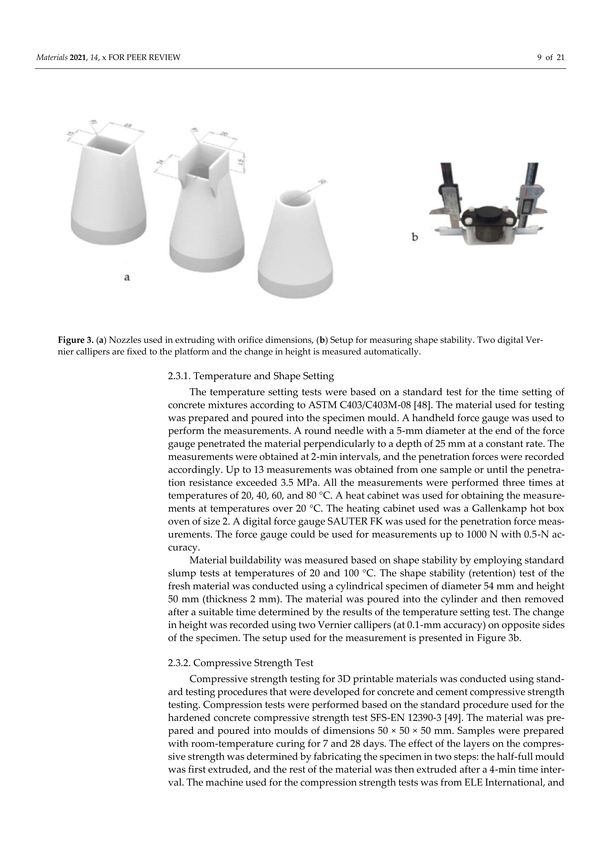
Materials 2021, 14, 4758                                                                                             2 of 19

                                 From the perspective of climate change and sustainable development, the use of OPC,
                           which is the main constituent of concrete, can be considered problematic, as OPC production
                           comprises nearly 5% of industrial energy consumption and is responsible for 7% of global CO2
                           emissions [21]. The production of one ton of OPC releases an average of 0.95 tons of CO2,
                           primarily owing to the energy demand of the calcination of calcium carbonate. Furthermore,
                           OPC exhibits low fire and thermal resistance and moderate chemical shielding against salts
                           and acids [22]. Consequently, to reduce raw material usage, minimise the carbon footprint of
                           construction activities, and improve construction quality, alternative construction materials to
                           OPC are required. One such substitute for OPC is geopolymer cement [23].
                                 Geopolymers have significant acid resistance [24,25], adequate adhesion to steel, concrete,
                           and iron [26], and are considered a viable and eco-friendly substitute for OPC [7]. Geopolymer
                           materials are created by polymerising aluminosilicate materials, activated using an alkaline
                           solution [27]. Alkaline liquids and source materials rich in aluminium (Al) and silicon (Si)
                           are the two essential constituents of geopolymers. Additives (glass or steel fibres) are used
                           in geopolymers to improve their strength properties, and thixotropic additives are used to
                           improve the printability of the geopolymer. Source materials, such as slag, fly ash, rice husk
                           ash, silica fume, and metakaolin, among other alternatives, can be adopted for the synthesis of
                           geopolymers [28]. The use of common precursors for geopolymers and activators allows the
                           use of various geopolymer mixtures and mixture designs [14].
                                 Construction and demolition (C&D) waste, which comprises inert (concrete, rock,
                           wood, sand, bricks, etc.) and non-inert (bamboo, timber, packaging waste, etc.) materials,
                           is a significant contributor to the overall waste volume [29]. The C&D waste generated
                           in Europe comprises nearly 450–500 million tons every year and is considered one of
                           the dominant sources of global waste [30]. Three types of construction sites generate
                           C&D waste: demolition (57%), renovation (27%), and construction (16%) sites. These sites
                           generate waste of various characteristics and compositions [31]. The essential components
                           of C&D waste, such as bricks, concrete, wood, metals, and ceramics, have significant
                           potential for material restoration. Therefore, the European Union has set an impressive
                           material recovery objective (70% of generated C&D waste) in terms of recycling, recovering,
                           or reusing such waste as construction material [32].
                                 The recycling of C&D waste has been the subject of much research. Duan et al. [33]
                           found that the utilisation of recycled aggregates and recycled aggregate concrete is an
                           effective measure for addressing the growing problem of C&D waste generation and
                           disposal. Furthermore, the use of recycled aggregates could ease the pressure on natural
                           resources. According to Letelier et al. [34], a mix of 30% recycled aggregates and waste brick
                           powder can be used to replace 15% of the cement used in construction without substantial
                           losses in the strength of the final material as compared to the control concrete. Ortega
                           et al. [35] and Xiao et al. [36] reported that the durability of concrete can be improved by
                           using concrete brick powder. Duan et al. [33] investigated the use of mortar comprising
                           30% recycled powder of various C&D wastes and found that it realized flexural and
                           compressive strengths of 89.47% and 84.43%, respectively, of cement mortar. However,
                           mortar containing recycled powder of fine and coarse aggregates can have poor workability,
                           which has a negative effect on the compaction properties and homogeneity of fresh concrete.
                           Workability is an essential parameter of 3D printable geopolymer materials in addition to
                           the particle size, mix ratio, and fresh and hardened properties.
                                 The factors affecting the geopolymer printing process can be divided into three main
                           categories: the geometry and size of the components, material parameters, and machine
                           parameters. The most important material parameters are the open time and properties that
                           affect pumping and buildability. The machine parameters (pressure, speed, and layer height)
                           must be set according to the material properties and geometry of the component. The material
                           must be selected based on the component to be 3D printed [37]. Geopolymer materials and 3D
                           printing systems suitable for geopolymer printing are still under development, as illustrated by
                           the approaches investigated in the studies of [23,37–39]. The AM of geopolymer materials is
                           highly dependent on the material mixture and parameters used during extrusion. One of the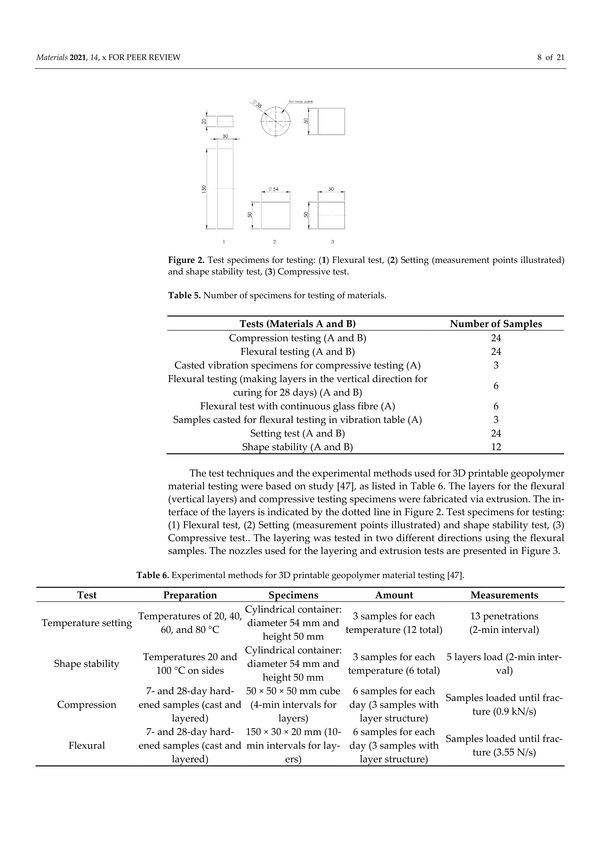
Materials 2021, 14, 4758                                                                                                3 of 19

                           major issues in the implementation of geopolymer 3D concrete printing is the development of a
                           clear understanding of how the printing parameters are defined, such that the material can be
                           sufficiently fluid to flow through a hosepipe without causing clogging [39].
                                 Objects printed on a smaller scale can have similar strength properties compared to
                           cast parts. According to Lechner et al. [40], finite element method optimisation is preferable
                           for testing the mechanical properties of cast objects, which is state-of-the-art for various
                           materials used on industrial scale productions. Similarly, during the casting process, the
                           evolving thermal fields can be detected through casting process simulation [41]. However,
                           standardized testing methods for 3D printable geopolymers or concrete are currently
                           not available. A lack of testing guidelines makes it harder to compare and model the
                           mechanical properties of the 3D printed elements. There is no agreement on the size of the
                           printed object for testing and objectively characterizing the mechanical properties. The
                           layer or interface minimal amount for testing is yet to be clarified [42].
                                 The aim of this research was to investigate 3D printable geopolymer material parame-
                           ters, such as the setting time, open time, shape stability (buildability), compressive, flexural,
                           and bond strength, and the effect of different contents of aluminosilicate on the parameters
                           of the geopolymer material. Geopolymers formulated from locally sourced ingredients
                           and waste materials containing aluminium and silicon were investigated experimentally.
                           This work is focused on the setting time, buildability, and mechanical properties, which are
                           examined via flexural and compression testing. The effect of heat on the setting time and
                           buildability properties of geopolymers is the focus of interest. In this study, the examination
                           of the fresh material properties is focused on the properties of the material immediately
                           after extrusion until when it hardens beyond extrudability. The material behaviour is
                           studied from a 3D-printing perspective.

                           2. Experimental Preparation
                           2.1. Raw Materials
                                Industrial side streams and C&D waste were the primary source materials used in
                           this study. To test the printing parameters (including setting test, shape retention, and
                           hardened property testing) of 3D printable geopolymers, additional materials, such as bark
                           boiler ash, mine tailings, and metakaolin, were used. Bark ash, which is a by-product of the
                           paper and pulp industry, is used as the primary binder ingredient instead of fly ash. The
                           differences in the Al and Si ratios in the fly ash (2) and bark boiler ash (0.9–1) were fixed
                           using C&D waste and metakaolin. The C&D waste was employed as a filler and reactive
                           material in this investigation because of the Al and Si ratio (between 2.8% and 4.3%). The
                           C&D waste applied in this research was selected to have a maximum particle size of 4 mm,
                           with larger particles of rock, soil, and Styrofoam. The Al and Si contents of the materials,
                           which appeared as oxides, are listed in Table 1. A commercial sodium silicate solution with
                           a molar proportion of 2.4–2.6 was used as a reagent in this study.

                           Table 1. Aluminium and silicon composition (weight %) of materials used in geopolymer mixture.

                             Component         C&D W          Bark Ash         Fly Ash       Metakaolin      Glass Wool
                               Al [%]            8.5             6.5             3.3             21.2            28.9
                               Si [%]            23.8            6.2             7.6             25.7            1.3

                                Sand (coarse and fine) was received as the leftover product from mine tailings and
                           used as a filler material with no reactive components. Commercial metakaolin (having
                           47% of Al and Si in a 1:2 ratio) was used as a reactive pozzolan and source of Al and Si.
                           The other materials used as additives in the geopolymer formulation were glass wool and
                           carbon fibre. Recycled carbon fibre (chopped to 3-mm length) was used to analyse their
                           effects on the strength properties of the 3D printable material. Bark boiler ash, C&D waste,
                           and metakaolin were used as the binder, which is in contrast to general 3D printable mixes,
                           wherein the binder consists of fly ash, slag, and silica fume. The moisture contents of the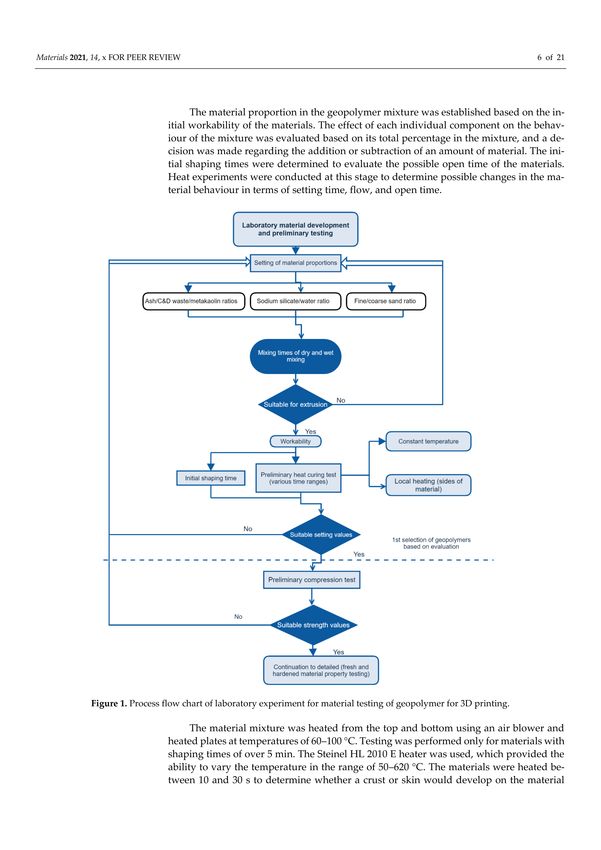
Materials 2021, 14, 4758                                                                                                     4 of 19

                           raw materials are listed in Table 2. The materials were placed in tightly sealed containers
                           to prevent changes in their moisture content during the geopolymer material preparation.

                           Table 2. Moisture content of the waste materials.

                               Material          Fly Ash         Bark Ash         Sand Fine       Sand Coarse         C&D W
                            Moisture [%]          10.38             0.07             11.54             2.23             21.87

                           2.2. Preparation of 3D Printable Geopolymer Materials: Mixing Procedure
                                 The suitable formulation of the mixture and the effect of individual components on the
                           fresh and hardened states of the material were the criteria adopted in this study for the 3D
                           printable geopolymer material design. In the initial development of the materials, the shaping
                           time of the mixture was determined to obtain preliminary values to determine the possible
                           open time of the material. Suitable mix ratios of the raw materials were selected according to the
                           material proportions. The framework, process flow of material development, and preliminary
                           testing are presented in Figure 1. The material testing procedure was based on flow charts
                           presented by Panda and Tan [7] and Ma et al. [43]. The information of reported mixtures and
                           proportions used in successful 3D printing in the literature is recognised as a starting point for
                           laboratory testing in the development of a new 3D printable mixture [44].

                           Figure 1. Process flow chart of laboratory experiment for material testing of geopolymer for 3D printing.
Materials 2021, 14, 4758 5 of 19
The raw material mixture was prepared according to the aforementioned material
proportions to achieve Al/Si ratios of 1.3–2.5. For the alkaline reagent, a sodium silicate
solution having a molar ratio of 2.4–2.6 was used (31% SiO2 and 13% Na2 O). The constraint
applied was that no material composition could be zero, and the mixture was required
to be sufficiently workable by hand before being poured into the moulds. The material
ratios were adjusted according to the mixture behaviour, and the process of the mixing
and determination of suitable mixing proportions evolved until an initial workability was
established. The material mixture was tested for setting, curing, and extrusion before more
detailed buildability and hardened property testing was conducted. The numerical values
used for evaluating and selecting the geopolymer material mixtures for further testing
and the parameters selected for the suitable material composition are listed in Table 3.
A binder mixture containing 30–33% bark boiler ash, C&D waste, and metakaolin was
selected from a series of mixtures as a starting point for the preliminary compression
testing. The geopolymer material was prepared by weighing all the required ingredients
with an accuracy of 0.1 g. Ash, C&D waste, metakaolin, and sand (and glass wool or
carbon fibre) were mixed for 3 min. Water and sodium silicate were mixed for 1 min. After
constant mixing for 1–2 min, the solution of sodium silicate and water was poured into
the dry material mix. The material stuck on the sides of the mixing bowl was scraped
off periodically during the mixing process to obtain an even mixture. The Hobart mixer,
having a range of speeds (400 m−1 ), and a drill (Makita DHP453) with a mixer attachment
were used for the mixing process.
The material proportion in the geopolymer mixture was established based on the initial
workability of the materials. The effect of each individual component on the behaviour
of the mixture was evaluated based on its total percentage in the mixture, and a decision
was made regarding the addition or subtraction of an amount of material. The initial
shaping times were determined to evaluate the possible open time of the materials. Heat
experiments were conducted at this stage to determine possible changes in the material
behaviour in terms of setting time, flow, and open time.
The material mixture was heated from the top and bottom using an air blower and
heated plates at temperatures of 60–100 ◦ C. Testing was performed only for materials with
shaping times of over 5 min. The Steinel HL 2010 E heater was used, which provided
the ability to vary the temperature in the range of 50–620 ◦ C. The materials were heated
between 10 and 30 s to determine whether a crust or skin would develop on the material
surface. Ten geopolymer mixtures having sufficient workability and fresh properties were
investigated to examine their preliminary compressive strength. The material compositions
of the mixtures are listed in Table 4. Specimens were formed by casting in cubes of
dimensions 50 × 50 × 50 mm and cured for 24 h in an oven at 60 ◦ C and then cured at
room temperature for 48 h to attain a maximum compression strength. The material values
were changed to realise a maximum compression strength, and the effect of an individual
component on the behaviour of the mixture was investigated.
2.3. Experimental Methods
Material testing was implemented for the mixtures in the fresh (extrudable) and
hardened (cured for 7 and 28 days) states. The curing time and temperature are essential
consideration in geopolymerization reaction to attain maximum strength [45]. Geopolymer
material testing in the hardened state was based on a study conducted by Panda et al. [46]
and Paul et al. [38], where materials were cured for 7 and 28 days to calculate strength prop-
erties, which is typically considered a standard practice for curing at ambient temperature.
According to Nematollahi et al. [24], room temperature curing of geopolymer concrete for
28 days attains the same mechanical properties as 24 h oven-cured sample. Similarly, 65%
of the design strength of concrete is possible to achieve after 7 days of curing. Therefore, in
this study, mixtures were cured for 7 and 28 days to measure hardened material properties.Materials 2021, 14, 4758 6 of 19
Table 3. Parameters considered for mixture composition.
Geopolymer Initial Curing Water-to- Silicate-to-
Al-to-Si Waste
Mix Mixability Mix Initial Workable Extrudability Appearance Silicate Binder
ratio Materials
Stage Time After 1 Day Ratio Ratio
Material
Mixed Sticky and low started to
Material
ingredients slump, partially tear after Cracking on Between Between
1d sets under Above 5 (6) 50–55%
in liquid maintains initial surface 3.5 and 4. 1.8 and 2.3
3 min
form shape setting
time
No powder
Ingredients Sticky and low More than forma- Between
5p 7.5 7.5 0 55–60%.
mixed well slump 5 min tion/uniform 1.4 and 1.6
colour
Ingredients No powder
mixed/liquid Sticky and low More than forma- Between Between 60% or
3m 7.5 7.5
absorbed slump 5 min tion/uniform 2.5 and 3 1.8 and 2.3 higher
not well colour
Ingredients No powder
Maintains its
mixed/liquid More than forma- Between Between
2l shape but 7.5 7.5 55–60%
absorbed 5 min tion/uniform 2.5 and 3 1.6 and 1.8
partly sticky
not well colour
Ingredients
No powder
mixed/ but Maintains its
More than forma- Between Between
3i stiffness or shape but 7.5 6 55–60%
5 min tion/uniform 2.0 and 2.5 1.4 and 1.6
low partly sticky
colour
viscosity
No powder
Maintains its
Ingredients More than forma- Between Between
4e shape but 7.5 6 55–60%
mixed well 5 min tion/uniform 2.0 and 2.5 1.4 and 1.6
partly sticky
colour
Ingredients
No powder
mixed but Possible to
More than forma- Between Between
4n breakdown shape and does 7.5 7.5 55–60%
5 min tion/uniform 2.5 and 3 1.4 and 1.6
in not fracture
colour
crumbles
Ingredients
No powder
mixed/ but Maintains its
More than forma- Between Between
3l stiffness or shape but 7.5 7.5 55–60%
5 min tion/uniform 1.5 and 2,0 1.6 and 1.8
low partly sticky
colour
viscosity
No powder
Ingredients Sticky and low More than forma- Between Between
2n 7.5 7.5 55–60%
mixed well slump 5 min tion/uniform 2.5 and 3 1.4 and 1.6
colour
No powder
Maintains its
Ingredients More than forma- Between Between
3n shape but 7.5 7.5 55–60%
mixed well 5 min tion/uniform 2.5 and 3 1.4 and 1.6
partly sticky
colour
Table 4. Mixture composition (%) used for preliminary compression testing.
Mix Ash C&D Waste Metakaolin Reagent Water Sand c Sand F Al Si Curing Min
1d 9 28 13 13 23 14 10.5 5.7 4
5p 13 11 35 9 15 13 4.6 1.8 8
3m 15 13 3 21 9 26 13 5 2.2 6
2l 7 10 13 21 10 26 13 6.2 3.8 17
3i 7 9 13 15 16 26 13 6.2 4 5
4e 7 10 13 15 16 26 13 6.1 4 7
4n 7 9.5 13 22 9 30 9 6 4 9
3l 10 10 13 22 6 26 13 6.5 3.9 8
2n 7 10 13 22 9 30 9 6.2 4.1 10
3n 7 10 13 22 6 30 9 6.2 4.1 8
The mixture workability was determined through the setting test, which also provided
a reference for extrudability. The shape retention test provides values for the buildability ofMaterials 2021, 14, 4758 7 of 19
the material, which is an essential aspect in layer-upon-layer manufacturing. Compressive
and flexural tests were conducted to determine the performance of the final product and
to examine the hardened properties of the mixtures. Testing was performed for the two
fresh materials (labelled A and B) that were evaluated and found to be most suitable for
3D printing applications after preliminary compression testing. The specimens used for
testing are illustrated in Figure 2. For the testing, two different materials were prepared,
and a total of 102 samples were fabricated. The distribution of the tests and the number of
samples are presented in Table 5.
Figure 2. Test specimens for testing: (1) Flexural test, (2) Setting (measurement points illustrated)
and shape stability test, (3) Compressive test.
Table 5. Number of specimens for testing of materials.
Tests (Materials A and B) Number of Samples
Compression testing (A and B) 24
Flexural testing (A and B) 24
Casted vibration specimens for compressive testing (A) 3
Flexural testing (making layers in the vertical direction for curing
6
for 28 days) (A and B)
Flexural test with continuous glass fibre (A) 6
Samples casted for flexural testing in vibration table (A) 3
Setting test (A and B) 24
Shape stability (A and B) 12
The test techniques and the experimental methods used for 3D printable geopolymer
material testing were based on study [47], as listed in Table 6. The layers for the flexural
(vertical layers) and compressive testing specimens were fabricated via extrusion. The
interface of the layers is indicated by the dotted line in Figure 2. Test specimens for
testing: (1) Flexural test, (2) Setting (measurement points illustrated) and shape stability
test, (3) Compressive test. The layering was tested in two different directions using the
flexural samples. The nozzles used for the layering and extrusion tests are presented in
Figure 3.Materials 2021, 14, 4758 8 of 19
Table 6. Experimental methods for 3D printable geopolymer material testing [47].
Test Preparation Specimens Amount Measurements
Cylindrical container:
Temperatures of 20, 40, 60, 3 samples for each 13 penetrations
Temperature setting diameter 54 mm and
and 80 ◦ C temperature (12 total) (2-min interval)
height 50 mm
Cylindrical container:
Temperatures 20 and 3 samples for each 5 layers load
Shape stability diameter 54 mm and
100 ◦ C on sides temperature (6 total) (2-min interval)
height 50 mm
6 samples for each day
7- and 28-day hardened 50 × 50 × 50 mm cube (4-min Samples loaded until
Compression (3 samples with
samples (cast and layered) intervals for layers) fracture (0.9 kN/s)
layer structure)
6 samples for each day
7- and 28-day hardened 150 × 30 × 20 mm (10-min Samples loaded until
Flexural (3 samples with
samples (cast and layered) intervals for layers) fracture (3.55 N/s)
layer structure)
Figure 3. (a) Nozzles used in extruding with orifice dimensions, (b) Setup for measuring shape stability. Two digital Vernier
callipers are fixed to the platform and the change in height is measured automatically.
2.3.1. Temperature and Shape Setting
The temperature setting tests were based on a standard test for the time setting of
concrete mixtures according to ASTM C403/C403M-08 [48]. The material used for testing
was prepared and poured into the specimen mould. A handheld force gauge was used
to perform the measurements. A round needle with a 5-mm diameter at the end of the
force gauge penetrated the material perpendicularly to a depth of 25 mm at a constant
rate. The measurements were obtained at 2-min intervals, and the penetration forces were
recorded accordingly. Up to 13 measurements was obtained from one sample or until the
penetration resistance exceeded 3.5 MPa. All the measurements were performed three
times at temperatures of 20, 40, 60, and 80 ◦ C. A heat cabinet was used for obtaining the
measurements at temperatures over 20 ◦ C. The heating cabinet used was a Gallenkamp
hot box oven of size 2. A digital force gauge SAUTER FK was used for the penetration
force measurements. The force gauge could be used for measurements up to 1000 N with
0.5-N accuracy.
Material buildability was measured based on shape stability by employing standard
slump tests at temperatures of 20 and 100 ◦ C. The shape stability (retention) test of the
fresh material was conducted using a cylindrical specimen of diameter 54 mm and height
50 mm (thickness 2 mm). The material was poured into the cylinder and then removed
after a suitable time determined by the results of the temperature setting test. The change
in height was recorded using two Vernier callipers (at 0.1-mm accuracy) on opposite sides
of the specimen. The setup used for the measurement is presented in Figure 3b.Materials 2021, 14, 4758 9 of 19
2.3.2. Compressive Strength Test
Compressive strength testing for 3D printable materials was conducted using standard
testing procedures that were developed for concrete and cement compressive strength testing.
Compression tests were performed based on the standard procedure used for the hardened
concrete compressive strength test SFS-EN 12390-3 [49]. The material was prepared and
poured into moulds of dimensions 50 × 50 × 50 mm. Samples were prepared with room-
temperature curing for 7 and 28 days. The effect of the layers on the compressive strength was
determined by fabricating the specimen in two steps: the half-full mould was first extruded,
and the rest of the material was then extruded after a 4-min time interval. The machine used
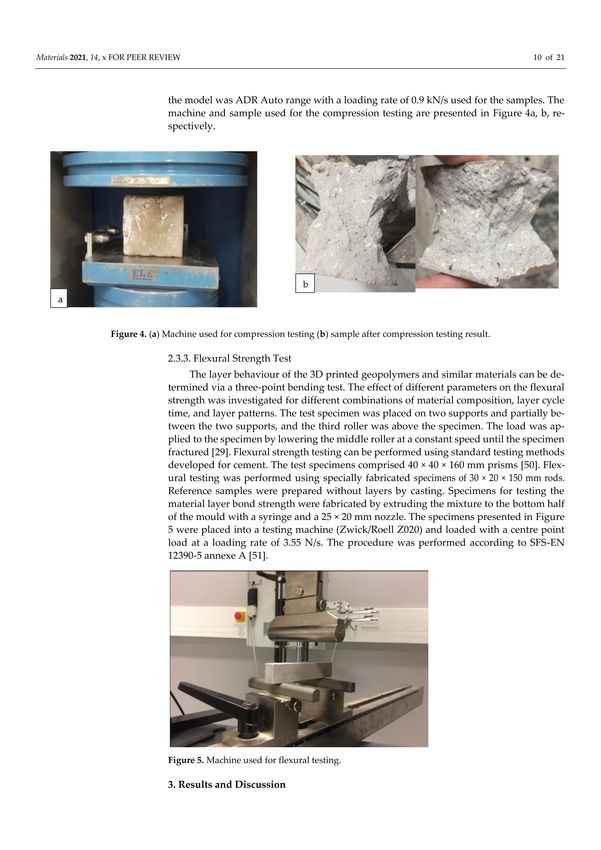
for the compression strength tests was from ELE International, and the model was ADR Auto
range with a loading rate of 0.9 kN/s used for the samples. The machine and sample used for
the compression testing are presented in Figure 4a, b, respectively.
Figure 4. (a) Machine used for compression testing (b) sample after compression testing result.
2.3.3. Flexural Strength Test
The layer behaviour of the 3D printed geopolymers and similar materials can be
determined via a three-point bending test. The effect of different parameters on the flexural
strength was investigated for different combinations of material composition, layer cycle
time, and layer patterns. The test specimen was placed on two supports and partially
between the two supports, and the third roller was above the specimen. The load was
applied to the specimen by lowering the middle roller at a constant speed until the specimen
fractured [29]. Flexural strength testing can be performed using standard testing methods
developed for cement. The test specimens comprised 40 × 40 × 160 mm prisms [50].
Flexural testing was performed using specially fabricated specimens of 30 × 20 × 150 mm
rods. Reference samples were prepared without layers by casting. Specimens for testing
the material layer bond strength were fabricated by extruding the mixture to the bottom
half of the mould with a syringe and a 25 × 20 mm nozzle. The specimens presented in
Figure 5 were placed into a testing machine (Zwick/Roell Z020) and loaded with a centre
point load at a loading rate of 3.55 N/s. The procedure was performed according to SFS-EN
12390-5 annexe A [51].Materials 2021, 14, 4758 10 of 19
Figure 5. Machine used for flexural testing.
3. Results and Discussion
3.1. Preliminary Compression Testing
The specimens prepared for preliminary compression testing were cured at 60 ◦ C
in an oven for 24 h and then for 48 h at room temperature as presented in [47]. Figure 6
presents the compressive strength values of the mixtures from lowest to highest strength.
Considering the highest compression strength results, an additional ten samples of the
materials 2 n and 3 n were tested. The average compressive strength values of both
materials are presented in Table 7.
Based on the compression test results, 3n was selected for the remainder of the material
and 3D printability parameter testing. The second variant of 3n was formulated with a
2% addition of recycled glass wool by replacing the same quantity of metakaolin and
labelled 1q. The geopolymers 3n and 1q are listed as A and B, respectively. The selected
geopolymers were tested for a precise assessment of setting time, shape stability, and
compressive and flexural strength.
The preliminary compression test results showed that ash alone did not proceed
effectively with sodium silicate. The bark boiler ash (over 10%) exhibited a short setting
time and consumed liquids before mixing with other materials, which resulted in dry and
unmixed materials. A greater amount of liquid, having a 1:1 water-to-reagent ratio, is
required to increase the ash quantity. The suitable performing mixture comprised 7% ash.
Figure 6. Compression values from initial compressive strength tests.Materials 2021, 14, 4758 11 of 19
Table 7. Compressive strength results for the materials 2 n and 3 n.
Material Sample Compressive Strength (MPa) (2 n) Compressive Strength (MPa) (3 n)
1 10.93 12.02
2 10.94 12.03
3 10.93 12.02
4 10.94 12.03
5 10.92 12.03
6 10.94 12.02
7 10.92 12.01
8 10.93 12.03
9 10.93 12.02
10 10.94 12.03
Mean value 10.932 12.024
The results indicated that C&D waste amounts over 27% had poor strength properties
and crumbled in the hand. Styrofoam spheres in the C&D waste negatively affect the
strength properties and create voids and cavities in the hardened geopolymer mix. The
suitable performing mixture comprised 10% C&D waste, which worked partially as an
aluminosilicate source and a substitute for sand fillers. The geopolymer mix containing
sand of less than 20% required high water-to-silicate ratios (greater than 1:1). The most
suitable mixture comprised 39% sand, with a 3.3:2 ratio between fine and coarse sands.
The moisture content in the sand caused the formation of undissolved clumps, which were
excluded by drying before mixing.
A geopolymer mixture comprising 13% metakaolin was found to be the most useful,
with other reactive materials at 20% or less. The mixture containing a lower volume of
metakaolin exhibited weak strength properties. A water-to-reagent ratio of between 3.7 and
4.2 provided the most suitable strength and workability properties. However, the strength
properties of the material decreased when the amount of water used was higher, which
was also described in the study of Ma et al. [43]. A liquid volume of 28–31% provided
a suitable geopolymer mixture. The addition of water to sodium silicate to decrease the
viscosity and enhance workability was also presented by Panda et al. [39,52].
The addition of glass wool resulted in better workability and low adherence to the
metallic surface. An additive enhancement of greater than 1% can result in clogging and
separate issues in extrudability [24,44]. Carbon fibre addition results in clogging and low
workability, which makes further assessment of the material unviable. The Al-to-Si ratio
of the best-functioning geopolymer mixtures was approximately 1:1.5. The Al-to-Si ratio
essentially influences the setting time and hardened properties.
3.2. Temperature Setting
The temperature setting test was conducted using the standard procedure for mea-
suring the initial setting time for concrete. The curve indicates the time required for the
material to reach the strength of 3.5 MPa (68.7 N), which is considered the endpoint for
the initial setting time. Figure 7 presents the setting development of material A, which
is presented as a line along with the measurement points. Material A reached a 60-N
resistance in 44 min at 20 ◦ C, 33 min at 40 ◦ C, 23 min at 60 ◦ C, and 22 min at 80 ◦ C. The
earliest point when the force was recorded from the samples was 12 min at 80 ◦ C, and the
latest value was 20 min at 20 ◦ C. The temperature setting of geopolymer B is presented
in Figure 8.Materials 2021, 14, 4758 12 of 19
Figure 7. Initial setting time of geopolymer A at various temperatures.
Figure 8. Initial setting time of geopolymer B at various temperatures.
The material reaches a 60-N resistance in 28 min at 20 ◦ C and 40 ◦ C and in 22 min at
60 ◦C and 80 ◦ C. The earliest point when the material exhibited sufficient strength for the
measurement was at 10 min at 80 ◦ C, and the latest was at 14 min at 20 ◦ C.
The initial setting time (penetration resistance of 60 N) for geopolymer A was 50%
shorter at 80 ◦ C and 47% shorter at 60 ◦ C than that at 20 ◦ C, which showed that the setting
time decreases at elevated temperatures. The rate of increase in setting time slows down
significantly at temperatures of 60–80 ◦ C, where the setting was only 3% faster. Both the
geopolymers reached a 60-N resistance at the same time (23 min) at a temperature of 60 ◦ C.
From the time that the resistance could first be measured, geopolymer B required 18% more
time to reach a 60-N resistance than geopolymer A. The glass-wool addition in geopolymer
B causes the material to set faster at lower temperatures as compared to geopolymer A.
The deformation drops by 61% for geopolymer A and 28% for geopolymer B when the
temperature is increased from 20 to 100 ◦ C. The application of heat for better shape stability
was tested by Kazemian et al. [44] for 3D printable non-geopolymer concrete. Depending
on the 3D printing application, the application of heat reduced the deformation by 71% [44].
Heat curing can shorten the curing time by 25 days if the material test is required to be
performed quickly in the absence of sufficient time, for instance, a month. In 3D printing
applications, the heat curing method is considered unsuitable in the majority of cases if the
entire printed object must be built in a heated cabinet, which would limit the size of the
objects and increase energy costs.
The geopolymerisation process is sped up at temperatures between 60 and 80 ◦ C, and
temperatures above 90 ◦ C can have a negative impact on the mechanical properties of
geopolymers. Dry-curing results in higher strengths in geopolymers than steam curing [29].Materials 2021, 14, 4758 13 of 19
Ambient curing at room temperature usually requires 28 days of curing to achieve the
same mechanical properties as 24-h oven-cured samples [24].
3.3. Shape Stability
The measured deformation (compression) of a 50-mm height cylinder of the material
A and B samples are presented in Figure 9. The deformation for geopolymer A was 8.2%
of the total height at a temperature of 20 ◦ C and 3.2% at 100 ◦ C. For geopolymer B, the
deformations were 5% and 3.6% at 20 and 100 ◦ C, respectively. The deformation of both
geopolymers during weight addition is illustrated in Figure 10. The total weight on the
geopolymers at the end of the test was 10.3 N, which equals approximately 5.3 kPa. After
the final weight addition, the deformation was found to be insignificant.
Figure 9. Shape stability of geopolymers A and B at 20 and 100 ◦ C [47].
Figure 10. Deformation of geopolymers A and B at 20 and 100 ◦ C [47].
Usually, the geopolymer was tested immediately after mixing, and a deformation of
2–6% was measured [29,39]. A similar deformation value was obtained in this research
task after a setting time of 10 min and with the application of heat. An optimal score for a
high-standard building project involved a zero-deformation rate. In terms of buildability
for the suggested open and setting times after mixing, the developed geopolymers wereMaterials 2021, 14, 4758 14 of 19
suitable for printing with a setting time of over 10 min without the application of heat.
The buildability increased as the material was allowed to set for a longer time before the
extrusion. The developed materials exhibited a 20-min extrusion limit and an 8–10-min
open time after mixing. In an optimal scenario, the deformation should be zero, which is
required for building projects of high standard.
3.4. Compressive Strength Test
The compressive strengths of cast and layered geopolymers A and B were measured
after seven and 28 days of curing at room temperature. The geopolymerisation process
for various geopolymers depends on the raw materials utilisation [53]. The results of the
compression tests are presented in Figure 11.
Figure 11. Compression strength of geopolymers A and B after 7 and 28 days of curing.
The compressive strength after curing (seven and 28 days) increased by an average of
62–63%. In the extruded specimens, for geopolymers A and B, the strength values increased
by 30.6% and 9.2%, respectively. The use of fibre additives decreased the compressive
strength because the fibres, or similar additives, that are parallel to the compressive loading
can act as voids in the geopolymer matrix [52]. The glass-wool addition lowered the
compressive strength of geopolymer B as compared to that of A, which followed the same
pattern of voids in the geopolymer matrix. The results illustrated that the cast vibrated
sample showed 16.5% lower strength than conventionally casted samples. According to
Nematollahi et al. [24], the vibration should compact the geopolymer paste more than plain
casting alone.
The density of the vibrated samples was 1.5% lower than that of the casted specimens.
The porosity was apparent in every casted and extruded specimen, even after vibrating the
fresh paste. This phenomenon explains the water evaporation in the chemical processes,
which occurred during the geopolymerisation. All the casted and layered samples exposed
during the compression testing fractured in the same manner, which is clas sified as a
satisfactory failure according to SFS-EN 12390-3 (2009) [49].
3.5. Flexural Strength Test
The results of the flexural strength tests conducted for the casted and layered samples
are presented in Figure 12, wherein the flexural specimens are viewed from above and
the sides. All the specimens with a horizontal layer had a visible layer in the middle. The
extrusion resulted in some uneven surface distributed along the length of the extrusion. A
few casted specimens of both the geopolymers comprised visible defect cavities, whichMaterials 2021, 14, 4758 15 of 19
were observed at the bottom of the samples. Except for the aforementioned observations,
all the samples exhibited an even consistency.
Figure 12. Flexural strength of specimens A and B after 7 and 28 days of curing and their variations [47].
The strength of the specimens comprising vertical layers increased by approximately
8%, with the only exception observed in the lower strength value of the layered sample
A after curing for 28 days. A decrease in strength of 13–16% was observed in the layered
samples and 5–13% in the cured specimens. The porosity, lower density, and strength
values of the flexural samples were identical to those of the compression samples. The
vibrated test pieces exhibited a 3% and 10% decrease in flexural strength as compared
to the casted specimens and vertically layered test pieces, respectively. In contrast to the
compressive strength, the use of fibre additives increased the flexural strength. The increase
in the flexural strength depended on the fibre length (3–6 mm or 8 mm) [24].
In this study, an increase in flexural strength of 15% was recorded between geopoly-
mers A and B, although glass wool was used instead of fibres. The fibre addition increased
the flexural strength, but also decreased the compressive strength, which could result in
difficulties if both are required to be maximised.
3.6. Density
The compressive and flexural strengths of the specimens were measured before con-
ducting tests for curing of seven and 28 days. The densities of the different samples are
listed in Table 8. Their weight was measured in grams with a two-decimal accuracy, and
the density was calculated by dividing the weight by the calculated volume. Shrinkage
was considered in the density calculation as the cross-section of the specimens was mea-
sured separately. Density measurements and calculations were not performed according to
the standards.
Table 8. Approximate density of cured geopolymers.
Sample A after 7-Days Sample A after 28-Days Sample B after 7-Days Sample B after 7-Days
Sample
Curing [kg/m3 ] Curing [kg/m3 ] Curing [kg/m3 ] Curing [kg/m3 ]
Casted 1693 1618 1752 1621
Extruded 1806 1635 1756 1666
Vibrated 1637 - - -Materials 2021, 14, 4758 16 of 19
The densities of the developed geopolymers were considerably lower than that of
the 3D printable geopolymers in other studies. The printed geopolymer densities were
observed to be 2050 and 2250 kg/m3 , while the densities of the casted samples were lower
at 1900 and 2150 kg/m3 , respectively [37,46]. The reported values were measured after
28 days of curing. The casted samples A and B in this study exhibited a decrease in density
of 4% and 7%, respectively, from seven to 28 days. The decrease in the density of the
extruded samples was 9% and 5% for the A and B geopolymers, respectively. The density
of the extruded samples after 28 days of curing was 1% and 3% higher than those of the
casted samples. In related studies, the density difference between the extruded and casted
samples was 5–8%. Vibration unexpectedly did not result in an increased density, but
instead caused a decrease in density of 3%. The average density was 25% lower in samples
cured for 28 days than those in other studies. The lower density directly corresponds to
the lower strength values that were observed in the property tests. The density can be
higher in printed components as compared to casted components because of the pumping
pressure in the extrusion phase [46].
The density of concrete differs depending on the density and quantity of the adopted
aggregates, number of aggregates, entrapped air, and binder combination. The elasticity,
tensile strength, and compression strength of concrete are influenced by the weight of the
aggregates. Lightweight concrete is feasible for application as a filler or for insulation
purposes. However, this type of concrete is unsuitable for structural purposes. The
mechanical properties of concrete are significantly dependent on its density. Denser
concrete typically has fewer voids and less porosity and provides greater strength. A
smaller number of voids reduces the water penetration in concrete and produces stronger
durability. Therefore, sufficient density and strength are required to sustain a particular
loading [54].
4. Conclusions
This study was conducted to examine the printing parameters (mixability, initial
workable time, extrudability, water-to-silicate ratio, silicate-to-binder ratio, Al-to-Si ratio,
and waste materials percentage) requirements for 3D printable geopolymer materials.
Specifications for 3D printable geopolymer materials in fresh (setting times, shape stability,
and buildability) and hardened (compressive strength and flexural strength) states were
investigated. In this study, local industrial side stream materials were used for 3D printable
geopolymer formulations. The key conclusions of this study are as follows:
1. The material properties of the developed geopolymer are considered suitable for 3D
printing with few prerequisites. The initial setting times of the geopolymers were
investigated at approximately 38 and 44 min, which could be accelerated with the
heat introduction.
2. Shape stability was observed in 8–10 min, which was enhanced by heating the geopoly-
mer between temperatures of 20 and 100 ◦ C.
3. The tested geopolymers cannot be extruded straight after mixing. Therefore, a con-
trolled setting is used in a separate buffer with possible heat introduction before
pumping it through an extrusion nozzle.
4. The buildability and shape stability are also increased if heat elements are attached to
the nozzle with trowels.
5. Printability was significantly improved with heat treatment and suitable mate-
rial proportions.
6. Decreasing the amount of recyclable materials used in the geopolymer mix increased
its comprehensive strength when commercial aluminosilicate materials were sub-
stituted. Flexural strength can be enhanced with additives, which is in contrast to
the case of compressive strength. The use of vibration or continuous glass fibre
strings could not improve the strength properties of geopolymers, which indicates
that alternative solutions are required to enhance the strength properties.Materials 2021, 14, 4758 17 of 19
7. The development of a 3D printable geopolymer material entirely from recycled mate-
rials or waste products is challenging. The use of recycled materials in geopolymers
containing aluminium/silicon alone is inadequate for material development. The
ash, C&D waste, and separate side streams should be used in a suitable ratio of the
elements favourable for geopolymerisation. Nevertheless, it can be concluded that
recyclable products can be applied in higher volumes in 3D printable materials even
as fillers.
8. The compressive strength of geopolymer concrete realised in this research work has
potential applications in utility bedding, backfill walls, retaining walls or trenches, fill-
ing of sewers, tunnel-shaft construction, bedding materials for pipes, pathways, bed-
ding for footing, pavement kerbs, patio slabs, noise barrier walls, and non-structural
work. However, in the future, the aforementioned strength properties can be im-
proved via extensive pre-processing of the recycled materials (e.g., sieving Styrofoam
out of C&D waste, etc.) and by using suitable alkaline reagent ratios. The improved
compressive strength material has potential for application in structural work.
Author Contributions: Conceptualization, Q.M. and T.K.; methodology, Q.M. and R.P.; validation,
Q.M. and T.K.; investigation, R.P. and T.K.; data curation, Q.M., R.P. and T.K.; writing—original
draft preparation, Q.M. and T.K.; writing—review and editing, Q.M. and T.K.; visualization T.K. All
authors have read and agreed to the published version of the manuscript.
Funding: This research received no external funding.
Institutional Review Board Statement: Not applicable.
Informed Consent Statement: Not applicable.
Data Availability Statement: The data presented in this study are available on request from the
corresponding author.
Conflicts of Interest: The authors declare no conflict of interest.
References
1. Wu, P.; Wang, J.; Wang, X. A critical review of the use of 3-D printing in the construction industry. Autom. Constr. 2016, 68, 21–31.
[CrossRef]
2. Labonnote, N.; Rønnquist, A.; Manum, B.; Rüther, P. Additive construction: State-of-the-art, challenges and opportunities. Autom.
Constr. 2016, 72, 347–366. [CrossRef]
3. Al Rashid, A.; Khan, S.; G. Al-Ghamdi, S.; Koç, M. Additive manufacturing: Technology, applications, markets, and opportunities
for the built environment. Autom. Constr. 2020, 118, 103268. [CrossRef]
4. Pérez, M.; Carou, D.; Rubio, E.; Teti, R. Current advances in additive manufacturing. Procedia CIRP 2020, 88, 439–444. [CrossRef]
5. Tankova, T.; da Silva, L. Robotics and Additive Manufacturing in the Construction Industry. Curr. Robot. Rep. 2020, 1, 13–18.
[CrossRef]
6. Rane, K.; Strano, M. A comprehensive review of extrusion-based additive manufacturing processes for rapid production of
metallic and ceramic parts. Adv. Manuf. 2019, 7, 155–173. [CrossRef]
7. Panda, B.; Tan, M. Experimental study on mix proportion and fresh properties of fly ash based geopolymer for 3D concrete
printing. Ceram. Int. 2018, 44, 10258–10265. [CrossRef]
8. Paolini, A.; Kollmannsberger, S.; Rank, E. Additive manufacturing in construction: A review on processes, applications, and
digital planning methods. Addit. Manuf. 2019, 30, 100894. [CrossRef]
9. Bikas, H.; Stavridis, J.; Stavropoulos, P.; Chryssolouris, G. A Design Framework to Replace Conventional Manufacturing Processes
with Additive Manufacturing for Structural Components: A Formula Student Case Study. Procedia CIRP 2016, 57, 710–715.
[CrossRef]
10. Buswell, R.; Leal de Silva, W.; Jones, S.; Dirrenberger, J. 3D printing using concrete extrusion: A roadmap for research. Cem. Concr.
Res. 2018, 112, 37–49. [CrossRef]
11. Mohan, M.; Rahul, A.; De Schutter, G.; Van Tittelboom, K. Extrusion-based concrete 3D printing from a material perspective: A
state-of-the-art review. Cem. Concr. Compos. 2021, 115, 103855.
12. Lim, J.; Panda, B.; Pham, Q. Improving flexural characteristics of 3D printed geopolymer composites with in-process steel cable
reinforcement. Constr. Build. Mater. 2018, 178, 32–41. [CrossRef]
13. Zhang, D.; Wang, D.; Lin, X.; Zhang, T. The study of the structure rebuilding and yield stress of 3D printing geopolymer pastes.
Constr. Build. Mater. 2018, 184, 575–580. [CrossRef]Materials 2021, 14, 4758 18 of 19
14. Al-Qutaifi, S.; Nazari, A.; Bagheri, A. Mechanical properties of layered geopolymer structures applicable in concrete 3D-printing.
Constr. Build. Mater. 2018, 176, 690–699. [CrossRef]
15. Ma, G.; Li, Z.; Wang, L.; Bai, G. Micro-cable reinforced geopolymer composite for extrusion-based 3D printing. Mater. Lett. 2019,
235, 144–147. [CrossRef]
16. Asprone, D.; Auricchio, F.; Menna, C.; Mercuri, V. 3D printing of reinforced concrete elements: Technology and design approach.
Constr. Build. Mater. 2018, 165, 218–231. [CrossRef]
17. Panda, B.; Noor Mohamed, N.; Paul, S.; Bhagath Singh, G.; Tan, M.; Šavija, B. The Effect of Material Fresh Properties and Process
Parameters on Buildability and Interlayer Adhesion of 3D Printed Concrete. Materials 2019, 12, 2149. [CrossRef]
18. Chen, M.; Li, L.; Zheng, Y.; Zhao, P.; Lu, L.; Cheng, X. Rheological and mechanical properties of admixtures modified 3D printing
sulphoaluminate cementitious materials. Constr. Build. Mater. 2018, 189, 601–611. [CrossRef]
19. Chen, Y.; Chaves Figueiredo, S.; Yalçinkaya, Ç.; Çopuroğlu, O.; Veer, F.; Schlangen, E. The Effect of Viscosity-Modifying Admixture
on the Extrudability of Limestone and Calcined Clay-Based Cementitious Material for Extrusion-Based 3D Concrete Printing.
Materials 2019, 12, 1374. [CrossRef]
20. Ma, G.; Salman, N.; Wang, L.; Wang, F. A novel additive mortar leveraging internal curing for enhancing interlayer bonding of
cementitious composite for 3D printing. Constr. Build. Mater. 2020, 244, 118305. [CrossRef]
21. Zhang, G.; Yang, H.; Ju, C.; Yang, Y. Novel selection of environment-friendly cementitious materials for winter construction:
Alkali-activated slag/Portland cement. J. Clean. Prod. 2020, 258, 120592. [CrossRef]
22. Nikolov, A.; Rostovsky, I.; Nugteren, H. Geopolymer materials based on natural zeolite. Case Stud. Constr. Mater. 2017, 6, 198–205.
[CrossRef]
23. Nematollahi, B.; Xia, M.; Sanjayan, J.; Vijay, P. Effect of Type of Fiber on Inter-Layer Bond and Flexural Strengths of Extrusion-Based
3D Printed Geopolymer. Mater. Sci. Forum 2018, 939, 155–162. [CrossRef]
24. Nematollahi, B.; Sanjayan, J.; Shaikh, F. Synthesis of heat and ambient cured one-part geopolymer mixes with different grades of
sodium silicate. Ceram. Int. 2015, 41, 5696–5704. [CrossRef]
25. Nematollahi, B.; Sanjayan, J. Effect of different superplasticizers and activator combinations on workability and strength of fly
ash based geopolymer. Mater. Des. 2014, 57, 667–672. [CrossRef]
26. Ueng, T.; Lyu, S.; Chu, H.; Lee, H.; Wang, T. Adhesion at interface of geopolymer and cement mortar under compression: An
experimental study. Constr. Build. Mater. 2012, 35, 204–210. [CrossRef]
27. Ma, C.; Awang, A.; Omar, W. Structural and material performance of geopolymer concrete: A review. Constr. Build. Mater. 2018,
186, 90–102. [CrossRef]
28. Zain, H.; Abdullah, M.; Hussin, K.; Ariffin, N.; Bayuaji, R. Review on Various Types of Geopolymer Materials with the Environ-
mental Impact Assessment. In Proceedings of the MATEC Web Conference, Sibiu, Romania, 7–9 June 2017; Volume 97, p. 01021.
29. Menegaki, M.; Damigos, D. A review on current situation and challenges of construction and demolition waste management.
Curr. Opin. Green Sustain. Chem. 2018, 13, 8–15. [CrossRef]
30. Construction & Demolition Waste, Cembureau.Eu. 2021. Available online: https://cembureau.eu/policy-focus/sustainable-
construction/construction-demolition-waste/ (accessed on 21 June 2021).
31. Bacher, J.; Laine-Ylijoki, J.; Luoranen, M. Directions of Future Developments in Waste Recycling; Meinander, M., Mroueh, U.-M., Eds.;
JULKAISIJA–UTGIVARE, (Tekniikantie 4 A, Espoo); VTT Technical Research Centre of Finland: Esper, Finland, 2021; Available
online: http://www.vtt.fi/publications/index.jsp (accessed on 21 June 2021).
32. Liikanen, M.; Havukalnen, J.; Grönman, K.; Horttanalnen, M. Constructiion and demolition waste streams from the material
recovery point of view: A case study of the South Karelia region, Finland. Waste Manag. Environ. IX 2018. [CrossRef]
33. Duan, Z.; Hou, S.; Xiao, J.; Li, B. Study on the essential properties of recycled powders from construction and demolition waste. J.
Clean. Prod. 2020, 253, 119865. [CrossRef]
34. Letelier, V.; Ortega, J.; Muñoz, P.; Tarela, E.; Moriconi, G. Influence of Waste Brick Powder in the Mechanical Properties of
Recycled Aggregate Concrete. Sustainability 2018, 10, 1037. [CrossRef]
35. Ortega, J.; Letelier, V.; Solas, C.; Moriconi, G.; Climent, M.; Sánchez, I. Long-term effects of waste brick powder addition in the
microstructure and service properties of mortars. Constr. Build. Mater. 2018, 182, 691–702. [CrossRef]
36. Xiao, J.; Ma, Z.; Sui, T.; Akbarnezhad, A.; Duan, Z. Mechanical properties of concrete mixed with recycled powder produced from
construction and demolition waste. J. Clean. Prod. 2018, 188, 720–731. [CrossRef]
37. Panda, B.; Paul, S.; Mohamed, N.; Tay, Y.; Tan, M. Measurement of tensile bond strength of 3D printed geopolymer mortar.
Measurement 2018, 113, 108–116. [CrossRef]
38. Paul, S.; Tay, Y.; Panda, B.; Tan, M. Fresh and hardened properties of 3D printable cementitious materials for building and
construction. Arch. Civ. Mech. Eng. 2018, 18, 311–319. [CrossRef]
39. Panda, B.; Mohamed, N.A.N.; Tay, D.Y.W.; He, L.; Tan, M. Effects of slag addition on bond strength of 3D printed geopolymer
mortar: An experimental investigation. In Proceedings of the 3rd International Conference on Progress in Additive Manufacturing
(Pro-AM 2018), Nanyang Technological University; Singapore, 4–17 May 2018, 17 May 2018; pp. 62–67. Available online: https:
//hdl.handle.net/10356/88254 (accessed on 21 June 2021).
40. Lechner, P.; Hartmann, C.; Ettemeyer, F.; Volk, W. A Plane Stress Failure Criterion for Inorganically-Bound Core Materials.
Materials 2021, 14, 247. [CrossRef]Materials 2021, 14, 4758 19 of 19
41. Stauder, B.; Berbic, M.; Schumacher, P. Mohr-Coulomb failure criterion from unidirectional mechanical testing of sand cores after
thermal exposure. J. Mater. Process. Technol. 2019, 274, 116274. [CrossRef]
42. Paul, S.; van Zijl, G.; Tan, M.; Gibson, I. A review of 3D concrete printing systems and materials properties: Current status and
future research prospects. Rapid Prototyp. J. 2018, 24, 784–798. [CrossRef]
43. Ma, G.; Wang, L.; Ju, Y. State-of-the-art of 3D printing technology of cementitious material—An emerging technique for
construction. Sci. China Technol. Sci. 2017, 61, 475–495. [CrossRef]
44. Kazemian, A.; Yuan, X.; Cochran, E.; Khoshnevis, B. Cementitious materials for construction-scale 3D printing: Laboratory testing
of fresh printing mixture. Constr. Build. Mater. 2017, 145, 639–647. [CrossRef]
45. Adam, A.; Horianto, X. The Effect of Temperature and Duration of Curing on the Strength of Fly Ash Based Geopolymer Mortar.
Procedia Eng. 2014, 95, 410–414.
46. Panda, B.; Paul, S.; Hui, L.; Tay, Y.; Tan, M. Additive manufacturing of geopolymer for sustainable built environment. J. Clean.
Prod. 2017, 167, 281–288. [CrossRef]
47. Peltonen, R. Process Solutions of Extrusion-based Additive Manufacturing for Geopolymers and 3D Printable Material Properties.
Master’s Thesis, Lappeenranta University of Technology (LUT), Lappeenranta, Finland, 2019. Available online: https://lutpub.
lut.fi/handle/10024/159328 (accessed on 11 April 2021).
48. ASTM C403/C403M-08. Standard Test Method for Time of Setting of Concrete Mixtures by Penetration Resistance; American Society of
Testing and Materials: West Conshohocken, PA, USA, 2008; p. 7.
49. SFS-EN 12390-3. Testing Hardened Concrete. Part 3: Compressive Strength of Test Specimens; Finnish Standards Association: Helsinki,
Finland, 2009; p. 19.
50. SFS-EN 196-1. Methods of Testing Cement. Part 1: Determination of Strength; Finnish Standards Association: Helsinki, Finland,
2016; p. 32.
51. SFS-EN 12390-5. Testing Hardened Concrete. Part 5: Flexural Strength of Test Specimens; Finnish Standards Association: Helsinki,
Finland, 2009; p. 11.
52. Panda, B.; Chandra Paul, S.; Jen Tan, M. Anisotropic mechanical performance of 3D printed fiber reinforced sustainable
construction material. Mater. Lett. 2017, 209, 146–149. [CrossRef]
53. Duxson, P.; Fernández-Jiménez, A.; Provis, J.; Lukey, G.; Palomo, A.; van Deventer, J. Geopolymer technology: The current state
of the art. J. Mater. Sci. 2006, 42, 2917–2933. [CrossRef]
54. Daukšys, M.; Pocius, R.; Venčkauskas, L.; Augonis, M.; Kelpša, Š. Influence of the concrete mixture compaction time on density
and compressive strength of hardened concrete samples. J. Sustain. Archit. Civ. Eng. 2015, 11, 79–87. [CrossRef]You can also read