3D-Printed Bioreactor with Integrated Impedance Spectroscopy for Cell Barrier Monitoring
←
→
Page content transcription
If your browser does not render page correctly, please read the page content below
Research Article
www.advmattechnol.de
3D-Printed Bioreactor with Integrated Impedance
Spectroscopy for Cell Barrier Monitoring
Georg Linz, Sebastian Bernhard Rauer, Yasmin Kuhn, Simon Wennemaring,
Laura Siedler, Smriti Singh, and Matthias Wessling*
ever, this barrier function of epithelial and
Cell culture experiments often suffer from limited commercial availability endothelial tissues can pose a significant
of laboratory-scale bioreactors, which allow experiments to be conducted obstacle like in the case of blood–brain
under flow conditions and additional online monitoring techniques. A novel barrier where the cellular barrier also hin-
3D-printed bioreactor with a homogeneously distributed flow field enabling ders therapeutic substances from entering
and thereby reaching target tissues in the
epithelial cell culture experiments and online barrier monitoring by integrated body.[2] The recent pandemic of SARS-
electrodes through electrical impedance spectroscopy (EIS) is presented. CoV-2 accesses the host cells through the
Transparent and conductive indium tin oxide glass as current-injecting receptors on the lung alveolar barrier.[3]
electrodes allows direct visualization of the cells, while measuring EIS Therefore, understanding the pathophysi-
simultaneously. The bioreactor’s design considers the importance of a ology of various cellular barriers is cru-
cial for fundamental and pharmaceutical
homogeneous electric field by placing the voltage pick-up electrodes in the
research.[4]
electrical field. The device’s functionality is demonstrated by the cultivation of The standard technique for in vitro cell
the epithelial cell line Caco-2 under continuous flow and monitoring of the cell barrier experiments is the static cultiva-
layer by online EIS. The collected EIS data were fitted by an equivalent electric tion of epithelial or endothelial cells on
circuit, resulting in the cell layer’s resistance and capacitance. This data is used semipermeable membranes in transwell
to monitor the cell layer’s reaction to ethylene glycol-bis-(2-aminoethyl ether)- inserts, which allow access to the apical
and basal sides of the cell layer. How-
N,N,N′,N′-tetraacetic acid and forskolin. These two model substances show ever, standard in vitro cultivation cannot
the power of impedance spectroscopy as a non-invasive way to characterize cell mimic the complex physiological condi-
barriers. In addition, the bioreactor design is available as a print-ready file in the tions present within the human body,
Appendix, enabling its use for other scientific institutions. such as the exposure of cells to shear
stress in their natural environment. To
mimic the respective in vivo environment
1. Introduction in in vitro models, “organ-on-a-chip” research targets the engi-
neering of bioreactor systems to provide a higher degree of
Barrier-forming epithelial and endothelial tissues possess a physiology.[5]
unique ability to form cell-to-cell connecting tight junctions The main prerequisite for conducting experiments on bio-
that create compartmentalization in multicellular organisms logical barriers is to ensure barrier integrity. The most promi-
and prevent unhindered diffusion across cellular barriers.[1] The nent barrier integrity tests are either based on the retention of
ability to regulate the transport of molecules is essential in sup- macromolecules, non-invasive electrical resistance, or imped-
plying tissues with nutrients, removing toxic compounds, or ance measurements.[6] Electrical impedance is the extension
preventing the invasion of pathogens into deeper tissues. How- of Ohm’s law from direct current to alternating current. The
impedance Z is defined as the quotient of the time-dependent
G. Linz, Dr. S. Singh, Prof. M. Wessling voltage Ut and current It. The general approach for electrical
DWI-Leibniz-Institut für Interaktive Materialien impedance spectroscopy (EIS) is to apply a small voltage or
Forckenbeckstraße 50, 52074 Aachen, Germany current with varying frequencies to electrodes and measure
S. B. Rauer, Y. Kuhn, S. Wennemaring, L. Siedler, Prof. M. Wessling the resulting current or voltage. By fitting the EIS spectra to
RWTH Aachen University, Chemical Process Engineering
an equivalent electric circuit, different transport phenomena
Forckenbeckstraße 51, 52074 Aachen, Germany
E-mail: Manuscripts.cvt@avt.rwth-aachen.de across a barrier can be extracted.[7]
The ORCID identification number(s) for the author(s) of this article In this study, we aimed to present a 3D printed micro bio-
can be found under https://doi.org/10.1002/admt.202100009. reactor for the cultivation of epithelial cells with EIS. The inte-
© 2021 The Authors. Advanced Materials Technologies published by
grated four-electrode EIS allows online monitoring of the cell
Wiley-VCH GmbH. This is an open access article under the terms of the barrier resistance and capacitance. We demonstrated the reac-
Creative Commons Attribution-NonCommercial License, which permits tor’s functionality by cultivating Caco-2 epithelial cells under
use, distribution and reproduction in any medium, provided the original continuous flow conditions, as well as monitoring the reaction
work is properly cited and is not used for commercial purposes. to ethylene glycol-bis-(2-aminoethyl ether)-N,N,N′,N′-tetraacetic
DOI: 10.1002/admt.202100009 acid (EGTA) and forskolin by EIS.
Adv. Mater. Technol. 2021, 2100009 2100009 (1 of 7) © 2021 The Authors. Advanced Materials Technologies published by Wiley-VCH GmbH
www.advancedsciencenews.com                                                                                                   www.advmattechnol.de

2. Background                                                              electrodes for resistance measurement can be used for EIS. The
                                                                           input signal needs to be changed from direct current or single
Fluid shear stress can be applied to cells by continuous perfu-            frequency, as used in voltohmmeter (EVOM or Millicell), to a
sion of a medium in a cell culture bioreactor.[8–11]                       frequency spectrum.[29] In cell-barrier research, often frequen-
   For example, epithelial cells lining the walls of the gastroin-         cies from 10 Hz to 100 kHz are used. Impedance spectroscopy
testinal tract are continuously exposed to shear stress resulting          has two significant advantages compared to resistance meas-
from in vivo peristaltic movement. These mechanical forces on              urements. First, the contribution of the cell layer resistance can
the cell barrier are of major importance for their differentiation         be distinguished from medium resistance without measuring a
and function.[12] To accurately mimic the natural cellular envi-           blank probe without cells. Second, the cell layer capacitance can
ronment and therefore provide a physiological culture environ-             be extracted from the impedance spectrum, which can also be
ment, incorporating the latter physical factor into the bioreactor         used to monitor cell layers.[30,31]
system is necessary. A defined medium flow during cultivation
yields specific shear stress on the cells. Typical shear stress
in the human intestine was reported to range from 0.002 to                 2.3. Importance of Four Electrode Impedance Spectroscopy
0.08 dyne cm−2.[13] Furthermore, the application of fluid shear
stress on cells was found to stimulate cell proliferation and              Electric current applied to electrodes inside a conductive solu-
accelerate the differentiation process.[8,12,14]                           tion evokes counter-charged ions to move toward the elec-
                                                                           trode and form an ionic double layer. The electrode/electrolyte
                                                                           interface stores charges and hence behaves as a capacitor. The
2.1. Additive Manufacturing for Bioreactor Designs                         formation of an electric double-layer on the surface of a current-
                                                                           carrying electrode and the measurement of associated frequency-
Most tissue reactor designs on micro-scale rely on polydimethyl-           dependent impedance is a major challenge in EIS on biological
siloxane (PDMS)-based replica molding.[15] Even though this                materials because the impedance of such an electrode/electrolyte
fabrication technique is a valuable tool in disease modeling and           layer is similar to that of a biological barrier. The electric double-
other organ-on-chip applications, device design and fabrication            layer impedance depends on the electrolyte’s conductivity and
require special facilities.[16] Direct additive manufacturing of           temperature, electrode structure, composition, and roughness,
tissue reactors offers an alternative to replica molding to over-          and adds a great uncertainty to the system, which can lead to
come the limitation of layered structures and extend the devices           possible misinterpretation of the impedance spectrum.[32] This
to a 3D complexity.[17] We showed a combination of PDMS-based              electrode surface effect should be considered in EIS. Efforts have
replica molding and 3D printing as a valuable tool for high pre-           been made to minimize the double-layer formation by platiniza-
cision nanofabrication[18] and the complete replacement of a               tion of electrodes,[33] considering the formation in the equivalent
molding method for reactor fabrication.[19] The latter example             electrical circuit,[25] or by using four electrodes to separate the
uses a polyjet printer that can print a polyethylene-like polymer          current-carrying electrodes from the measuring electrode.[34]
with high resolution and high fabrication speed. This printer has             In the case of a four-electrode setup, additional considera-
already been in use for producing customized tissue reactors.[20,21]       tions are necessary with regard to the placement of the elec-
Regardless of the tissue reactor fabrication method, the integra-          trodes within the micro-bioreactor. In this context, geometrical
tion of microsensors enables non-invasive online analytics and is          effects, especially, may alter the impedance spectra significantly.
valuable in the operation of a microreactor. Metabolite concentra-         Therefore, the potential pick-up electrodes must be placed to
tion, dissolved oxygen, and pH,[22] and with a focus on barrier-           prevent the shifting of the equipotential lines between high and
forming tissue, resistance measurement,[23] are of great interest.         low-frequency.[35] Other sources of errors in four-electrode EIS
                                                                           are presented by Grimnes and Martinsen.[36] They described
                                                                           unwanted phase-shifts between current and voltage when sepa-
2.2. Electrode Integration for EIS                                         rate current paths exist, making standard electric circuit fitting
                                                                           impossible. Additionally, not all areas contribute equally to the
Placing electrodes inside the microenvironment of a bioreactor             impedance. Areas closer to the electrodes contribute more to
is challenging due to the limited space. Various approaches                overall resistance than areas located further away.[37]
have been presented in the literature. Some methods include                   A possibility for minimizing the contribution of geometrical
the patterning of the upper and lower surfaces of the cultiva-             and electrode surface effects on the impedance is the applica-
tion chamber with electrodes by sputtering,[24] printing,[14]              tion of a modified Ussing chamber.[38] Two current-carrying
or inserting metal wires into the device.[25] We used a hybrid             electrodes are adjusted planar to the cell layer, and the voltage
method in which the complete upper and lower areas of the cul-             pick-up electrodes are placed axially to the homogeneous field.
tivation chamber are a current-carrying electrode producing an
almost homogeneous electrical field along the x-y-plane. Addi-
tionally, two platinum wires were placed in the homogeneous                2.4. Electric Circuit Modeling
electrical field and proximity to the cell barrier, functioning as
voltage pick-up electrodes. This electrode configuration allows            Our approach for the development of the used equivalent elec-
EIS without unwanted phase-shifts between voltage and cur-                 tric circuit for a cell layer is explained in detail elsewhere.[29] In
rent and enables electric circuit fitting.                                 short, layers of epithelial or endothelial cells are often modeled
   Often, integrated electrodes are only used to calculate                 as a resistor and capacitor in parallel. The resistor represents
resistance and not impedance.[26–28] In principle, integrated              the ability to allow ions to pass through the paracellular and

Adv. Mater. Technol. 2021, 2100009     2100009 (2 of 7)                © 2021 The Authors. Advanced Materials Technologies published by Wiley-VCH GmbH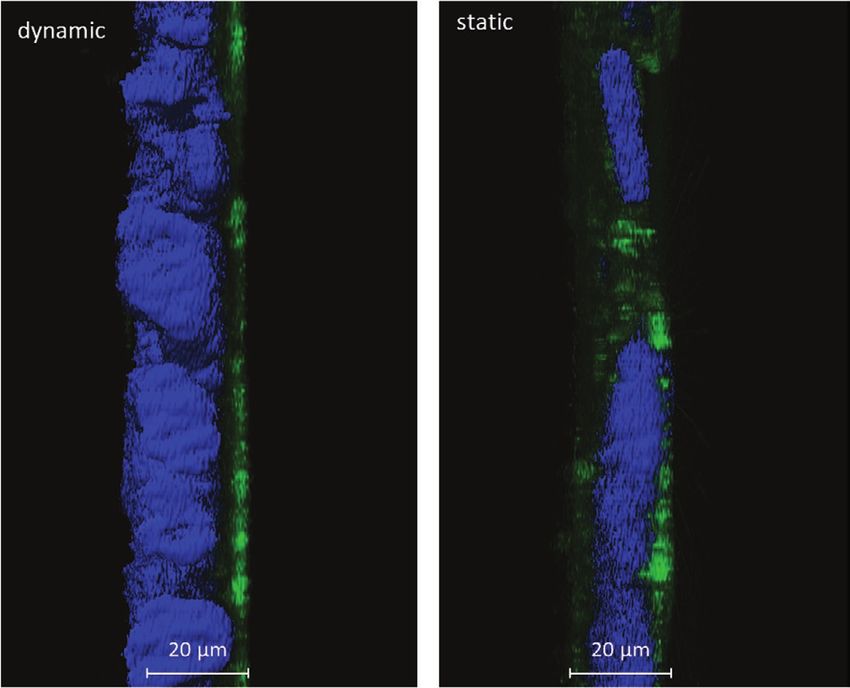
www.advancedsciencenews.com                                                                                                           www.advmattechnol.de

transcellular pathways, and is therefore widely used as a para-                   for increasing the shear rate. However, smaller chamber
meter for the cell layer’s integrity.[4,31] The capacitor represents              dimensions also complicate the integration of the voltage pick-
the impermeability of the phospholipid membrane toward ions                       up electrodes necessary for EIS measurements. Another pos-
and the corresponding formation of an ionic double-layer on                       sibility for a higher shear rate would be bigger inlet and outlet
the membrane surfaces. Therefore, the capacitance can be                          channels, which would allow higher flow rates without the for-
used to detect alterations associated with the cell membrane,                     mation of vortices.
and further analyze folding,[39] variation in membrane composi-                      Electrical field simulations allow for the visualization of
tion,[40] and cell-substrate interaction.[29]                                     the homogeneity of the electric field, while sensitivity studies
                                                                                  reflect the contribution of a given volume or area to the total
                                                                                  impedance. In Figure 2, the electric field between the current-
3. Results and Discussion                                                         carrying electrodes is highlighted. The membrane with the cell-
                                                                                  layer is located in the middle of the device orthogonal to the
3.1. Simulation                                                                   electric field lines. The sensitivity distribution at the cell culture
                                                                                  location is presented in Figure 2B. The sensitivity plot shows
The fluid flow simulation reveals laminar and homogeneous                         for most of the cultivation area, a homogeneous distribution.
flow distribution from 0.05 to 5.00 mL min-1. Representative                      Only the edges possess a higher sensitivity due to the device
of all simulated flow velocities is the streamlines shown in                      geometry. On the one hand, a broader cultivation area would
Figure 1 in the left upper corner. The simulated streamlines vis-                 lead to a lower sensitivity distribution. On the other hand, the
ualize the box plot results and demonstrate the presence of an                    fluid shear stress distribution would be broadened. In the bio-
equally distributed flow regime in the chamber located above                      reactor presented, a compromise was made between the sensi-
the cultivation membrane. The box plot in Figure 1 shows only                     tivity and flow field distributions.
a slight increase in the shear rate distribution by an increase in
the flow rate of up to 5.00 mL min-1. A further increase in the
flow rate causes vortices in the cultivation chamber, which leads                 3.2. Electrochemical Impedance Spectroscopy
to a broader distribution of shear rates in the cultivation area.
   However, the fluid simulation shows that the shear rate can                    According to the theory of separating the current-carrying elec-
be tailored according to the specific cell or experimental needs                  trodes from voltage-sensing electrodes, no double-layer forma-
by varying the pump rate. In the presented bioreactor, a shear                    tion can be observed. Therefore, only ohmic resistance from
rate up to 0.2 dyne cm-2 can be applied. Higher shear rates                       the media, electrodes, and membrane can be measured without
might be of interest for the cultivation of endothelial cells but                 a significant phase shift between voltage and current, when no
cannot be achieved with the current reactor design. Reducing                      cells are in the bioreactor. The Nyquist plot representation of an
the cultivation chamber height presents one possible solution                     EIS measurement without a cell layer can be seen in Figure 3,
                                                                                  which indicates the frequency-independent impedance of a
                                                                                  pure resistor.
                                                                                     A complete cell layer equivalent electric circuit would sepa-
                                                                                  rate the paracellular- and transcellular pathways by taking both
                                                                                  into account as a resistor. However, since paracellular and tran-
                                                                                  scellular pathways are resistors in parallel and therefore not dis-
                                                                                  tinguishable by EIS, an additional method, for example, tracer
                                                                                  substances, should be used.[41] If not, both resistances can be
                                                                                  modeled as one. Additionally, to paracellular and transcellular
                                                                                  pathways, the apical and basal cell membranes should be con-
                                                                                  sidered in the equivalent electric circuit as capacitors parallel
                                                                                  to a resistor. If the charged species’ transport characteristics
                                                                                  are similar between the apical and basal sides, the contribu-
                                                                                  tions are also not distinguishable and can be summarized.
                                                                                  Therefore, the simplest equivalent electric circuit for a cell layer
                                                                                  is one resistor and one capacitor in parallel. Still, during cell
                                                                                  layer development or the variation of experimental conditions,
                                                                                  the contributions may vary, and apical and basal sides should
                                                                                  be considered separately. If the apical side differs significantly
                                                                                  from the basal side, two semicircles appear in the Nyquist plot.
                                                                                  This is, for example, the case when the cell layer was in contact
                                                                                  with forskolin, as indicated in Figure 3.
                                                                                     The EIS results were not presented normalized to the culti-
Figure 1. The box plot representation shows the mean value and the dis-
                                                                                  vation area (Ωcm2 or Fcm−2). Previous studies showed that the
tribution of the simulated shear stress at three different flow rates on the
membrane surface grouped by quartiles (boxes and bars). On the left               pure normalization of the surface is erroneous;[37] in the case
upper corner, the streamlines indicate a homogeneous fluid distribution           of fixed electrodes, data derived from the same chip is readily
inside the bioreactor without vortices above the cultivation area.                comparable.[24]

Adv. Mater. Technol. 2021, 2100009          2100009 (3 of 7)                   © 2021 The Authors. Advanced Materials Technologies published by Wiley-VCH GmbH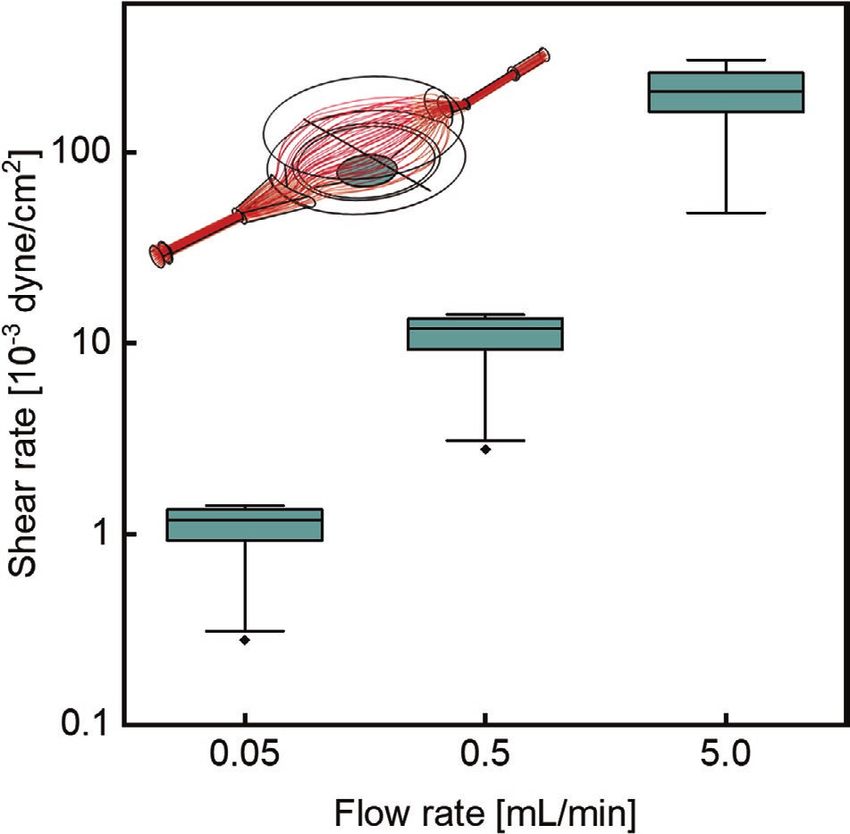
www.advancedsciencenews.com                                                                                                           www.advmattechnol.de

Figure 2. A) The COMSOL simulation of the electric field between the current-injecting electrodes revealed a homogeneous distribution. B) The sen-
sitivity analysis showed for most of the cultivation area a homogeneous sensitivity distribution.

3.3. Cultivation Experiments                                                      of the cells online. The resistance and cell layer capacitance of
                                                                                  14 days cultivation can be found in Supporting Information.
The confocal images in Figure 4 of static cultivated cells in                        The addition of EGTA or forskolin demonstrated the ver-
transwell inserts and dynamic cultivated Caco-2 cells reveal                      satility of EIS. EGTA complexes calcium ions, which are then
the importance of mimicking the fluid shear stress cells are                      no longer available for the formation of tight junctions. The
exposed to in vivo.                                                               tight junction protein complex is mainly responsible for the
   The morphology of static cultivated cells showed a uniform                     paracellular electrical resistance. Figure 6 shows the course
distribution of the actin filament, as well as a layer thickness                  of resistance and capacitance after contact with EGTA, and
of around 20 µm. In contrast, dynamically cultured cells, which                   the recovery when the calcium-containing medium again sur-
were continuously exposed to shear stress, demonstrate disloca-                   rounds the cells. EGTA reduces the resistance by more than
tion of the actin filament to the membrane side, as well as an                    half, while the capacitance only reduces slightly. After changing
increase in the cell layer thickness.                                             the medium back to an EGTA-free medium, the resistance
   The introduced bioreactor allows visualization of the cells                    and capacitance recover to their starting value. The resistance
during cultivation. Therefore, sources of interference, such as                   needed about 3 h for recovery, whereas the capacitance recov-
air bubbles, can be recognized, and cellular proliferation and                    ered almost immediately.
macroscopic changes regarding the cell layer can be readily
observed. A picture of the cell layer at the beginning of a cul-
tivation and a fully developed barrier can be seen in Figure 5C.
In addition to visual observation, EIS allows the monitoring

Figure 3. EIS measurement of a Caco-2 layer between 10 Hz and 30 kHz
in Nyquist plot representation before and 2 min after the contact with
forskolin. The cell layer was fitted with two RC-Elements in series, taking       Figure 4. Lateral view of dynamic and static cultivated Caco-2 cell layers.
the apical and basal sides into account (Pearson’s correlation Z’ r > 0.95,       The left side reflects the fluid side of the cells and the right side, their
Z” r > 0.70). Additionally, an EIS spectrum of the medium without a cell          membrane side. The actin filament (green) was stained with Phalloidin
layer is presented for comparison. The fitting values can be found in Sup-        Alexa Fluor 488 and the cell nucleus with DAPI. Pictures were taken with
plementary Information.                                                           a Leica SP8 confocal microscope.

Adv. Mater. Technol. 2021, 2100009         2100009 (4 of 7)                   © 2021 The Authors. Advanced Materials Technologies published by Wiley-VCH GmbH
www.advancedsciencenews.com www.advmattechnol.de
Figure 5. A) CAD model of the bioreactor displaying the two half cells with a membrane in between. The two glass slides on top and below serve
as current-injecting electrodes, and the wires through the upper and lower cultivation chambers are the voltage pick-up electrodes. B) Image of the
assembled bioreactor. C) Microscopy images of Caco-2 cells cultivated in the bioreactor after one day (upper image) and after 10 days (lower image).
The shadows from left to right are the platinum wires serving as voltage pick-up electrodes. The scale bar represents 500 µm.
The capacitance arises from the double-layer formation of 4. Conclusion
ions on the boundary layer between the ion-impermeable cell
membrane and conductive electrolyte. The rapid restoration of We demonstrated the versatility of rapid prototyping in bio-
the original capacitance illustrates the low interaction between reactor design or organ-on-a-chip technologies by including
EGTA and the cell membrane. The comparatively long recovery four electrodes for impedance spectroscopy inside the culti-
time for the resistance indicates an underlying biochemical vation chamber for barrier-forming cells. Rapid prototyping
process, which is in line with the theory of EGTA complexing offers advantages by a shorter development time for designing,
calcium ions and therefore, disturbs the cell–cell connection. manufacturing, and testing devices. The electric and fluid field
Forskolin increases the concentration of the second mes- simulation allows constructional adjustments, which can be
senger cyclic adenosine monophosphate (cAMP). This trig- realized directly by 3D printing. Switching the cultivation con-
gers various biological effects, for example, an upregulated ditions from static to dynamic triggers a shear-induced cellular
anion secretion.[42–44] An increased transport of ions through response, which is comparable to the cellular behavior present
the cell membrane decreases the electrical resistance. The dif- in the respective physiological environment. Considering that
ferent changes in resistance of apical and basal membranes heterogeneous flow fields can lead to differently influenced
lead to two semicircles in the Nyquist representation of the EIS cells and therefore render the interpretation of experimentally
spectra. This indicates a profound change in cell layer behavior. acquired data more challenging, we ensured a homogeneous
For an equivalent electric circuit model representing the cell flow distribution by directing the flow through a diffuser on the
layer in contact with forskolin, two RC-elements are necessary. cell layer. The bioreactor systems allow for shear rates below
0.001 dyne cm-2 and up to 0.200 dyne cm-2 by varying the
pump rate. As a result, the reactor system is particularly suited
for the cultivation of epithelial cells.
In four-electrode EIS, the electrodes’ positioning needs
special consideration for the appropriate use of electric cir-
cuit fitting, ensuring that the measured impedance originates
from the cell layer under investigation. EIS allows online and
non-invasive measurement of cell layer resistance and capaci-
tance. From resistance and capacitance, viability, integrity, and
behavior of the barrier can be derived. The addition of EGTA
reduces the paracellular resistance by complexing calcium ions,
which are needed for tight junction protein complex. This was
monitored by EIS, and in addition, the derived capacitance
showed only slight changes, which indicates that the cell itself
is not affected. After the EGTA treatment, the rapid restoration
of the capacitance also reveals no other biological effect on the
cell-layer structure. In contrast to EGTA, forskolin is known
for its broad biological effects correlating with the increase in
cAMP concentration. The Nyquist representation of the EIS
spectra displays two semicircles and a reduction in resistance
Figure 6. Resistance and capacitance over time of a Caco-2 cell layer in
indicating a profound change in cell layer behavior.
response to a medium containing 10 µm of the calcium chelating agent
EGTA, and the recovery with EGTA-free medium. The electric properties We assume that EIS integrated into organ-on-chip or other
were measured by EIS and subsequently fitted with an equivalent elec- bioreactors is a powerful tool for online analytics. Neverthe-
trical circuit. less, special attention must be paid to the positioning of the
Adv. Mater. Technol. 2021, 2100009 2100009 (5 of 7) © 2021 The Authors. Advanced Materials Technologies published by Wiley-VCH GmbHwww.advancedsciencenews.com www.advmattechnol.de
electrodes. In this context, finding compromises among suit- serum. The membrane used in the bioreactor for the cell support was
able positioning for EIS measurements, physiological needs a track-edged PET membrane (0.4 µm pore size, Sabeu GmbH). The
of the cells, and goal of the experiment is necessary. The fab- membrane was coated with collagen I by filling the chambers with a
50 µg mL-1 collagen solution for 2 h at 37 °C. Afterward, the collagen
rication of our micro-bioreactor successfully demonstrates that solution was discarded, and the chamber was filled with 2× 10⁶ cells mL-1
such a compromise is achievable, and that 3D printing poses an Caco-2 cells.
attractive alternative to the PDMS-based production of bioreac- Two hours after inoculation, the bioreactor was emptied and refilled
tors in research. By using additive manufacturing, geometries with a fresh medium to remove the unattached cells from the bioreactor
can be generated that are not limited to 2D replica molding. In system. After 24 h of static cultivation, the bioreactor system was
the future, these benefits of 3D printing lab-on-a-chip devices connected to a peristaltic pump and a medium reservoir containing
15 mL EMEM. Subsequently, medium circulation through the upper
will become even more pronounced due to further advances in
chamber was initiated, and the culture was kept under flow conditions
3D printing technology. for the rest of the experiment. If not stated otherwise, the pump was
The introduced bioreactor may be beneficial for barrier- set to 150 µL min-1, leading to a mean shear rate of 0.0036 dyne cm-2.
research in general by allowing the noninvasive monitoring by The bioreactor was kept in the incubator at 37 °C and 5% CO2, and only
EIS. Influences of chemical gradients in the apical and basal transferred to the sterile workbench for medium exchange twice a week.
chamber side on the cell barrier as well as different shear For the experiments with EGTA and forskolin, cell culture media
containing either 10 mm EGTA or 10 µm forskolin were pumped into
stresses can be studied.
the reactor, and impedance spectra were recorded every minute to
measure the immediate response of an at least 6-day-old cell layer. After
35 min, the EGTA-containing medium was removed and replaced by an
EGTA-free medium.
5. Experimental Section Monitoring Cell-Layer Response with EIS: The EIS measurements
Bioreactor Design: The bioreactor consisted of three main parts: the were performed in galvanostatic mode with an amplitude of 10 µA and
3D-printed housing, membrane, and electrodes. The 3D-printed part was a frequency range from 10 Hz to 30 kHz. The impedance data were
designed to allow continuous medium perfusion, and therefore exposing analyzed with the fitting software Zview 2 (Version 3.5b, Scribner
cells to controlled, homogeneous shear stress. The bioreactor consisted Associates Inc., SP, USA). EIS monitored the response of Caco-2 cell-
of two identical half cells with a 3 mm drilling as the cultivation area. The barrier to EGTA and forskolin. A complete spectrum was measured every
membrane was clamped between the half cells to allow cell growth on 2 min. All impedance data were fitted with the equivalent circuit shown in
both sides. The fluid flow on the entrance was distributed by a diffuser Supporting Information. If the apical side differed only slightly from the
and directed across the membrane to apply homogeneous shear stress basal side, the resistances and capacitances were combined according
along the whole cultivation area. Additionally to the fluid channel, the to TEER = R1 + R2 and C −1 = C 1−1 + C 2−1, where TEER is the transepithelial
printed chamber possessed a drilling for the platinum wire as a voltage electrical resistance and C, the total membrane capacitance. This allows
pick-up electrode. The platinum wire was located above the membrane comparison to data from other studies that modeled the cell layer with
inside the homogeneous electrical field. The electrical field was provided one resistor and capacitor in parallel. The quality of the fitting regarding
by the indium tin oxide (ITO) glass functioning as current-injecting the electrical equivalent circuit was evaluated by the chi-square method.
electrodes. The bioreactor was sealed by two PTFE O-rings, which are COMSOL Simulation: The simulation of the shear stress and sensitivity
placed between the two half cells and ITO glass. To prevent a shift of distributions on the membrane area was performed by COMSOL
the membrane position and a shortcut between the two chambers, the Multiphysics (vers. 5.3 COMSOL Inc., Burlington, MA) with the single-
membrane was fixed between two PDMS rings, a biocompatible silicone phase flow and AC/DC module. For electric field simulation, the relative
polymer with self-sealing properties. permittivity of the medium was set to 78 and the electrical conductivity to
Device Fabrication and Assembly: The cell culture bioreactor was 1.5 S m-1. For shear stress simulation, the preset values for water were used
fabricated with a polyjet 3D printer (Stratasys, Objet Eden 260V). (viscosity, 1.002 mPas; temperature 293.15 K; and density, 998 kg m-3).
The polyjet printer can produce structures with a resolution of Simulating the fluid-flow profile reveals the shear stress applied to the
42 µm (600 dpi) in x and y directions and 16 µm in the z-direction. cells. Three different volume flows (0.05 mL min-1, 0.5 mL min-1, and
The cultivation chamber was printed with an acrylate-based material, 5 mL min-1) were simulated. The shear stress data distributions on the
RGD525 (Stratasys). For producing internal channels and overhangs, cell culture area are reported as box plots in Figure 1.
the support material, SUP705 (Stratasys), was used. After the printing Sensitivity Distribution: A uniform current density generated by
process, the support material was mechanically removed, and residues the electrodes across the cellular monolayer is favorable; otherwise,
were dissolved in 1 mol L-1 sodium hydroxide solution for at least 12 h. the impedance may be systematically over- or underestimated.[37,45]
After the cleaning step, the cultivation chamber was rinsed with water Sensitivity defines the compartmental contribution of a region to the
and dried. A 50 µm thick platinum wire (Goodfellow) was positioned in overall impedance.[46] Especially in four-electrode EIS, not every volume
the wire channels and fixed with LOCTITE M-121HP HYSOL (Henkel AG) element contributes equally to the impedance measurement. The
glue. The platinum wire was twisted around a 0.5 mm thick titanium method of sensitivity distribution is described in detail by Grimnes and
wire for mechanical stability outside the bioreactor. The titanium wire is Martinsen.[36] In short, a current was injected between the two current-
necessary for a stable connection between the bioreactor and impedance carrying electrodes, and the current density JCC (A m-2) was computed.
spectrometer. Polyethylene tubes (Smiths Medical) and cannulae The current density is a vector quantity with a magnitude and direction.
(B.Braun Melsungen AG) serve as media inlets and outlets. Both are In a second step, the same current was injected between the voltage
glued to the bioreactor for mechanical stability and sealing properties. pick-up electrodes, and computation of the current density JPU (A m-2)
In the last step, the bioreactor was clamped together by metal clamps in each volume element was repeated. The vector dot product of the
from the office supply, as demonstrated in Figure 5B and as a CAD computed current densities JCC and JPU, divided by the current I (A)
model in Figure 5A. The assembled bioreactor can be sterilized with squared, equals the sensitivity distribution S [1/m4] of each volume
70% ethanol. Alternatively, the bioreactor is fully autoclavable, except for element.
the polyethylene tubings and cannulae. JCC × JPU
Cell Cultivation: Caco-2 cell line, collagen I, EGTA, and forskolin were S= (1)
I2
purchased from Sigma Aldrich. Eagle’s minimum essential medium
(EMEM) was supplemented with 2 mmol L-1 glutamine, 1% non- Most interesting hereby is the sensitivity distribution on the
essential amino acids, 1% penicillin/streptomycin, and 10% fetal bovine cultivation area and is shown in Figure 2B.
Adv. Mater. Technol. 2021, 2100009 2100009 (6 of 7) © 2021 The Authors. Advanced Materials Technologies published by Wiley-VCH GmbHwww.advancedsciencenews.com www.advmattechnol.de
Supporting Information [14] L. Cacopardo, J. Costa, S. Giusti, L. Buoncompagni, S. Meucci,
A. Corti, G. Mattei, A. Ahluwalia, Biosens. Bioelectron. 2019, 140,
Supporting Information is available from the Wiley Online Library or 111340.
from the author. [15] D. Huh, Y.-s. Torisawa, G. A. Hamilton, H. J. Kim, D. E. Ingber,
Lab Chip 2012, 12, 2156.
[16] L. J. Y. Ong, A. Islam, R. DasGupta, N. G. Iyer, H. L. Leo, Y.-C. Toh,
Acknowledgements Biofabrication 2017, 9, 045005.
[17] N. Bhattacharjee, A. Urrios, S. Kang, A. Folch, Lab Chip 2016, 16,
This work received funding from the European Research Council (ERC)
1720.
under the European Union’s Horizon 2020 research and innovation
[18] J. Lölsberg, J. Linkhorst, A. Cinar, A. Jans, A. J. Kuehne, M. Wessling,
program (grant agreement no. 694946). Part of the work was performed
at the Center for Chemical Polymer Technology (CPT), which is Lab Chip 2018, 18, 1341.
supported by the EU and the federal state of North Rhine-Westphalia [19] A. Jans, J. Lölsberg, A. Omidinia-Anarkoli, R. Viermann, M. Möller,
(grant no. EFRE 30 00 883 02). L. De Laporte, M. Wessling, A. J. Kuehne, Polymers 2019, 11, 1887.
Open access funding enabled and organized by Projekt DEAL. [20] C. M. Costello, M. B. Phillipsen, L. M. Hartmanis, M. A. Kwasnica,
V. Chen, D. Hackam, M. W. Chang, W. E. Bentley, J. C. March,
Sci. Rep. 2017, 7, 12515.
[21] J. L. Erkal, A. Selimovic, B. C. Gross, S. Y. Lockwood, E. L. Walton,
Conflict of Interest
S. McNamara, R. S. Martin, D. M. Spence, Lab Chip 2014, 14, 2023.
The authors declare no conflict of interest. [22] J. Kieninger, A. Weltin, H. Flamm, G. A. Urban, Lab Chip 2018, 18,
1274.
[23] C. Probst, S. Schneider, P. Loskill, Curr. Opin. Biomed. Eng. 2018, 6,
Data Availability Statement 33.
[24] O. Y. Henry, R. Villenave, M. J. Cronce, W. D. Leineweber,
The data that supports the findings of this study are available in the M. A. Benz, D. E. Ingber, Lab Chip 2017, 17, 2264.
supplementary material of this article. [25] L. M. Griep, F. Wolbers, B. de Wagenaar, ter P. M. Braak, B. Weksler,
I. A. Romero, P. Couraud, I. Vermes, A. D. van der Meer, A. van
den Berg, Biomed. Microdevices 2013, 15, 145.
Keywords [26] H.-Y. Tan, S. Trier, U. L. Rahbek, M. Dufva, J. P. Kutter,
T. L. Andresen, PLoS One 2018, 13, e0197101.
Caco-2, 3D-printing, electrical impedance spectroscopy, organ-on-a chip, [27] T. Sbrana, N. Ucciferri, M. Favrè, S. Ahmed, E.-M. Collnot,
transepithelial electrical resistance C.-M. Lehr, A. Ahluwalia, M. Liley, Sens. Actuators, B 2016, 223, 440.
[28] R. Booth, H. Kim, Lab Chip 2012, 12, 1784.
Received: January 4, 2021
[29] G. Linz, S. Djeljadini, L. Steinbeck, G. Köse, F. Kiessling,
Revised: February 22, 2021
M. Wessling, Biosens. Bioelectron. 2020, 165, 112345.
Published online:
[30] D. H. Elbrecht, C. J. Long, J. J. Hickman, tc 2016, 1, 1.
[31] B. Srinivasan, A. R. Kolli, M. B. Esch, H. E. Abaci, M. L. Shuler,
J. J. Hickman, J. Lab. Autom. 2015, 20, 107.
[1] S. Tsukita, M. Furuse, M. Itoh, Nat. Rev. Mol. Cell Biol. 2001, 2, 285. [32] H. Schwan, Biophysik 1966, 3, 181.
[2] R. Cecchelli, V. Berezowski, S. Lundquist, M. Culot, M. Renftel, [33] P. B. Ishai, M. S. Talary, A. Caduff, E. Levy, Y. Feldman, Meas. Sci.
M.-P. Dehouck, L. Fenart, Nat. Rev. Drug Discovery 2007, 6, 650. Technol. 2013, 24, 102001.
[3] U. Mirastschijski, R. Dembinski, K. Maedler, Front. Med. 2020, 7, [34] H. P. Schwan, C. D. Ferris, Rev. Sci. Instrum. 1968, 39, 481.
254. [35] J. Winkler, P. Hendriksen, N. Bonanos, M. Mogensen,
[4] K. Benson, S. Cramer, H.-J. Galla, Fluids Barriers CNS 2013, 10, 5. J. Electrochem. Soc. 1998, 145, 1184.
[5] S. N. Bhatia, D. E. Ingber, Nat. Biotechnol. 2014, 32, 760. [36] S. Grimnes, Ø. G. Martinsen, J. Phys. D: Appl. Phys. 2006, 40, 9.
[6] I. Bischoff, M. C. Hornburger, B. A. Mayer, A. Beyerle, J. Wegener, [37] J. Yeste, X. Illa, C. Gutiérrez, M. Solé, A. Guimerà, R. Villa,
R. Fürst, Sci. Rep. 2016, 6, 1. J. Phys. D: Appl. Phys. 2016, 49, 375401.
[7] J. R. Macdonald, W. B. Johnson, in Impedance Spectroscopy: Theory, [38] A. H. Gitter, J.-D. Schulzke, D. Sorgenfrei, M. Fromm,
Experiment, and Applications, Wiley, New York 2018, pp. 1–20. J. Biochem. Biophys. Methods 1997, 35, 81.
[8] H. J. Kim, D. Huh, G. Hamilton, D. E. Ingber, Lab Chip 2012, 12, 2165. [39] C.-M. Lo, C. R. Keese, I. Giaever, Biophys. J. 1995, 69, 2800.
[9] A. Bein, W. Shin, S. Jalili-Firoozinezhad, M. H. Park, A. Sontheimer- [40] J. Wegener, D. Abrams, W. Willenbrink, H.-J. Galla, A. Janshoff,
Phelps, A. Tovaglieri, A. Chalkiadaki, H. J. Kim, D. E. Ingber, Biotechniques 2004, 37, 590.
Cell. Mol. Gastroenterol. Hepatol. 2018, 5, 659. [41] S. M. Krug, M. Fromm, D. Günzel, Biophys. J. 2009, 97, 2202.
[10] S. Giusti, T. Sbrana, M. La Marca, V. Di Patria, V. Martinucci, [42] B. Tuo, G. Wen, Y. Zhang, X. Liu, X. Wang, X. Liu, H. Dong,
A. Tirella, C. Domenici, A. Ahluwalia, Biotechnol. J. 2014, 9, 1175. Am. J. Physiol.: Cell Physiol. 2009, 297, C503.
[11] M. W. van der Helm, O. Y. Henry, A. Bein, T. Hamkins-Indik, [43] K.-M. Kreusel, M. Fromm, J. Schulzke, U. Hegel, Am. J. Physiol.: Cell
M. J. Cronce, W. D. Leineweber, M. Odijk, A. D. van der Meer, Physiol. 1991, 261, C574.
J. C. Eijkel, D. E. Ingber, Lab Chip 2019, 19, 452. [44] T. Tamada, M. J. Hug, R. A. Frizzell, R. J. Bridges, JOP 2001, 2, 219.
[12] L. C. Delon, Z. Guo, A. Oszmiana, C.-C. Chien, R. Gibson, [45] B. Jovov, N. Wills, S. A. Lewis, Am. J. Physiol.: Cell Physiol. 1991, 261,
C. Prestidge, B. Thierry, Biomaterials 2019, 225, 119521. C1196.
[13] R. Lentle, P. Janssen, J. Comp. Physiol. B 2008, 178, 673. [46] O. I. Shuvo, M. N. Islam, Dhaka Univ. J. Sci. 2016, 64, 7.
Adv. Mater. Technol. 2021, 2100009 2100009 (7 of 7) © 2021 The Authors. Advanced Materials Technologies published by Wiley-VCH GmbHYou can also read