On the genesis and nature of Palm Tree Modes in the JET tokamak
←
→
Page content transcription
If your browser does not render page correctly, please read the page content below
On the genesis and nature of Palm Tree Modes in
                                                    the JET tokamak
arXiv:2106.11602v1 [physics.plasm-ph] 22 Jun 2021

                                                           C. Maszl1,2 , V. Naulin3 , R. Schrittwieser2 and JET EFDA
                                                           Contributors†
                                                           1
                                                               Funding Support and Industry Relations, TU Wien, Austria
                                                           2
                                                               Institute for Ion Physics and Applied Physics, University of Innsbruck, Austria
                                                           3
                                                               PPFE, Department of Physics, DTU, DK-2800 Kgs. Lyngby, Denmark
                                                           E-mail: christian.maszl-kantner@tuwien.ac.at

                                                           Abstract. Long-lived, highly localized structures called palm tree modes (PTM)
                                                           are observed in the edge plasma of the JET tokamak. Although PTMs are well
                                                           documented, little is known about the mechanisms which produce these structures.
                                                           In the case of the PTM, an ELM-postcursor, its genesis is usually explained by
                                                           ergodisation of the magnetic field due to edge localized modes and the appearance
                                                           of a seed magnetic island which evolves into a PTM later.
                                                           In this study we try to invoke a creation mechanism based on the concepts and
                                                           observations in edge plasma turbulence. An interesting aspect of plasma turbulence is
                                                           the occurrence of coherent, long-lived structures in the scrape-off-layer (SOL). These
                                                           localized and magnetic-field-aligned regions with higher or lower plasma densities are
                                                           called blobs and holes. Measurements show that these filaments carry parallel currents.
                                                           We thus here interpret ELM-filaments as massive blobs and the interspace between
                                                           these filaments as holes.
                                                           We demonstrate that a forward-modelled closed current filament on a q = 3 surface
                                                           produces similar magnetic fluctuations as measured by the JET in-vessel magnetic
                                                           pickup coils if a PTM is present. From that we deduce that if a hole is captured on
                                                           a q = 3 surface after an ELM-crash, a PTM equivalent signature is generated. If the
                                                           ELM-filament itself is captured on a q = 4 surface, a signature equivalent to an outer
                                                           mode appears.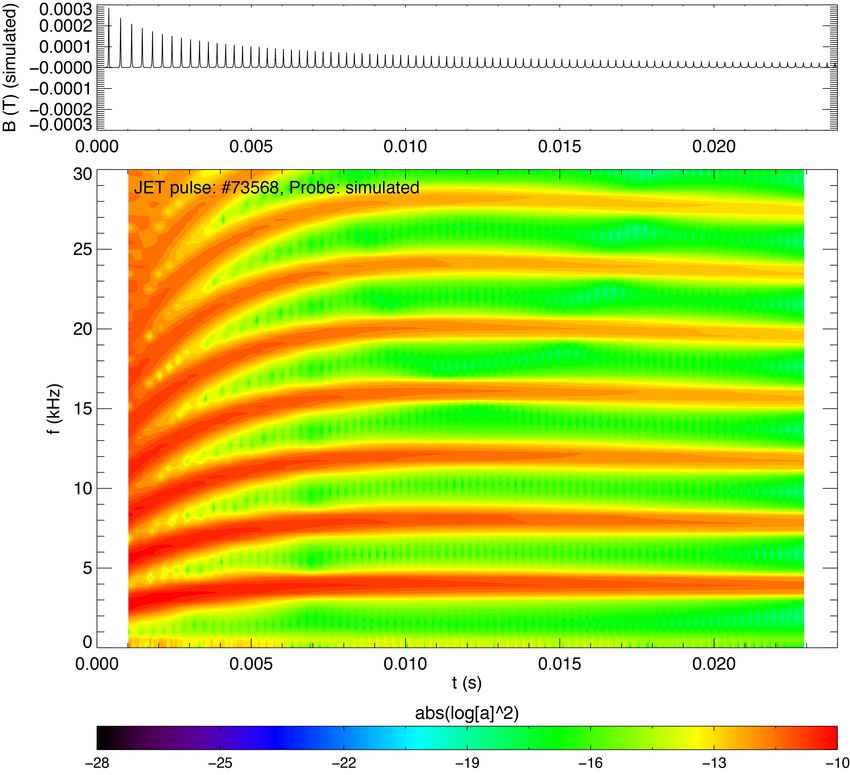
On the genesis and nature of Palm Tree Modes in the JET tokamak                           2

1. Introduction

There is evidence for the existence of coherent long-lived highly localized structures
in the edge of tokamak plasmas. These are found for example in the edge of JET as
confined current ribbons or filaments (outer modes) [1] and palm tree modes (PTM) .
Although these phenomena are well documented, little is known about the mechanisms
which produce these structures. In the case of the PTM its genesis is usually explained
by ergodisation of the magnetic field due to the ELM and the appearance of a seed
magnetic island which evolves into a PTM [2].
Here we try to invoke a creation mechanism based on the concepts and observations
of plasma turbulence. Turbulence in tokamaks is an active field of research and great
efforts are spent, experimentally and theoretically, to quantify and understand particle,
energy and momentum transport [3, 4]. An interesting aspect of plasma turbulence
is the occurrence of coherent, long-lived structures in the SOL. These localized and
magnetic-field-aligned regions with higher or lower plasma densities are called blobs
and holes, respectively.They lead to intermittent transport through the scrape off layer
(SOL), which can effect the integrity of plasma facing components. Blobs and holes
were observed first by Zweben in 1985 during studies of edge density turbulence with
an array of Langmuir probes in the Caltech research tokamak [5]. In the poloidal plane,
blobs and holes look like drifting quasiparticles. In the last years the origin of localized
filamentary blobs has been identified as the edge shear layer, where zonal-flows shear
off meso-scale coherent structures [6]. These filaments carry parallel currents [7]. A
significant amount of radial transport (up to 60%) might be carried by blobs [8].
ELM filaments, as observed with fast camera diagnostics [9], show certain similarities
with blobs in plasma turbulence. Despite their size ELM filaments are likewise current
carrying, magnetic-field-aligned coherent structures [10] with higher densities and excess
temperatures [11], compared to the background plasma. According to [12], ELMs should
leave current holes behind because of total current conservation on short time scales in
the torus. These observations lead us to the central hypothesis of this paper, that ELMs
create current and density holes in the edge plasma and that their motion can lead to
phenomena like PTMs.

2. Experimental results

The palm tree mode is an ELM post-cursor which was, as far as we know, only observed
in JET. It occurs in a wide variety of plasma conditions, as long as the q = 3 is
located in the ELM-perturbed region. PTMs can be studied with the electron cyclotron
emission (ECE), soft X-ray diagnostic (SXR) which covers the edge plasma and magnetic
diagnostics at the limiters and the first wall [2]. Figure 1 depicts a sliding window fast
Fourier spectrum of a PTM magnetic signal and its characteristic appearance (JET
pulse: #73568, t0 = 12.995 s).
On the genesis and nature of Palm Tree Modes in the JET tokamak                                3

               Figure 1. FFT of a PTM measured by coil PP803 from the poloidal limiter array
               (JET pulse: 73568, t0 = 12.995 s). The size of the FFT windows is τ = 2 ms and the
               time shift between the windows dt = 64 µs.

     The PTM starts after the ELM crash at t0 = 12.995 s. Because of the strong
magnetic perturbations of the ELM the actual onset time of the PTM cannot be de-
duced with certainty. Characteristic features are an increase in frequency for the first ms
and the observation of rich harmonics, which indicate strong localization of the feature.
These characteristics can also be observed in ECE and SXR signals and are the inspi-
ration for the flowery name. The amplitude is decaying with time. Typical lifetimes of
PTMs are around 23 ms although PTMs with lifetimes up to 60 ms can be observed. If
an ELM is triggered during a PTM event, the PTM is terminated immediately.

     JET has a number of in-vessel magnetic coils with sample frequencies in the range
between one and two MHz. These coils and coil arrays were used to study the helical
structure and localization of the PTM as well as growth and decay. The ECE diagnostic
was used to study temperature perturbations. The combination of both diagnostics
allowed a rough estimate of the location. Furthermore, charge exchange recombination
spectroscopy (CXRS) was used to correlate the rotation frequencies of PTMs with the
edge rotation. For this study a PTM database was created containing 36 PTMs. 24 of
them are not superposed by other MHD activity (see Appendix Tab. 3 and Tab. 4
for more details). This is important because other MHD activity would modulate
PTM signals and circumvent the study of growth and decay behaviour. PTMs were
searched which are not stopped by a subsequent ELM, which limit the lifetime, to allow
investigations on dissipative processes. For two PTMs the diagnostic coverage was more
extensive (JET pulse: #52011‡ t = 19.14 − 19.22 s , #73568§ t = 12.8–13.2 s). Aside
from fast magnetics also fast ECE with higher time resolution (fs = 250 kHz) was
‡ Session Aims: Influence of triangularity on confinement, pedestal and SOL parameters
§ Session Aims: Scaling of confinement and pedestal with rho*, beta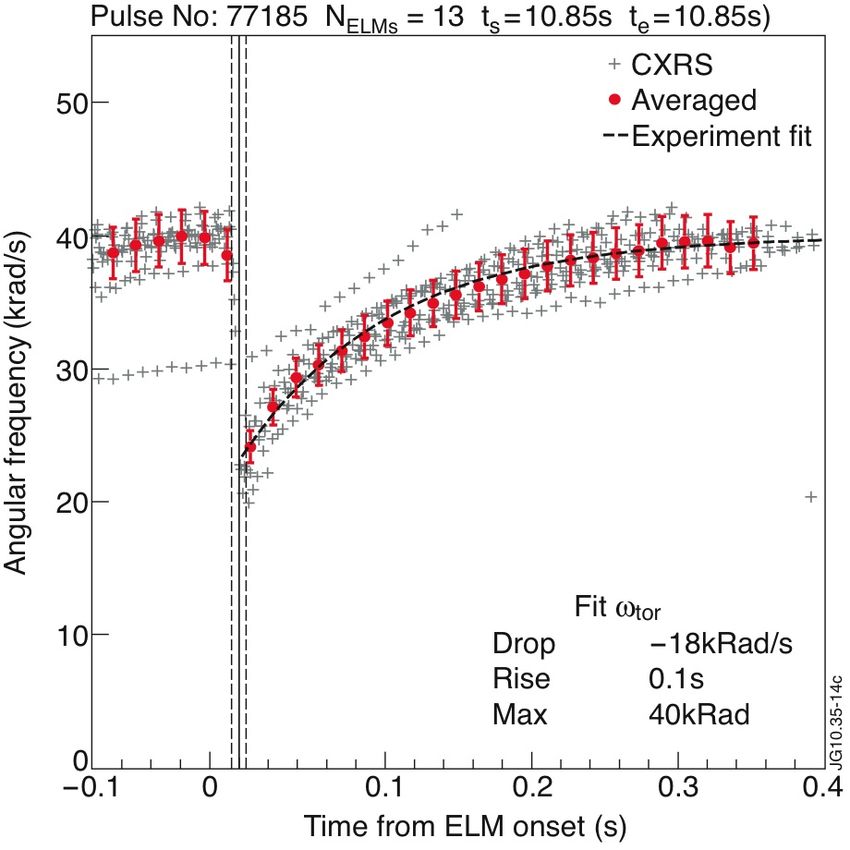
On the genesis and nature of Palm Tree Modes in the JET tokamak                                 4

available. Therefore, these two pulses were studied in more detail. The JET control
room physics summary is presented in Tab. 1

                Table 1. JET Control Room Physics Summary for the pulses #52011 and #73568.
                Bt toroidal magnetic field, Ip plasma current, ne electron density, Te electron
                temperature, PN BI neutral beam injector power, EFCC error field correction coils,
                - not available/applicable

   Pulse Bt (T) Ip (MA) ne dl(1019 m−2 ) Te (keV) PN BI (MW) EFCC Year
   52011 2.67     2.51        17.5           -        11.8     -  2000
   73568 2.00     2.20        12.4          4.6       10.7    off 2008

2.1. Rotation
Fourier spectra of PTMs show rich harmonics and also a frequency increase in the first
ms. It is known that ELMs cause momentum losses in the pedestal region. These are
usually studied with CXRS [13]. The rotation in figure 2 drops almost by 20 krad/s
after an ELM event.

                Figure 2. Edge rotation as measured by CXRS. Recovery after ELM induced
                momentum losses (vertical line) can be observed. Courtesy by Thijs W. Versloot.

     It was found that PTMs are co-rotating with the edge plasma [2]. Furthermore
the initial and final frequencies of PTMs and the pedestal are in the same order of
magnitude as this co-rotation [14]. A comparison is given in Fig. 3. Here the initial
frequencies are colour-coded red and the final frequencies black. The solid line indicates
unity.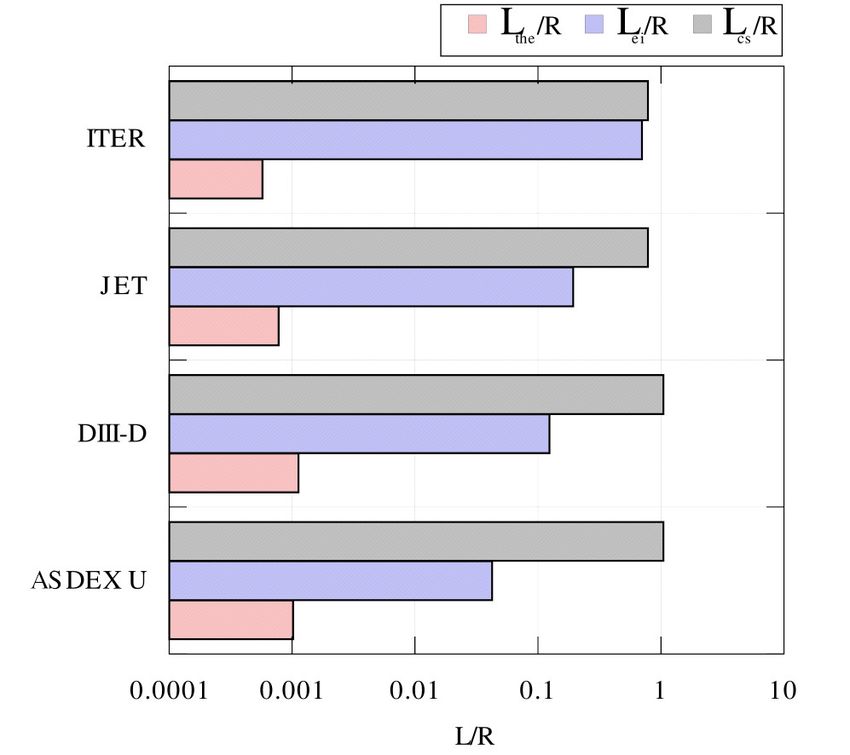
On the genesis and nature of Palm Tree Modes in the JET tokamak                                5

              Figure 3. Comparison of initial (Min) and final (Max) velocities of PTM (MHD)
              and pedestal frequencies (CXRS) for single ELM data. The solid line indicate unity.
              Courtesy by Thijs W. Versloot.

    The frequency increase and hence toroidal angular velocity vtor in rad/s of the PTM
in JET pulse #73568 at t0 = 12.994 s (Fig. 1) can be fitted by

              vtor = m0 + m1 1 − e−m2 t .                                                    (1)
    with the fit parameters m0 = 14816.5 rad/s, m1 = 9235.7 rad/s and m2 = 189.4 s−1 .
The initial and final frequencies as seen in CXRS and MHD data are comparable.
Surprisingly, the frequency increase extracted from MHD-data is approximately one
order of magnitude faster. This discrepancy has to be addressed in future research.

2.2. Temperature perturbations
PTMs can also be seen in the signals of the ECE diagnostic. Surface plots of ECE data
locate the PTM in the gradient region of the pedestal (Fig. 4). However, ECE data
have to be considered with care because they rely on equilibrium reconstruction. The
exact spatial localisation of MHD modes is therefore not straightforward [15].

    Moreover, the influence of the edge current density will alter the equilibrium in the
plasma edge. PTMs are capable to disturb the equilibrium locally which is demonstrated
in Fig. 5. There is a strong correlation and a 180◦ phase shift between ECE channel
B1:012 and coil T009 which is close to the line of sight of the diagnostic.

     This is another direct evidence of a current perturbation due to the PTM. A similar
observation was made by Koslowski et al. They found that the PTM has a tearing mode
structure [2]. The distance of the PTM to coil PP804, slightly below the mid-plane on
the outboard limiter, is approximately 0.19 m.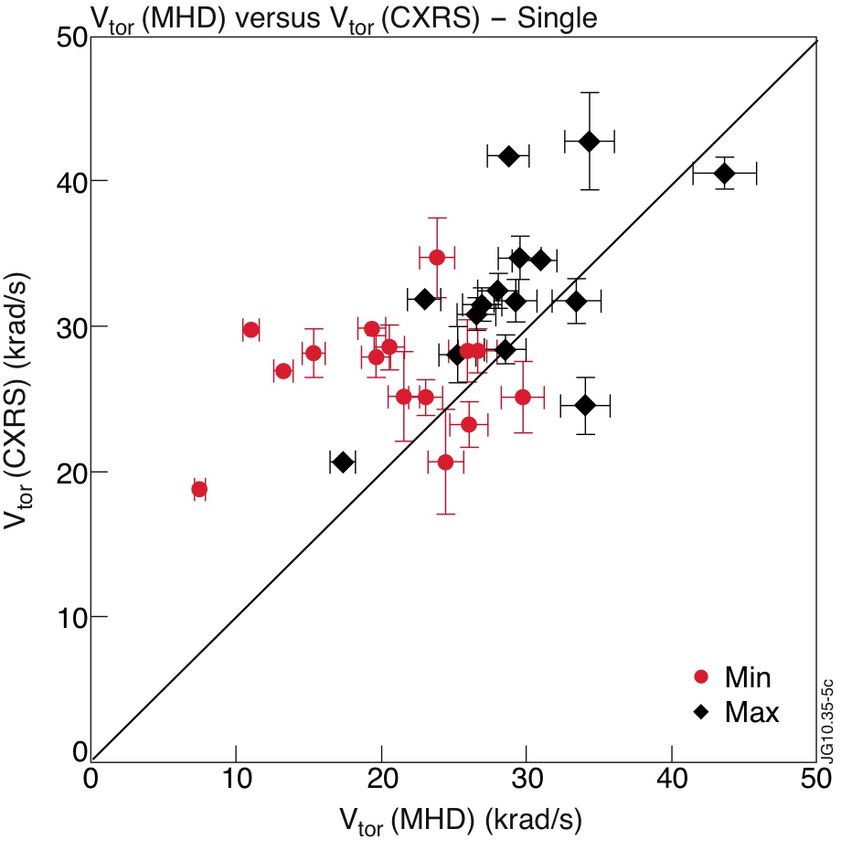
On the genesis and nature of Palm Tree Modes in the JET tokamak                                    6
                                                                    Pedestal Edge
                           0.0062 +1.916e1

                           0.0060

                           0.0058

                    t(s)   0.0056

                           0.0054

                           0.0052

                           0.00503.76        3.78     3.80              3.82          3.84
                                                         R(m)

                                1650     1350       1050            750         450          150
                                                           Te(eV)

              Figure 4. The electron temperature Te as function of time t and major radius R,
              measured by ECE (KK3-CATS, JET pulse: #52011). The temperature perturbations
              due to the PTM are visible in the edge region of the pedestal.

2.3. Helical structure and decay of the PTM
Typical application areas of the JET in-vessel magnetic coils are plasma control, equi-
librium reconstruction and, with the fast arrays, the study of MHD phenomena just to
name a few. Fast coil arrays are also used for MHD mode number analysis and hence to
infer the periodicity of these signals. This was also done with PTM data by Koslowski
et al. [2] in the past. They concluded that the PTM has a tearing mode structure and
is formed in the vicinity of a resonant q = 3 surface.

     A complementary novel approach to infer the periodicity was performed by B.
Lagier et al. [16]. The available in-vessel magnetic coils were used to infer the helical
structure by a comparison with a synthetic signal in the toroidal/poloidal plane. At first
the magnetic signals were calibrated, numerically integrated and digitally filtered by a
second order Butterworth high-pass filter with a cut-off frequency of 1 kHz. Afterwards
the probe position were indicated in the toroidal/poloidal plane and the signal strength
was colour-coded. If the perturbation of the PTM is close to one coil, the signal strength
was high an therefore color-coded in red. Weak signals are color-coded blue. The results
are presented in Fig. 6.

     The green lines in Fig. 6 are a representation of a field line on a q = 3 surface for a
tokamak with circular cross-section. Once the simulated filament is synchronized with
the experimental data, the highly localized simulated filament propagates in phase with
the measured current perturbation of the PTM through the toroidal/poloidal plane. If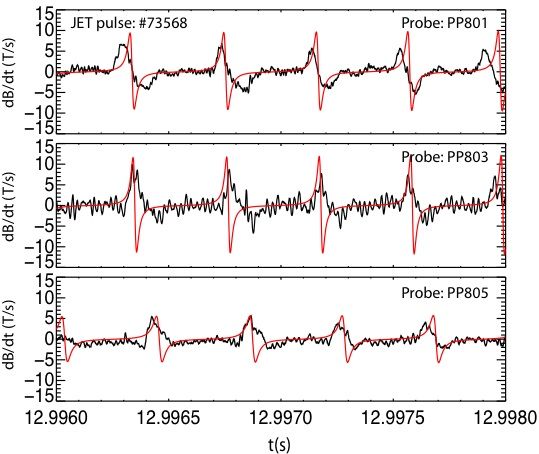
On the genesis and nature of Palm Tree Modes in the JET tokamak                                         7
                                        JET pulse: #52011
                                  1.0

                                  0.5

                      S (arb.)
                                  0.0

                                 −0.5

                                          a)                 Probe: T009
                                 −1.0
                                  1.0

                                  0.5
                      S (arb.)

                                  0.0

                                 −0.5

                                          b)                 Probe: ECE B1:012
                                 −1.0
                                    19.1640     19.1642     19.1644       19.1646   19.1648   19.1650
                                                                      t(s)

              Figure 5. Temporal comparison of a a) dB/dt signal from magnetic coil T009 (red)
              in octant 7 (JET pulse: #52011) and b) an electron temperature signal (ECE B1:012,
              black). Both signals S are normalised to 1.

the simulated filament is close to a coil also the measured signal is high. That is another
evidence for the high localization of the PTM.

     It is also instructive to compare the envelopes of the filtered and integrated PTM
signals from magnetic coils at different positions around the torus in one poloidal plane
(Fig. 7, JET pulse: #73568, t0 = 12.9936 s). At the inboard side (Fig. 7, coil I802) the
mode grows for the first ms starting close at zero and decays after this phase almost
linearly. Since ELM perturbations are more pronounced for the outboard side, the onset
of the PTM can be traced back almost right after the ELM. The behaviour is different
at the outboard side. Above the mid-plane (coil PP801) the onset of the mode is not as
clear as at the inboard side since strong perturbations following the ELM-crash prevail.
After this phase, two decay time constants can be identified. At first, the PTM shows a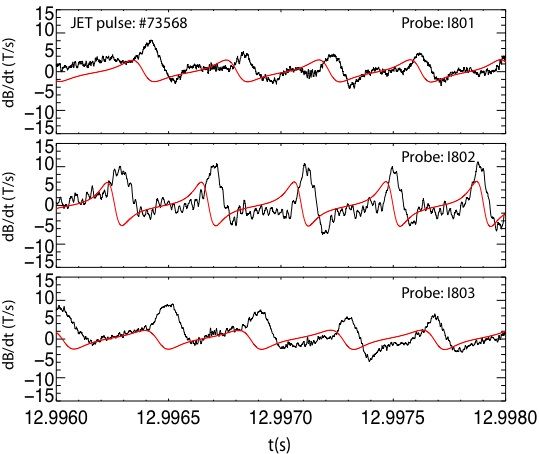
On the genesis and nature of Palm Tree Modes in the JET tokamak                                             8

                            Measured signal
                                                    High

                                                    Low
                 10,9045         Time (s)     10,9080
 Poloidal (2π)

                                              HFS

                           LFS                LFS

                    Toroidal (2π)

                 Figure 6. The figure is based on a JET report of Benjamin Lagier [16] and simplified
                 for clarity. The figure shows four different time steps. Each plot is organized in three
                 sections. In the upper left corner is the representation of a field line (blue) with constant
                 q = 3 on a rational surface for a torus with circular cross-section. The window in the
                 upper right corner shows a measured signal from a fast coil in JET. Maxima are marked
                 with red dots. The black vertical dashed line is a time marker. The lowest window
                 represents the toroidal/poloidal plane. Limiter coil arrays on the high field side (HFS)
                 and on the low field side (LFS) are indicated by HFS and LFS for easier orientation.
                 Every used coil is represented as a rectangle where the measured signal strength is
                 color-coded (red=high,
                                   b       blue=low
                                                b      signal strength). Green lines indicate the location
                 of the simulated field line on a q = 3 surface, synchronized with the measured signals
                 (JET pulse: #77188, t = 10.9045 − 10.9080 s).

rapid decay phase (A) followed by a linear decay phase (B). Below the mid-plane (coil
PP805) the amplitude rises quickly, peaks and after that process decays also with two
time constants. In principle this could also be explained by a shift of the whole plasma
On the genesis and nature of Palm Tree Modes in the JET tokamak 9
from the inboard to the outboard side. But the behaviour of the signal as measured
by PP805 verifies why a movement of the whole plasma cannot cause this process. It
would have to include also a rotation of the hole plasma in the electron diamagnetic
drift direction to induce this signal.
0.0003 0.0003
JET pulse: #73568 JET pulse: #73568
0.00025 t0=12.9936 s 0.00025 t0=12.9936 s
Limiter coil I802 Limiter coil PP801
0.0002 Envelope 0.0002 Envelope
(A)
B (T)
B (T)
0.00015 0.00015
0.0001 0.0001 (B)
5e-05 5e-05
0 0
-0.01 0 0.01 0.02 0.03 0.04 -0.01 0 0.01 0.02 0.03 0.04
t (s) t (s)
Full
Flux Internal
Loops Discrete 0.0003
Upper
Coils
Coils
JET pulse: #73568
0.00025 t0=12.9936 s
Limiter coil PP805
Inner
Envelope
Saddle
0.0002
Coils
Loops
Poloidal
B (T)
Limiter 0.00015
Coils
0.0001
Divertor
Coils
c
5e-05
0-2
-1 3
04
JG
0
Full -0.01 0 0.01 0.02 0.03 0.04
Flux
Loops t (s)
Figure 7. Comparison of filtered and integrated magnetic signals at the outboard
and inboard side of JET for three different coils (JET pulse: #73568, t0 = 12.9936 s).
The envelopes of the signals are indicated with the red lines. (A) and (B) in the upper
right panel indicate two time constants in signal decay.
Summarising, this spatio-temporal investigation of this PTM shows the best results
because the PTM is located close to the in-vessel coils. PTMs are apparently highly
localized structures (Fig. 6), which are co-rotating with the bulk plasma (Sec. 2.1) and
show a temporal evolution that corroborates its generation at the outboard side (Fig. 7).On the genesis and nature of Palm Tree Modes in the JET tokamak 10
3. Forward modelling of magnetic fluctuations
From these experimental results we conclude that it should in principle be possible to
describe the PTM phenomenology as rotating closed current filament in the pedestal
region where an initially localised current distribution is allowed to expand parallel to
the magnetic field on a rational surface.
Following the approach in [17], Biot-Savart’s law was used to compute the magnetic
field at different coil positions and times. The helical structure of the filament was
obtained for a single field line on a rational q = 3 surface with FLUx Surface Handling
(FLUSH) [18]. It is a collection of FORTRAN routines to assist in reconstructing and
post-processing the flux solution of a plasma equilibrium solver at JET. To be more
specific in this study the subroutines FLUQAX and FLUPN3 were used for JET pulse:
#73568 at t = 12.98 s. The angular velocity of the filament was mimicked using Eq. 1.
The distance of the mode d ≈ 0.19 m to the pick-up coil PP804 was estimated using
the radial position information from the ECE diagnostic (Fig. 4).
As initial condition a Gaussian shaped current density distribution along the parallel
direction of the field line with a maximum current density of j0 = 4.2 × 10⁵ A/m2 ,
standard deviation σ =1.2 m and a filament cross-section of A0 = 1.8 × 10⁻³ m2 was
placed in the middle of the domain at t0 . This peak current density - giving a peak
magnetic field strength - was matched with the maximum field for coil PP801 in Fig. 7.
In order to limit the lifetime of the modelled filament to tlt = 25 ms a dissipation
mechanism is required. In this study we treat the filament as a short solenoid with
N = 3.0 windings and a series resistance R. The resistance is determined via the
parallel Spitzer resistivity ηk and the length of a filament lf on a q = 3. In the case
of JET this is approximately lf = 56 m. The electron temperature at the location of
the PTM after the collapse of the pedestal is roughly Te ≈ 280 eV. The parallel Spitzer
resistivity is therefore around ηk = 7.0 × 10⁻⁸ Ωm and the Ohmic resistance therefore
R = 3.9 × 10⁻⁶ Ω.
The inductance L of a short solenoid is computed according to [19]
N 2A
L(µr ) ≈ µ0 µr (2)
hf + 0.8rf
where hf = 3 m is the length, rf = 4 m the radius of the solenoid and A = πrf2 the
area of the cross-section. The time constant for the current decay is τ = L(µr )/R. We
assume that the current is gone after five time constants τ = tlt /5 = 0.005 s. With
R = 3.9 × 10⁻⁶ Ω and τ = 0.005 s we compute for the inductance L and the relative
permeability µr
L = 1.98 × 10⁻⁸ H µr = 0.23 × 10⁻³ . (3)
For the numerical simulation with a time resolution of 1×10⁻⁷ s, periodic boundaries
where chosen to reflect the nature of a closed current filament (Fig. 8).On the genesis and nature of Palm Tree Modes in the JET tokamak 11
Figure 8. Illustration of a filament with locally varying q on a q = 3 surface, calculated
with FLUSH in various presentations. The lower right panel shows the current density
j of the filament in parallel direction p. The colored squares in the two upper panels
represent the magnetic pick-up coils at the limiters in the octants four and eight. The
current distribution after 24 ms in the filament is color-coded. Red means high current
density, black low current density. For the exact values see the lower right panel please
(Equilibrium from JET pulse: #73568, t = 12.98 s).
3.1. Results
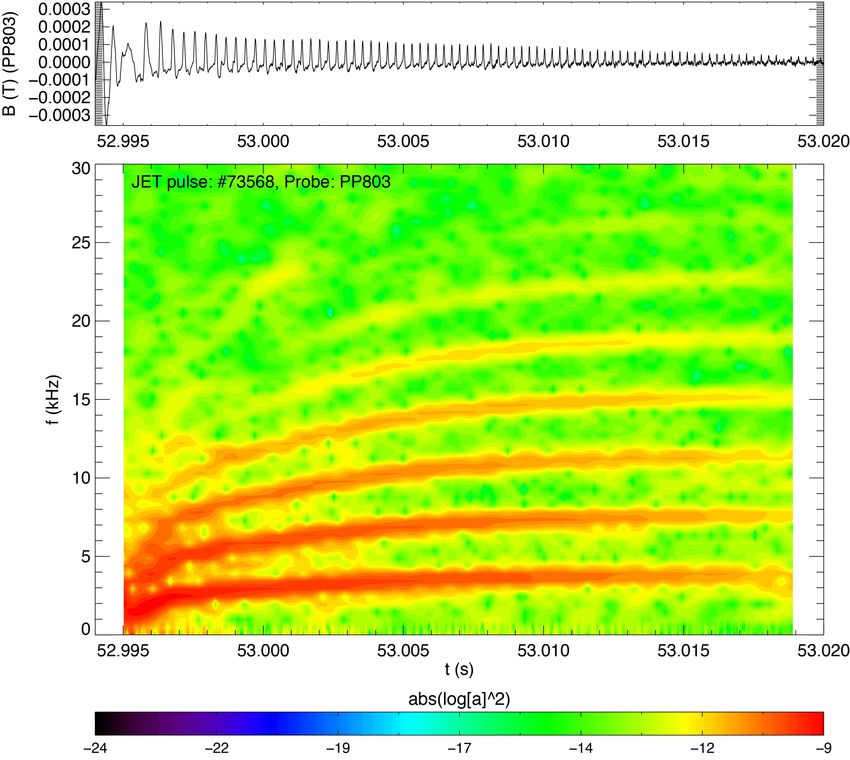
A comparison of FFTs from measured and integrated data (Fig. 1) and from forward-
modeled magnetic fluctuations (Fig. 9) show good agreement. Both plots show the
characteristic harmonics, a sharp increase of the frequency in the beginning and a slow
decay of the mode after approximately 25 ms. Obviously, a highly localized current
filament is also capable to produce the observed spectra.On the genesis and nature of Palm Tree Modes in the JET tokamak 12
Figure 9. FFT of magnetic fluctuations from a forward-modeled closed rotating
current filament.
Forward modelling of magnetic fluctuations gives information both on the direction
of the current and the periodicity of the current filament. The current is approximately
I ≈ −294.5 A at t = 12.996 s. The current density is then of the order of −0.15 MA/m2
assuming a filament cross-section of A0 = 1.8 × 10⁻³ m2 [2]. The polarity (sign) of
the coils was defined using the disruptions #73460, #77176, the m/n = 2/1 mode in
#77635 (t = 44.207 − 44.2084 s) and the dry run #77638 (40 − 43 s. P4 blip window)
by Sergei Gerasimov et alk. The sign of the current indicates a lack of current compared
to the plasma current and therefore a current hole in the PTM region.
The signals of magnetic signatures from an unipolar current filament are comparable
to the envelopes of the measured signals (Fig. 10 and Fig. 11). For the coils PP801,
PP803, PP805 the signal strength is overestimated. Although fairly well synchronized
with PP801, there is a small phase shift between the signals in PP803 and PP805.
This is even worse for signals at the inboard side where the current is underestimated.
Nevertheless the shape of the signals approve the negative sign. Errors in the phase
relation are probably due to use of a poor equilibrium where the edge current and
distortions of the PTM are not reflected.
The presented model is simplified, therefore we expect only qualitative agreement
with the observations.
k Private communication, [20]On the genesis and nature of Palm Tree Modes in the JET tokamak 13
Figure 10. Comparison Figure 11. Comparison of a
of a simulated unipolar cur- simulated unipolar current fil-
rent filament (red) with sig- ament (red) with signals from
nals from the inboard array the outboard array (black,
(black, I801-I803) for JET PP801-PP805) for JET pulse
pulse #73568. #73568.
4. Discussion
Based on the results from the experiment an intuitive model is proposed which could in
principle explain the genesis of the PTM.
Langmuir probe measurements in JET reveal that blobs and holes are created in
the edge shear layer. Whereas blobs can propagate large distances and in principle can
reach the first wall, holes travel up the temperature gradient and are only observed
slightly inside the region where they have been born. Calculations show that holes are
filled on the conductive time scale τcond . Since τcond ≈ Lk /χek depends on the parallel
length Lk and the electron thermal conductivity χek , the lifetime of holes is in the range
of µs [6]. The lifetime of a hole is therefore influenced by its size and the electron tem-
perature. Additionally, low shear rates are a prerequisite. Otherwise holes are sheared
apart rather quick.
A localized, B field aligned hole wich is travelling to a resonant magnetic surface
with a radial velocity vR exhibits a current, a density and a temperature perturba-
tion (Fig. 12a). It is expanding parallel to the field line with velocity vk . Holes are
usually quickly filled by parallel Γk and perpendicular transport Γ⊥ . Fig. 12b) shows
the situation if such a hole was able to reach a field line on a resonant surface. Then,
the polarization is short-circuited by parallel currents and the motion stops. The hole
is then filled by perpendicular transport only which increases its lifetime significantly.On the genesis and nature of Palm Tree Modes in the JET tokamak 14
b) B
v∥ a)
vR
Γ⊥
Γ⊥
+ Γ∥
q=3 q=4
Figure 12. a) A hole is generated between the q = 3 and q = 4 surfaces. The
localized, B field-aligned, polarized hole travels up the density gradient with the radial
advection velocity vR and expands in parallel direction with velocity vk . In this stage,
it is filled by parallel Γk and perpendicular transport Γ⊥ .
b) The hole was able to reach a field line on the q = 3 surface before it was completely
filled and closed on itself. vR = 0 since the charge imbalance is short-circuited by
parallel currents. It is now filled by perpendicular transport Γ⊥ only.
Following that line of thought, plasma edge properties should have a large impact
on the lifetime and whether a PTM can be observed or not. In the following section,
a simple multi-machine comparison is presented for the tokamaks ASDEX Upgrade,
DIII-D, JET and ITER (Fig. 13).
The radial advection velocity vR of the hole is assumed to be caused by the nonlinear
evolution of interchange motions, without any presumption of plasma sheaths. Radial
velocities and radial extensions are computed according to the model in [21]. Sheath
dissipative models like in [22] are not appropriate in this case because of the high radial
velocities of the structures. The hole enters and leaves any given flux tube so quickly
that the plasma in the flux tube cannot react to the pressure perturbation [23]. The
particle density and the edge safety factor for ASDEX Upgrade, JET and DIII-D were
taken from [24]. The associated pedestal temperatures for H-mode plasma with type-I
ELMs were selected from [25]. The required information for ITER was found in [26]
and [27].
Figure 13 summarizes the maximum normalized propagation distances depending on
the filling mechanism. A hole with parallel length Lblob [28] and radial velocity vR can
travel the distance Lcs if it is filled by ions with sound speed cs . Similarly, distances can
be calculated if the hole is filled by thermal electrons (distance Lthe ) or if the current
decays according to the Spitzer resistivity (distance Lei ). The raw data and calculations
are summarized in the appendix in Tab. 5.On the genesis and nature of Palm Tree Modes in the JET tokamak 15
Figure 13. Multimachine comparison of maximum radial propagation distances of
holes under the assumption that these holes are filled on density τcs , thermal τthe and
resistive τei time scales. All corresponding distances (Lcs , Lthe and Lei ) are normalized
by the major radius R of the respective machine.
Holes can travel slightly further in ASDEX Upgrade and DIII-D on thermal τthe and
density time scales τcs if compared to JET or ITER. This is due to the lower pedestal
temperatures for the smaller machines. The strongest influence on the propagation dis-
tance is found on the resistive time scale τei . Figure 13 shows that the collisionality
in the pedestal has the strongest influence on the lifetime of holes. Therefore, ITER is
expected to excel when it comes to lifetimes and propagation distances of holes.
From pellet injection experiments in DIII-D and Tore Supra it is known that the
maxima of the mass deposition profiles are close to the magnetic q = 2 and q = 3
surfaces. Low order rational surfaces appear to slow down or even stop the polarization
drift of the density cloud towards the low field side of the plasma [29]. Since holes are
regions of lower density than the ambient plasma the ∇B polarization and therefore the
drift is in opposite direction to blobs or density clouds. Additionally, it is similarly to
expect that holes can be slowed down or trapped in the vicinity of a rational surface.
Under the assumption that the interchange drive of a polarized ELM-induced hole moves
it into the proximity of a rational surface with low q, it could be slowed down or even
stopped. An illustration of an ELM in the exhaust phase is given in Fig. 14. Holes are
indicated as black filaments, ELM filaments are in white. Large ELM induced holes
could close on themselves in the vicinity of a rational magnetic field line and therefore
detach from the magnetic surface. During this process a closed filament would be
created. For a closed filament, charge interchange imbalance would be short-circuited
by parallel currents which would stop the filament completely. The result would be a
closed, well localized filament with a significantly increased lifetime because it could be
only filled by slow-perpendicular transport. This filament should then have a distinctOn the genesis and nature of Palm Tree Modes in the JET tokamak 16
and rational ratio of toroidal and poloidal periodicity. The lack of current inside the
filament would change the equilibrium locally there.
q=4
q=3
Figure 14. Illustration of an ELM in the exhaust phase at the outboard side of a
tokamak. If an ELM filament (white) is stopped and captured at e.g. the q = 4 surface
(green) an outer mode or current ribbon could be created. Similarly a hole (black)
captured on a q = 3 surface could create a PTM.
In our opinion a promising candidate for the described events above is the Palm
Tree Mode (PTM), an ELM post-cursor. As presented, forward-modeled magnetic
fluctuations from a current filament are in a fair agreement with experimental results.
The physical properties of PTMs are compatible with the properties expected for holes
after ELM-filaments are generated. The strong influence of the collisionality in the
pedestal on the lifetime of the holes explain why PTMs are only observed in JET up to
now (Fig.13). For ITER it is expected that these phenomena will also be present and
influence the confinement in the edge region.
A candidate for trapped blobs are outer modes which are current filaments with excess
current on a rational surface [1]. Taking the proposed model into account outer modes
are ELM filaments, which were not able to propagate to the scrape-off layer (SOL). If
present, outer modes mitigate ELMs. In our view, PTMs are remnants of ELM-induced
holes. Both of these structures are born and trapped in the vicinity of rational surfaces.
Nevertheless, the probability to create PTMs should be lower compared to outer modes
because ELM induced holes would have to travel up the temperature gradient into
regions with increasing parallel transport and could be filled before they can be trapped
on a rational surface.On the genesis and nature of Palm Tree Modes in the JET tokamak 17
5. Conclusion
This paper presented how the concept of blob and hole-like transport can contribute
to shed more light on the genesis and nature of Palm Tree Modes and Outer modes in
the JET tokamak. It was demonstrated that under the current filament assumption it
is possible to forward-model the magnetic signatures of PTMs which shows the same
harmonics structure and reflect also the signal shapes reasonably well.
Additionally, it was demonstrated how the JET in-vessel magnetic coils can be utilized
to get more insights in the genesis and nature of PTMs.
In the introduction in Sec. 1 we raised the question whether ELMs create current density
and density holes in the edge plasma. Based on our findings we suggest that PTMs are
trapped current and density holes produced by ELMs. A fruitful further direction of
research could be whether or not L-mode blobs and holes in ITER could be big enough
to produce similar structures. This could have implications on the L-mode confinement
and the LH-transition.
We also conclude that the rich harmonics in FFTs are probably not due to MHD-modes
but rather because of the high localisation of the filament. FFT spectra are therefore
probably misleading in PTM analysis. Other tools like empirical mode decomposition
and Hilbert amplitude spectra therefore give a better representation of the physical
nature of the PTM [30].
6. Acknowledgements
This work has been carried out within the framework of the EUROfusion Consortium
and has received funding from the EURATOM research and training programme 2014-
2018 under Grant Agreement No. 633053. The views and opinions expressed herein do
not necessarily reflect those of the European Commission. The support by the Austrian
Science Fund (Fonds zur Förderung der wissenschaftlichen Forschung in Österreich)
under grant No. P19901 is also gratefully acknowledged. Additional support was lend
by the österreichische Forschungsgemeinschaft (Austrian Research Community) under
grant 06/11454, International Communication.
One of the authors, Christian Maszl, wants to thank Codrina Ionita, Thijs W. Versloot,
Benjamin Lagier and Mathias Brix for valuable discussions and support during his visits
at JET and the DTU plasma physics group for their hospitality.
References
[1] E R Solano, P J Lomas, B Alper, G S Xu, Y Andrew, G Arnoux, A Boboc, L Barrera, P Belo,
A Beurskens, M Brix, K Crombe, E De La Luna, S Devaux, T Eich, S Gerasimov, C Giroud,
D Harting, D Howell, A Huber, G Kocsis, A Korotkov, A Lopez-Fraguas, M F F Nave,
E Rachlew, F Rimini, S Saarelma, A Sirinelli, S D Pinches, H Thomsen, L Zabeo, and D Zarzoso.
Observation of confined current ribbon in JET plasmas. Phys. Rev. Lett., 104:185003, 2010.
[2] H R Koslowski, B Alper, D N Borba, T Eich, S E Sharapov, C P Perez, E Westerhof, and JET-On the genesis and nature of Palm Tree Modes in the JET tokamak 18
EFDA contributors. Observation of the palm tree mode, a new MHD mode excited by type-I
ELMs on JET. Nucl. Fus., 45(2005):201–208, 2005.
[3] G D Conway. Turbulence measurements in fusion plasma. Plasma Phys. Control. Fusion,
50(124026):1–10, 2008.
[4] C. Ionita, V. Naulin, F. Mehlmann, J.J. Rasmussen, H.W. Müller, R. Schrittwieser, V. Rohde,
A.H. Nielsen, Ch. Maszl, P. Balan, and A. Herrmann and. Radial transport in the far scrape-off
layer of ASDEX upgrade during l-mode and ELMy h-mode. Nuclear Fusion, 53(4):043021, apr
2013.
[5] S J Zweben. Search for coherent structure within tokamak plasma turbulence. Physics of Fluids,
28:974–982, 1985.
[6] G S Xu, V Naulin, W Fundamenski, C Hidalgo, J A Alonso, C Silva, B Goncalves, A H Nielsen,
J Juul Rasmussen, S I Krasheninnikov, B N Wan, M Stamp, and JET-EFDA contributors.
Blob/hole formation and zonal-flow generation in the edge plasma of the JET tokamak. Nucl.
Fus., 49(092002):7, 2009.
[7] M Spolaore, N Vianello, M Agostini, R Cavazzana, E Martines, P Scarin, G Serianni, E Spada,
M Zuin, and V Antoni. Direct measurement of current filament structures in a magnetic-
confinement fusion device. Phys. Rev. Lett., 102(165001):1–4, 2009.
[8] N Bisai, A Das, S Deshpande, R Jha, P Kaw, A Sen, and R Singh. Formation of a density blob
and its dynamics in the edge ant the scrape-off layer of a tokamak plasma. Physics of Plasmas,
12(102515), 2005.
[9] R Scannell, A Kirk, N Ben Ayed, P G Carolan, G Cunningham, J McCone, S L Prunty, and
M J Walsh. Experimental investigation into ELM filament formation on MAST. Plasma Phys.
Control. Fusion, 49(9):1431, 2007.
[10] N Vianello, V Naulin, R Schrittwieser, H W Müller, M Zuin, C Ionita, J J Rasmussen, F Mehlmann,
V Rohde, R Cavazzana, and M Maraschek. Direct observation of current in type-I edge-localized-
mode filaments on the ASDEX Upgrade tokamak. Phys. Rev. Lett., 106(12):125002, 2011.
[11] K Kamiya, N Asakura, J Boedo, T Eich, G Frederici, M Fenstermacher, K Finken, A Herrmann,
J L Terry, A Kirk, B Koch, A Loarte, R Maingi, R J Maqueda, E Nardon, N Oyama, and
R Sartori. Edge localized modes: recent experimental findings and related issues. Plasma
Phys. Control. Fusion, 49:S43–S62, 2007.
[12] J R Myra. Current carrying blob filaments and edge-localized-mode dynamics. Physics of Plasmas,
14(10):102314, 2007.
[13] T W Versloot, P C de Vries, C Giroud, M.-D. Hua, M Beurskens, M Brix, T Eich, E De La Luna,
T Tala, V Naulin, K D Zastrow, and JET-EFDA Contributors. Effect of ELMs on rotation and
momentum confinement in H-mode discharges at JET. ECA, 33E:P–2.170, 2009.
[14] Ch Maszl, V Naulin, M Brix, T.W. Versloot, and R Schrittwieser. Palm trees and islands – Current
filaments in the edge of JET. Journal of Nuclear Materials, 415(1):S451–S454, August 2011.
[15] B Alper, L Barrera, M Baruzzo, A Botrugno, P Buratti, L Figini, D F Howell, C Giroud, E De La
Luna, P Piovesan, O Tudisco, and JET-EFDA Contributors. MHD mode localisation in the
JET tokamak. In M Mateev and E Benova, editors, ECA, volume 33E, pages P–5.169, 2009.
[16] Benjamin Lagier, Volker Naulin, and Adrien Bidaud. ELMs filaments and Palm Tree Mode
Observation. EFDA-JET TF-T and Grenoble INP, Culham Science Centre, Abingdon,
Oxfordshire OX14 3EA, efda-jet i edition, 2009.
[17] P Migliucci, V Naulin, and J E T EFDA Contributors. Magnetic signature of current carrying
edge localized modes filaments on the Joint European Torus tokamak. Physics of Plasmas,
17(7):72507, 2010.
[18] Darren McDonald and Ewald Springmann. FLUSH User’s Guide, 2006.
[19] H.A. Wheeler. Simple inductance formulas for radio coils. Radio Engineers, Proceedings of the
Institute of, 16(10):1398–1400, Oct 1928.
[20] http://users.jet.efda.org/pages/mags/mhd/kc1m/kc1m-index.html. Online, Last accessed: 17th
November 2010.On the genesis and nature of Palm Tree Modes in the JET tokamak 19
[21] O E Garcia, N H Bian, V Naulin, A H Nielsen, and J Juul Rasmussen. Mechanism and scaling
for convection of isolated structures in nonuniformly magnetized plasmas. Physics of Plasmas,
12(9):90701, 2005.
[22] S I Krasheninnikov. On scrape off layer plasma transport. Physics Letters A, 283:368–370, 2001.
[23] W Fundamenski, O E Garcia, V Naulin, R A Pitts, A H Nielsen, J Juul Rasmussen, J Horacek, J P
Graves, and J E T EFDA Contributors. Dissipative processes in interchange driven scrape-off
layer turbulence. Nucl. Fus., 47(5):417, 2007.
[24] C.F. Maggi and R.J. Groebner and N. Oyama and R. Sartori and L.D. Horton and A.C.C. Sips
and W. Suttrop and the ASDEX Upgrade Team and A. Leonard and T.C. Luce and M.R. Wade
and the DIII-D Team and Y. Kamada and H. Urano and the JT-60U Team and Y. Andrew .
Characteristics of the H-mode pedestal in improved confinement scenarios in ASDEX Upgrade,
DIII-D, JET and JT-60U. Nucl. Fus., 47(7):535, 2007.
[25] T Hatae, M Sugihara, A E Hubbard, Yu. Igitkhanov, Y Kamada, G Janeschitz, L D Horton,
N Ohyabu, T H Osborne, M Osipenko, W Suttrop, H Urano, and H Weisen. Understanding of H
mode pedestal characteristics using the multimachine pedestal database. Nucl. Fus., 41(3):285,
2001.
[26] M Sugihara and T Takizuka and International H-Mode Edge Pedestal Expert Group.
Examinations on various scalings for the H-mode edge pedestal width. Plasma Phys. Control.
Fusion, 44(5A):A299, 2002.
[27] P B Snyder, N Aiba, M Beurskens, R J Groebner, L D Horton, A E Hubbard, J W Hughes, G T A
Huysmans, Y Kamada, A Kirk, C Konz, A W Leonard, J Lönnroth, C F Maggi, R Maingi, T H
Osborne, N Oyama, A Pankin, S Saarelma, G Saibene, J L Terry, H Urano, and H R Wilson.
Pedestal stability comparison and ITER pedestal prediction. Nucl. Fus., 49(8):85035, 2009.
[28] J P Gunn, C Boucher, M Dionne, I Duran, V Fuchs, T Loarer, I Nanobashvili, R Pánek, J.-
Y. Pascal, F Saint-Laurent, J Stöckel, T Van Rompuy, R Zagórski, J Adámek, J Bucalossi,
R Dejarnac, P Devynck, P Hertout, M Hron, G Lebrun, P Moreau, F Rimini, A Sarkissian,
and G Van Oost. Evidence for a poloidally localized enhancement of radial transport in the
scrape-off layer of the Tore Supra tokamak. J. Nucl. Mat., 363-365:484–490, 2007.
[29] N Commaux, B Pégourié, L R Baylor, F Köchl, P B Parks, T C Jernigan, A Géraud, and
H Nehme. Influence of the low order rational q surfaces on the pellet deposition profile. Nucl.
Fus., 50(2):25011, 2010.
[30] Ch. Maszl, and M. Hoffmann, V Naulin, J J Rasmussen, F Gennrich, R Schrittwieser, and JET-
EFDA contributors. Empirical Mode Decomposition and its application to Palm Tree Mode
analysis. In Proceedings of the 38th EPS conference on plasma physics, Strasbourg, page P4.064,
2011.On the genesis and nature of Palm Tree Modes in the JET tokamak 20
Palm tree mode database
PTMs where searched manually with the IDL program SPECVIEW at the JET Analysis
Cluster (JAC). Tab. 3 and Tab. 4 summarizes the palm tree modes found. The second
column gives the time windows where the PTMs appear. The abbreviation TBE
(terminated by ELM) indicates if the mode was stopped by a subsequent ELM (y)
or reached its unperturbed lifespan (n). The hyphen (-) marks inconclusive cases. TW
marks pulses were no fast time window is available. The columns ECE and MAGS give
the sample frequencies of the respective diagnostics. The MHD section documents the
fundamental frequencies of other MHD activity. The year column allows a discrimination
between the different divertor configurations (Tab. 2).
Table 2. Divertor configurations in JET from 1999-2009.
Period Name Abbrevation
1999-2001 MkII Gas Box MkII GB
2002-2004 MkII Septum Replacement Plate MkII SRP
2005-2009 MkII High Delta MkII HDOn the genesis and nature of Palm Tree Modes in the JET tokamak 21
Table 3. Palm tree mode database - part I
Pulse t (s) TBE ECE MAGS MHD Year
52011 59.14-59.22 - 250 kHz 250 kHz 39 kHz 2000
58982 57.26-57.39 y 250 kHz 250 kHz 12 kHz 2003
72299 61.44-61.48 n TW 1 MHz 2008
73568 52.80-53.20 n 250 kHz 2 MHz 39 kHz 2008
73569 51.37-51.44 n TW 2 MHz 29 kHz 2008
74812 54.56-54.64 - TW 1 MHz 11 kHz 2008
74812 56.35-56.45 n TW 1 MHz 2008
75411 57.10-57.20 n TW 1 MHz 2008
75411 57.86-57.92 n TW 1 MHz 2008
76793 49.60-49.80 - TW 1 MHz 9 kHz 2009
77184 53.35-53.40 - TW 1 MHz 32 kHz 2009
77185 55.75-55.95 n TW 2 MHz 2009
77186 51.12-51.15 y TW 1 MHz 2009
77188 50.89-50.93 y TW 1 MHz 2009
77319 57.10-57.15 y TW 1 MHz 2009
77326 63.90-64.05 n TW 1 MHz 2009
77326 65.10-65.20 n TW 1 MHz 2009
77326 65.50-65.70 n TW 1 MHz 2009On the genesis and nature of Palm Tree Modes in the JET tokamak 22
Table 4. Palm tree mode database - part II
Pulse t (s) TBE ECE MAGS MHD Year
77326 66.10-66.20 n TW 1 MHz 2009
77329 64.20-64.50 n TW 1 MHz 2009
77329 65.30-65.40 n TW 1 MHz 2009
77329 65.90-66.00 n TW 1 MHz 2009
77331 65.30-65.40 n TW 1 MHz 2009
77332 66.00-66.12 y TW 1 MHz 2009
77335 63.90-64.10 n TW 1 MHz 2009
77335 65.30-65.45 n TW 1 MHz 2009
77342 63.90-64.00 n TW 1 MHz 2009
77342 64.34-64.41 n TW 1 MHz 2009
78690 55.40-55.50 n TW 1 MHz 2009
78712 53.10-53.60 n TW 1 MHz 11 kHz 2009
78712 55.40-55.70 n TW 1 MHz 2009
79619 57.25-57.35 n TW 1 MHz 13 kHz 2009
79620 45.85-45.92 n TW 1 MHz 2009
79620 46.49-46.58 n TW 1 MHz 2009
79744 58.10-58.25 n TW 1 MHz 16 kHz 2009
79745 61.10-61.30 n TW 1 MHz 26 kHz 2009On the genesis and nature of Palm Tree Modes in the JET tokamak 23
Multi-machine comparison
Tokamak JET ASDEX U ITER DIII-D
−3
n (m ) 6.0 × 10¹⁹ 6.0 × 10¹⁹ 1.0 × 10²⁰ 6.0 × 10¹⁹ particle density
Te,i (eV) 1200 400 5000 700 temperatures
ln Λ 16 15 17 15 Coulomb log.
ηk (Ωm) 2.0 × 10⁻⁸ 9.8 × 10⁻⁸ 2.5 × 10⁻⁹ 4.8 × 10⁻⁸ Spitzer res.
R (m) 3.1 1.65 6.2 1.69 major radius
q 3.0 4.0 3.0 4.0 safety factor
B (T) 2.3 3.0 5.0 3.0 magnetic field
ωci (Hz) 1.1 × 10⁸ 1.5 × 10⁸ 2.4 × 10⁸ 1.5 × 10⁸ i+ gyro freq.
cs (m/s) 3.4 × 10⁵ 2.0 × 10⁶ 6.9 × 10⁵ 2.6 × 10⁵ sound speed
vthe (m/s) 2.1 × 10⁷ 1.2 × 10⁷ 4.2 × 10⁷ 1.6 × 10⁷ e− thermal vel.
ρs (m) 3.1 × 10⁻³ 1.4 × 10⁻³ 2.9 × 10⁻³ 1.8 × 10⁻³ i+ gyro rad.
Blob
Lblob (m) 2.4 1.7 4.9 1.8 parallel length
∆n/n 0.5 0.5 0.5 0.5 perturbation
Rblob (m) 1.1 × 10⁻² 5.7 × 10⁻³ 1.2 × 10⁻² 7.2 × 10⁻³ radial blob size
vblob (m/s) 2.0 × 10⁴ 1.2 × 10⁴ 3.1 × 10⁴ 1.7 × 10⁴ blob velocity
Timescales
τcs (s) 7.2 × 10⁻⁶ 8.8 × 10⁻⁶ 7.0 × 10⁻⁶ 6.8 × 10⁻⁶ Lblob /cs
τthe (s) 1.2 × 10⁻⁷ 1.5 × 10⁻⁷ 1.2 × 10⁻⁷ 1.1 × 10⁻⁷ Lblob /vthe
τei (s) 3.0 × 10⁻⁴ 6.1 × 10⁻⁴ 1.4 × 10⁻⁴ 1.2 × 10⁻⁵ ne2 /mηk
Propagation
Lcs (m) 2.4 1.7 4.9 1.8 vblob · τcs
Lthe (m) 2.4 × 10⁻³ 1.7 × 10⁻³ 3.6 × 10⁻³ 1.9 × 10⁻³ vblob · τthe
Lei (m) 0.6 7.0 × 10⁻² 4.4 0.2 vblob · τei
Table 5. Multimachine comparison for characteristic blob sizes, timescales and
propagation estimates.You can also read