Unveiling the Relationship Between Sea Surface Hydrographic Patterns and Tuna Larval Distribution in the Central Mediterranean Sea - Frontiers
←
→
Page content transcription
If your browser does not render page correctly, please read the page content below
ORIGINAL RESEARCH
                                                                                                                                             published: 18 August 2021
                                                                                                                                       doi: 10.3389/fmars.2021.708775

                                             Unveiling the Relationship Between
                                             Sea Surface Hydrographic Patterns
                                             and Tuna Larval Distribution in the
                              Edited by:
                              Ana Rotter,
                                             Central Mediterranean Sea
            National Institute of Biology
                          (NIB), Slovenia    Stefania Russo 1,2*, Marco Torri 3*, Bernardo Patti 4 , Patricia Reglero 5 ,
                                             Diego Álvarez-Berastegui 5 , Angela Cuttitta 2† and Gianluca Sarà 1†
                       Reviewed by:
                   Benjamin Galuardi,        1
                                              DiSTeM-UNIPA, Department of Earth and Marine Science, University of Palermo, Palermo, Italy, 2 CNR-ISMed, National
         National Oceanographic and          Research Council, Institute for Studies on the Mediterranean, Detached Unit of Palermo, Palermo, Italy, 3 CNR-IAS, National
 Atmospheric Administration, Office of       Research Council, Institute for the Anthropic Impacts and Sustainability in Marine Environment, Detached Unit of Capo
    Habitat Conservation, Restoration        Granitola, Trapani, Italy, 4 CNR-IAS, National Research Council, Institute for the Anthropic Impacts and Sustainability in
                Center, United States        Marine Environment, Detached Unit of Palermo, Palermo, Italy, 5 IEO-COB, Instituto Español de Oceanografía, Centro
                    Lorenzo Ciannelli,       Oceanográfico de Baleares, Palma de Mallorca, Spain
Oregon State University, United States
                     Hung-Yen Hsieh,
National Dong Hwa University, Taiwan         Thunnus thynnus (Atlantic bluefin tuna, ABT) and other tuna species reproduce in the
                    *Correspondence:         Mediterranean Sea during the summer period. Despite the Central Mediterranean Sea,
                            Marco Torri
                                             the Strait of Sicily in particular, being a key spawning site for many tuna species, little
                   marco.torri@ias.cnr.it
                         Stefania Russo      is known on the effects of oceanographic variability on their larval distribution in this
            stefania.russo@ismed.cnr.it;     area. The abundance and presence-absence of larval specimens for three tuna species
                   srusso.rs@gmail.com
                                             (ABT, bullet tuna and albacore) were modeled in order to examine their relationships
 † These   authors share last authorship     with environmental factors, by analysing historical in situ information collected during
                                             seven annual surveys (2010–2016). The results revealed that most tuna larvae for the
                   Specialty section:
         This article was submitted to       three species were found in the easternmost part of the study area, south of Capo
    Marine Fisheries, Aquaculture and        Passero. This area is characterized by a stable saline front and warmer nutrient-poor
                     Living Resources,
               a section of the journal
                                             water, and it has different environmental conditions, compared with the surrounding
          Frontiers in Marine Science        areas. The models used to investigate the presence-absence and abundance of the three
             Received: 12 May 2021           species showed that ABT was the most abundant, followed by bullet tuna and albacore.
             Accepted: 21 July 2021
                                             The presence and abundance data collected are comparable with those of other
           Published: 18 August 2021
                                             spawning areas in the Mediterranean. Regarding biological and physical parameters,
                               Citation:
  Russo S, Torri M, Patti B, Reglero P,      the results suggest that temperature, salinity, and day of the year are the key factors for
  Álvarez-Berastegui D, Cuttitta A and       understanding the ecological mechanisms and geographical distribution of these species
           Sarà G (2021) Unveiling the
   Relationship Between Sea Surface
                                             in this area. Temperature affects the presence of ABT larvae and salinity, which, with a
      Hydrographic Patterns and Tuna         physical barrier effect, is a key factor for the presence-absence of bullet and albacore
      Larval Distribution in the Central
                                             and for albacore abundance.
                   Mediterranean Sea.
            Front. Mar. Sci. 8:708775.       Keywords: Thunnus thynnus, Auxis rochei, Thunnus alalunga, multivariate statistical analysis, spawning,
     doi: 10.3389/fmars.2021.708775          ichthyoplankton, Mediterranean Sea

Frontiers in Marine Science | www.frontiersin.org                                   1                                           August 2021 | Volume 8 | Article 708775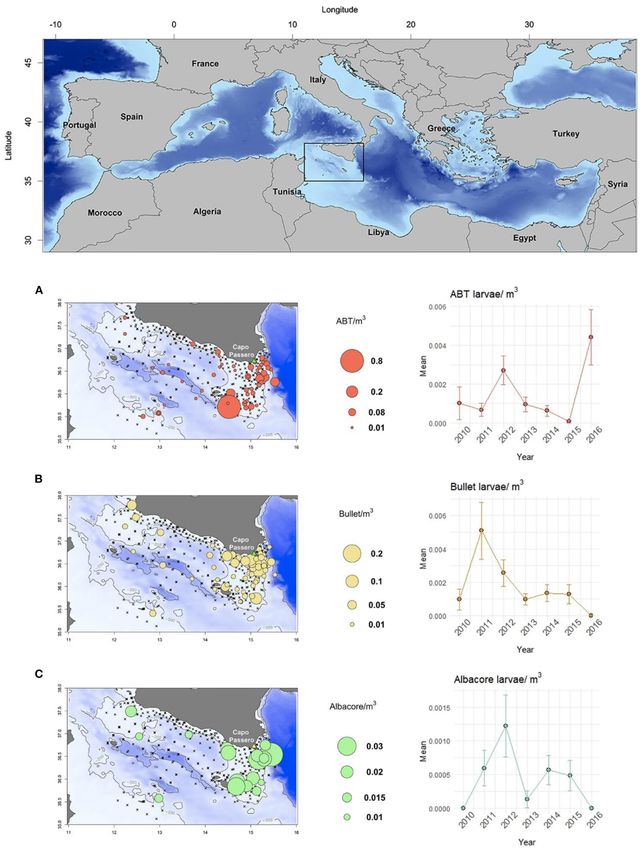
Russo et al.                                                                                                               Tuna Larval Distributions

INTRODUCTION                                                              larvae over a 3-year period has shown that the presence of tuna
                                                                          larvae in Tunisia is also related to this water mass (Koched et al.,
Atlantic bluefin tuna (Thunnus thynnus, Linnaeus, 1758) is one            2012, 2013, 2016; Zarrad et al., 2013). In contrast, little is known
of the most valuable tuna species in the world. Exploited by              about the south of Sicily, an area characterized by high mesoscale
humans since ancient times, it has long been a valuable resource          variability, vortices, and meanders (García Lafuente et al., 2002)
whose meat can now reach one of the highest prices in the                 because of incoming Atlantic freshwater and warmer resident
international market (Mylonas et al., 2010; Sun et al., 2019).            water (Robinson et al., 2001). These environmental data have
The International Commission for the Conservation of Atlantic             not yet been analyzed with tuna larval data from oceanographic
Tunas (ICCAT) manages this species and considers two different            surveys in the study area.
stocks: the western stock whose main spawning ground is in the                Another common characteristic in the Balearic Islands and
Gulf of Mexico (although according to new evidence spawning               Tunisia is that ABT larvae are commonly found together with
also occurs in the Slope Sea), and the eastern stock that spawns          two other tuna species, bullet tuna (Auxis rochei, Risso, 1810)
in the Mediterranean Sea (Muhling et al., 2017). Within the               and albacore (Thunnus alalunga, Bonnaterre, 1788), suggesting
Mediterranean Sea, three main areas are well recognized, the              that the three species have overlapping spawning grounds
western area located around the Balearic Islands; the central area        (Alemany et al., 2010; Koched et al., 2013). Evidence from gonad
in the Tyrrhenian Sea and around Sicily, northeast of the Gulf of         sampling suggests that the timing of spawning occurs around
Sirte, Malta, and Tunisia; and the Eastern area that comprises the        the same time in the Western and in the Central Mediterranean,
Ionian Sea and the area around Cyprus (Karakulak and Yıldız,              between June and July (Heinisch et al., 2008), a pattern that is
2016; Muhling et al., 2017).                                              corroborated by temporal changes in the abundance of larvae
    There is substantial discussion about the sub-population              (Alemany et al., 2010).
structure of Atlantic bluefin tuna (ABT) within the                           Considering these basic knowledge gaps and the apparent
Mediterranean Sea and the occurrence of spatio-temporal                   need for in-depth analysis, this study aims to better analyze
mixing during spawning. The major spawning fraction is formed             the lesser-known central Mediterranean Sea spawning area.
by large migrant adults that enter from the Atlantic Ocean                The objectives are to better understand the distribution and
following the Atlantic waters through the Strait of Gibraltar             abundance of the three species and relate them to the biotic
from April to May. Spawning occurs from June to July (Alemany             and abiotic factors of the area, thus verifying their main
et al., 2010; Reglero et al., 2012; Abascal et al., 2016). Some           ecological drivers. This can enhance the knowledge of the Central
studies suggest that there is also a resident fraction of adults          Mediterranean, expanding the ecological knowledge of these
that remain in the Mediterranean Sea throughout the entire                species within the basin. We explored the environmental drivers
year or at least for a greater part of it (Cermeno et al., 2015;          affecting ABT, bullet and albacore tuna at the larval stage by
Livi et al., 2019). These individuals feed in different locations         analyzing presence-absence and abundance data, focusing on the
during the winter (Cermeno et al., 2015) depending on their               early life stage.
ontogenetic stage (Sarà and Sarà, 2007). Although there is no
conclusive scientific evidence, this resident fraction is believed
to spawn in the Eastern Mediterranean and may also be in                  METHODS
the Central Mediterranean (Cermeno et al., 2015). Migrants
and residents may mix during reproductive events (Livi et al.,            Field Sampling
2019), and adult tagging data show that some individuals                  The samples are from ichthyoplankton surveys carried out in
that remained in the Mediterranean Sea move to the Central                the Strait of Sicily by the Italian National Research Council
Mediterranean during the spawning period where large migrant              (CNR) during the summertime (June–August) from 2010 to
adults can also be found (Block et al., 2005; Fromentin, 2010).           2016. A regular sampling grid was used (1/10◦ × 1/10◦ along
Studies to investigate the lesser-known spawning areas, such              the continental shelf, and 1/5◦ × 1/5◦ offshore). The number of
as the central Mediterranean Sea, are crucial to increase the             sampled sites investigated in each year, as well as the sampling
understanding of the dynamics of the Mediterranean stock                  period, is summarized in Table 1. The sites are located along
of this species. As such, questions that remain unanswered                transects perpendicular to the southern Sicilian coast (Figure 1).
warrant attention.                                                           Ichthyoplankton samples were collected 24 h a day, with
    The presence of larvae in the Western Mediterranean, one              oblique tows of a Bongo 40 net with 200 µ mesh size. It was
of the best studied spawning grounds, suggests ABT to be an               equipped with a flow meter and towed at a ship speed of 2 knots,
environmental spawner tightly linked to the less saline Atlantic          with a descent speed of 0.75 m/s and an ascent speed of 0.33 m/s.
waters that enter through the Strait of Gibraltar and flow                The net was lowered from the seabed to the surface, but sampling
northward. There, they encounter the more saline resident water           depths did not exceed 100 m.
mass around the Balearic Islands, a high dynamic mesoscale area              The collected samples were immediately stored onboard in
with a marked front (Alemany et al., 2010; Reglero et al., 2012;          70% ethanol and later processed in the land-based laboratory
Alvarez-Berastegui et al., 2014). The Atlantic waters then enter          for identification of tuna larvae at the highest possible
the Strait of Sicily, flowing toward Tunisia and the South of             taxonomic level according to Rodríguez et al. (2017). Following
Sicily, from west to east (García Lafuente et al., 2002; Cuttitta         larvae sorting, the remaining zooplankton was collected to
et al., 2004; Bonanno et al., 2014). A consecutive sampling of tuna       obtain dried zooplankton weight. Water column temperature

Frontiers in Marine Science | www.frontiersin.org                     2                                     August 2021 | Volume 8 | Article 708775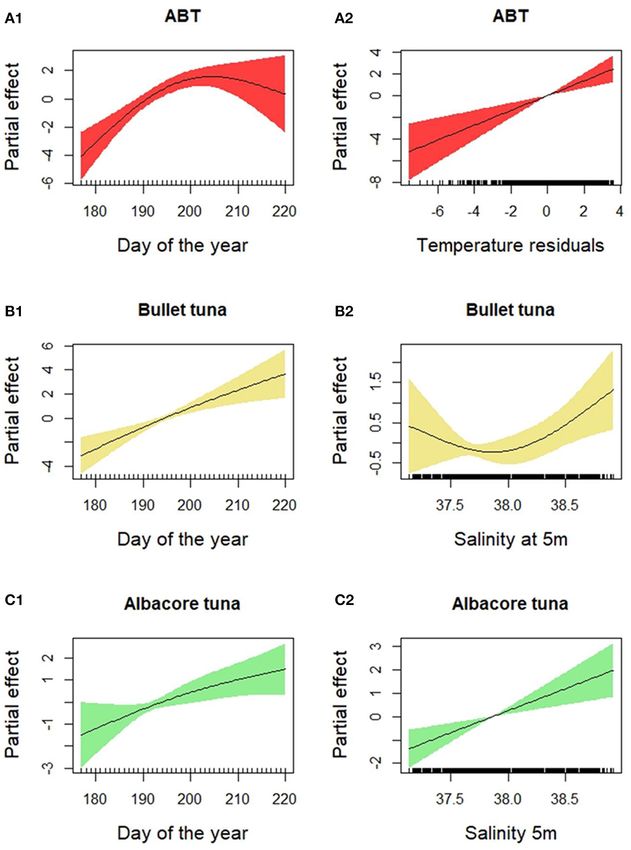
Russo et al.                                                                                                                                Tuna Larval Distributions

TABLE 1 | Information on sampling strategy and statistics for the three tuna species.

Year              Sampling period                   N. Sites          Species               Mean larva (m3 )          SD                   Freq. of occurrence

TOT               26 June−8 August                   1167             ABT                        0.002                0.03                          0.05
                                                                      Bullet                     0.001               0.009                          0.05
                                                                      Albacore                  0.0004               0.003                          0.02
2010              26 June−13 July                     185             ABT                        0.006                0.06                         0.038
                                                                      Bullet                     0.001                0.01                         0.043
                                                                      Albacore                     0                   0                             0
2011              9–22 July                           130             ABT                        0.001               0.004                         0.031
                                                                      Bullet                     0.004               0.021                          0.1
                                                                      Albacore                  0.0005               0.003                         0.023
2012              5–21 July                           146             ABT                        0.003                0.01                          0.11
                                                                      Bullet                     0.003                0.01                          0.11
                                                                      Albacore                   0.001                0.01                          0.05
2013              27 June−15 July                     204             ABT                       0.0009               0.005                         0.039
                                                                      Bullet                    0.0008               0.004                         0.044
                                                                      Albacore                  0.0001               0.001                         0.005
2014              23 July−8 August                    162             ABT                        0.001               0.003                         0.031
                                                                      Bullet                     0.001               0.006                         0.068
                                                                      Albacore                  0.0004               0.003                         0.031
2015              17 July−1 August                    154             ABT                      7.9E−05               0.001                         0.006
                                                                      Bullet                   1.1E−03               0.007                         0.032
                                                                      Albacore                 6.9E−04               0.004                         0.032
2016              1–11 July                           173             ABT                        0.005               0.017                         0.121
                                                                      Bullet                    9E−05                0.001                         0.006
                                                                      Albacore                     0                   0                             0

(◦ C), and salinity (PSU) measurements were gathered at all                             volume of filtered water and the maximum depth of the sampling
sites using the multi-parameter CTD SBE 11 plus probe                                   gear, we were able to obtain an unbiased and normalized
(underwater unit).                                                                      expression of larval density per m2 .
                                                                                           The first model building phase was dedicated to selecting
Data Exploration and Statistical Modeling                                               variables that best describe the system and that were potentially
Mean larval densities at stations with different bottom depths                          useful for understanding the tuna larvae spatio-temporal
were explored to identify potential spatial preferences regarding                       distribution. This step also considered information from similar
bathymetry. The distribution of observed larval presence and                            studies performed on other fish species. We started by including
absence was explored using density plots. Generalized additive                          all the available and suitable data for the analysis, such as
models (GAMs) allowed us to investigate the relationships                               geographic coordinates and dissolved oxygen, but excluding
between the spatial distribution of tuna larval specimens and                           stratification of the surface water, which is a typical condition
environmental factors. Presence–absence data, from all the                              characterizing the summer season in the southeastern sector of
stations, and abundance data, only from positive stations, were                         the study area, where most of the tuna larvae were found; and
used as dependent variables in the models. This helped determine                        terrestrial runoff, because of limited drainage basin in an island
the main covariates that control larval occurrence (calculated                          such as Sicily. Finally, tidal excursion was excluded as this is very
as the probability of presence) and the density of tuna larvae                          limited in the waters of the study area.
per unit area. The binomial distribution family was selected for                           By Pearson’ s correlation, the collinearity among the variables
presence–absence data and the Gamma family for abundance.                               was analyzed. In case of a significant correlation between two
To transform the catch effort for abundance, we standardized the                        variables, we selected the one that fitted best with the dependent
number of larvae with the following formula:                                            variables and excluded the other. For example, longitude was
                                                                                        positively and significantly correlated to temperature anomaly,
                CPUA = (100 ∗ larvae/m3 ) ∗ BD                                          mostly because of the upwelling in the northwestern zone
                                                                                        (Supplementary Material), which, in some years, was stronger
where CPUA is the “capture per unit area”, larvae/m3 is the                             and produced lowest temperature anomaly values.
number of larvae divided by the filtered water volume in m3 ,                              The last covariates considered in the models were: “Year” as a
and BD is the depth in meters reached by the bongo net during                           factor and with random effect, in order to focus the analysis on
sampling (Alvarez-Berastegui et al., 2018). Considering the                             environmental relationships and not on interannual fluctuations;

Frontiers in Marine Science | www.frontiersin.org                                   3                                        August 2021 | Volume 8 | Article 708775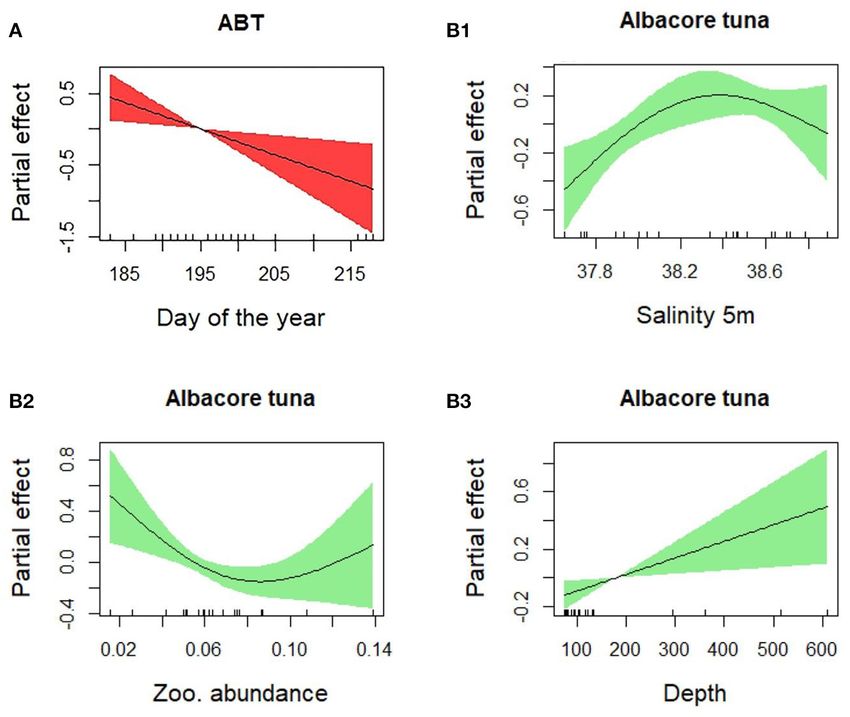
Russo et al.                                                                                                                                    Tuna Larval Distributions

 FIGURE 1 | Study area and geographical distribution of (A) Atlantic bluefin tuna (ABT), (B) bullet tuna, and (C) albacore tuna, and interannual changes in nominal
 larval densities in sites repeated annually.

Frontiers in Marine Science | www.frontiersin.org                                  4                                            August 2021 | Volume 8 | Article 708775
Russo et al. Tuna Larval Distributions
surface “Salinity” (PSU) as recorded by the CTD probe at 5 m; years with the coldest temperatures (Supplementary Material).
“Day of the year,” to verify the presence-absence and abundance The hottest temperature anomalies were detected in 2012,
peak, due to the temporal choice for spawning as dictated by 2015, and 2016 (Figure 2). More marked upwellings than usual
the adults; “Zooplankton density” (standardized for the volume in the central-western sector were recorded in 2011, 2013,
of filtered water, dry weight mg/Vol), to understand the role of and 2014.
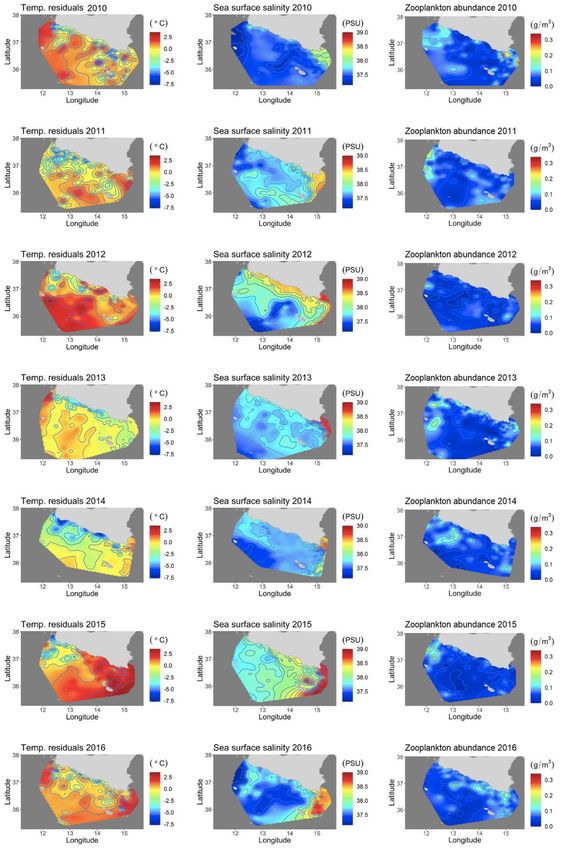
possible food availability; “Residual of superficial temperature” Salinity data showed saltier water masses in the eastern zone
(◦ C), calculated as the residual of a GAM, where temperature (at for all the years (Figure 2). A thermohaline front was found in
5m) was fitted to the factor “Day of the year”, in order to avoid the the same area, every year, beyond 15◦ E of longitude.
correlation between these parameters and allow for the different The Zooplankton data showed oligotrophic waters every year,
timing of annual surveys. except for a few points with higher biomass in 2010 and general
The final formulas used for the (i) presence-absence model greater abundance in the western sector (Figure 2).
and (ii) larval abundance model were as follows:
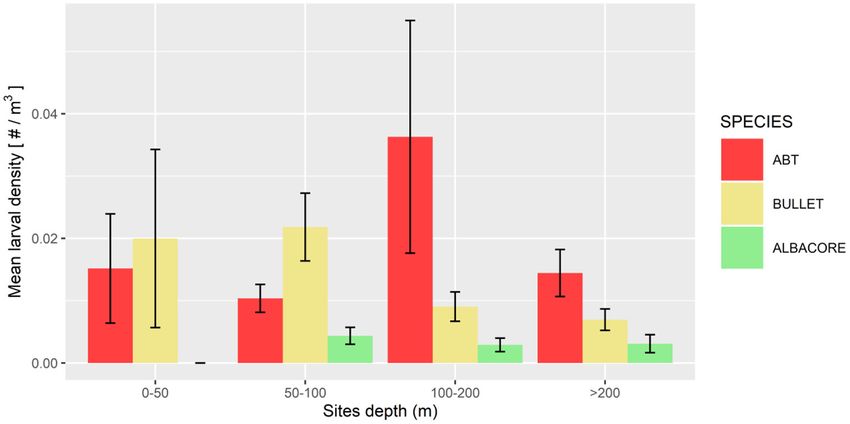
Larval Data and Environmental Factors
(i) Probability of presence ∼ Year + Sal. + Yearday +
The mean larval density related to the bottom depth showed
Zoo. Den. + Temp. residuals + Depth
that the three species were distributed in areas with different
(ii) CPUA ∼ Year + Sal. + Yearday + Zoo. Den. +
bathymetric profiles (Figure 3). ABT was the species distributed
Temp. residuals + Depth
more offshore, in areas where the bottom depth is deeper
A step-wise procedure allowed the progressive removal of non- than 100 m. Bullet tuna distribution was more coastal, showing
significant covariates (p > 0.05), ensuring that only independent higher probabilities of presence in shallower stations (0–100 m),
variables were used and non-significant variables were excluded. although individuals were found in the entire bathymetric
This had the effect of the most significant variables being easier range. Albacore was present evenly in bathymetric range deeper
to understand, removing interferences in the additive model, than 50 m. Regarding temperature, ABT larvae were present at
dictated by less significant variables. temperatures higher than 21◦ C. Similarly, bullet tuna was found
All simulations, statistical analyses, and plotting were in waters warmer than 20.9◦ C, and albacore was found in waters
performed using the R statistical software (RStudio Inc, 2016). warmer than 20◦ C (Figures 4A–C). With reference to salinity,
In particular, GAMs were fitted using the mgcv library the presence of the three species showed two peaks at around
(Wood, 2011). 37.5 and 38.5 (Figures 4D–F). The GAM analysis explored the
relationship between larval distribution and putative covariate
factors that may drive the presence and abundance of the three
RESULTS
species (Table 2).
Spatio-Temporal Distribution The presence of Atlantic bluefin tuna (ABT) was positively
While the three species under investigation [Atlantic bluefin related to “Day of the year,” “Temperature residuals,” and “Year”
tuna (ABT), bullet tuna and albacore] are commonly found (p < 0.001 for all the three variables) (Table 2, Figures 5A1,A2).
in the samples (Table 1), other tuna and tuna-like species are The presence of ABT increased during the spawning season,
sporadically found, such as Sarda sarda, Euthynnus alletteratus, reaching a maximum around day 200 (July 19th). The larvae
and Katsuwonus pelamis. ABT larvae were constantly more were found in warm waters, and the probability of their presence
abundant in the eastern side of the study area (between 14.5 and was higher when temperatures exceeded the average temperature
15.5◦ E longitude) and occurred every year between Capo Passero trends. The presence of bullet tuna was positively related to “Day
(the southernmost tip of Sicily) and Malta Island (Figure 1). of the year” (p < 0.001) with higher probability of finding larvae
Similar annual abundance was found, but in 2016 there was as the season advances. Regarding “Salinity” (p < 0.05), bullet
higher average abundance (Figure 1A). Bullet tuna larvae had tuna showed a flat trend of up to 38 PSU and increased from
a geographical distribution similar to that of ABT annually, that point onward (Figures 5B1,B2). As seen for bullet tuna,
although they were more numerous closer to the coast and more the presence of albacore increased with the “Day of the year”
prevalent east of longitude 15◦ E (Figure 1B). Regarding larval (p = 0.01) and with “Salinity” (p < 0.001) (Figures 5C1,C2).
densities, low larval densities were found in the western part of Regarding the model used to analyze the abundance in positive
the Strait, while higher densities were found along the eastern end stations, ABT was found to be negatively related to “Day of
of the Sicilian coast and Malta (Figure 1B). the year” (p < 0.01) (Figure 6A). For the bullet model, even
Lastly, albacore, the tuna species found to have the lowest with the stepwise procedure, none of the explanatory variables
presence probabilities and abundance at positive stations, was were significant. The albacore model for abundance in the
found between 2011 and 2015 (Figure 1C) and in well-defined positive stations showed an increasing linear trend with “Depth,”
areas at the times of samplings (the shelf area between Capo a dome-shaped relation with “Salinity” with a maximum at
Passero and Malta), with rare presence between longitudes 12 and intermediate levels; and with “Zooplankton abundance,” the
14◦ E (Figure 1C). trend decreased until intermediate values remained constant at
higher zooplankton abundances (p < 0.05) (Figures 6B1–B3).
Hydrographic Conditions For this species, it should be considered that in the eastern
Temperatures were generally warmer in the eastern zone for sector where the larvae are more abundant, in the 2 years with
all the years sampled and 2010, 2013, and 2016 were the greatest zooplankton abundance (2010 and 2016), we did not find
Frontiers in Marine Science | www.frontiersin.org 5 August 2021 | Volume 8 | Article 708775Russo et al. Tuna Larval Distributions FIGURE 2 | Generalized additive model (GAM) covariates considered in the models. Temperature anomalies in the first column, salinity in the second column, and zooplankton abundance (g/m3 ) in the third column. Frontiers in Marine Science | www.frontiersin.org 6 August 2021 | Volume 8 | Article 708775
Russo et al.                                                                                                                                Tuna Larval Distributions

 FIGURE 3 | Mean larval density (larvae/m3 ) related to site depth, for the three species.

 FIGURE 4 | Density of presence-absence data for the three species related to (A–C) temperature and (D–F) salinity, where 0 is absence and 1 is presence.

albacore larvae. It is also necessary to consider that there are very                    DISCUSSION
few events of large zooplankton abundance and that from the
low to medium abundance that has been detected, the effect on                            The results indicate that the central Mediterranean Sea, in
albacore abundance decreases (Figure 6B2).                                               particular the Strait of Sicily, is a significant larval habitat for

Frontiers in Marine Science | www.frontiersin.org                                    7                                       August 2021 | Volume 8 | Article 708775
Russo et al.                                                                                                                                     Tuna Larval Distributions

TABLE 2 | GAM output analysis with significance value (0 ‘*** ’; 0.001 ‘** ’; 0.01 ‘* ’; 0.05 ‘.’; > 0.05 ‘–’).

Presence absence                   Res temp.                Sal.              Zoo.              Year              Depth      Year Day              Deviance explained

ABT                                     ***                   –                 –                 ***               –           ***                       19.3%
BULLET                                  –                     *                 –                 ***               –           ***                       15.7%
ALBACORE                                –                    ***                –                 –                 –            *                        13.9%

Larval abundance                   Res temp.                Sal.              Zoo.              Year              Depth      Year Day              Deviance explained

ABT                                     –                     –                 –                 –                 –            **                        14%
BULLET                                  –                     –                 –                 –                 –            –                           –
ALBACORE                                –                     *                 *                 –                 *            –                        59.7%

the three tuna species considered in this study. ABT and bullet                                larvae that spawned during previous spawning events. If these
were generally more abundant than albacore, the latter having                                  larger larvae have reached the piscivorous phase, they might
not been caught in two of the years during the sampling time                                   feed on their conspecifics and carry out cannibalism (Reglero
series. Therefore, there is a temporal-spatial overlap during the                              et al., 2011). As Bongo-40 nets that predominantly catch small
early life stages of these species. Temperature, salinity, and day                             larvae were used, statistical analyses on the difference in size
of the year emerged as key variables to better understand the                                  distribution across the seasons and/or stations were not possible.
spatio-temporal distribution of larval habitats of these species in                                Regarding salinity, the minimum, maximum, and mean
the area.                                                                                      values recorded in the stations are typical of the study area,
    Tuna larvae were found in the eastern side of the Strait, where                            characterized by the confluence of Atlantic waters with Eastern
surface water temperatures were found to be consistently warmer                                Mediterranean waters in the Ionian Sea. In fact, we have detected
than those of the surrounding areas. The GAM results on the                                    a strong variation in salinity values, corresponding to a key
presence-absence of ABT larvae show that the day of the year                                   oceanographic structure, the saline front in the south of Capo
is highly significant, with a dome-shaped relationship reaching                                Passero, to the east of the study area. This structure appears
a maximum at around day 200, corresponding to the beginning                                    to be stable during the summer period, confirming previous
of the second half of July. Tuna species are found in waters above                             observations (Patti et al., 2010; Bonanno et al., 2014; Cuttitta
22◦ C, and the timings are consistent with studies carried out in                              et al., 2016). Across the front the larval occurrence is higher,
the Western Mediterranean (e.g., Alemany et al., 2010; Reglero                                 and this is evident for the three species that show two presence
et al., 2012) and south of the Central Mediterranean (e.g., Koched                             peaks related to salinity. Larvae originating from the spawning
et al., 2013; Zarrad et al., 2013). The results reinforce the idea                             activity in the southeastern sector of the study area accumulate
that tuna eggs and larvae are mainly found in oceanic waters                                   with larvae advected by the Atlantic waters from the offshore
and are constrained by temperatures above 20◦ C, at which they                                 western area, causing the higher concentrations observed in the
can develop and survive (Reglero et al., 2014). In the study area,                             retention area for the three species investigated. In the same
we also found some larvae in the August period, suggesting that                                area, this advection mechanism has also been verified for other
some adults may have spawned outside the common spawning                                       species in previous studies (García Lafuente et al., 2002; Cuttitta
period, when temperatures are still suitable for egg-hatching.                                 et al., 2018; Patti et al., 2018). So, definitively the dynamics of
    There was a higher probability of finding larvae at stations                               this frontal area seems to play a key role for larval retention
where the temperature was higher than the average temperature                                  in the eastern zone. This hypothesis has been confirmed by
for that day. Adults can choose where to spawn and may                                         the GAM models, as bullet and albacore tuna showed a higher
choose to spawn when and where temperatures are favorable                                      probability of presence at higher salinity. This is not dictated
for the development of their larvae. ABT have very high                                        by physiological constraints but by a purely physical factor. The
fecundity and are multiple batch spawners (Ciannelli et al., 2015).                            different densities of the two water masses where we find higher
While they are in the spawning grounds, they have a very fast                                  larvae presence and the presence of the saline front every year
ovarian development and oocyte maturation that is propelled                                    suggest that this oceanographic structure works as a physical
by the presence of increasing warming water, which poses an                                    barrier, concentrating the tuna larvae. Geostrophy and associated
evolutionary constraint on the spawning locations (Ciannelli                                   surface currents play a key role in determining the fate of the early
et al., 2015). The results suggest that the moment in which adults                             life stage, and Capo Passero assumes an important function as
choose to spawn increases up to mid-July and then decreases.                                   a retention area for eggs and larvae, not only for tuna but also
Interestingly, in the study area, we also found some larvae during                             for other species that gather from the northwest, resulting from
August. This indicates that some adults have spawned outside the                               along-shore advection (Torri et al., 2018; Patti et al., 2020).
common peak period. The reproductive success of these events                                       Atlantic bluefin tuna (ABT) larvae were absent in the western
that occur later in the year is not known. These smaller ABT that                              sector. This area is characterized by coastal upwelling zones due
spawned later in the year might be found by larger conspecific                                 to mistral winds that induce offshore Ekman transport of surface

Frontiers in Marine Science | www.frontiersin.org                                          8                                      August 2021 | Volume 8 | Article 708775
Russo et al. Tuna Larval Distributions FIGURE 5 | Results of the generalized additive presence-absence models for (A1,A2) bluefin tuna, (B1,B2) bullet tuna, and (C1,C2) albacore tuna. waters, causing the upwelling of cold and nutrient-rich water It was not possible to depict the reproductive peak of bullet masses (Patti et al., 2010; Torri et al., 2018). In general, tuna and albacore tuna in this study, since the data suggest that larvae are found in oligotrophic areas, probably as a strategy to the spawning window of bullet is longer than the timing of encounter fewer predators (Bakun, 2013). Despite the eastern the surveys (Allaya et al., 2013). This is demonstrated by the area being less productive than the western area, local enrichment “Day of the year” results. The bullet tuna reproductive strategy processes such as cold filaments from the upwelling zone together is based on a protracted spawning behavior, compared with with the thermohaline front and eddies could concentrate prey, ABT. Concerning bullet tuna abundance, the lack of significant improving feeding opportunities (Cuttitta et al., 2016, 2018; variables in the applied model highlights how the larvae of Torri et al., 2018). These oceanographic processes could create this species are heterogeneously distributed within the study patches of higher food abundance that, together with scarcity of area (Figure 1B). We chose to implement a unified model predators, could increase the chances of larval survival. approach for the three species, both for presence-absence and Frontiers in Marine Science | www.frontiersin.org 9 August 2021 | Volume 8 | Article 708775
Russo et al.                                                                                                                           Tuna Larval Distributions

 FIGURE 6 | Results of the generalized additive abundance models for (A) bluefin tuna and (B1, B2, B3) albacore tuna.

abundance, but clearly, each species has its own peculiarities, and                  in the observed patterns difficult. As such, this study has given
the results suggest the need for further species-specific studies.                   some interesting insights and paves the way for future studies
Moreover, because of the complex nature of the ecological                            on the impact of environmental variability on the interannual
data, low values of explained deviance are common, also                              fluctuations in the abundance of these species and in their
considering that other environmental variables, not available for                    reproductive success in the Central Mediterranean Sea.
this study, could potentially be useful to improve the knowledge                        More research in the Central Mediterranean tuna spawning
of larval distribution.                                                              grounds is needed to understand its role compared with other
                                                                                     areas in the Mediterranean Sea. It is also possible that there
                                                                                     is a spatio-temporal mixing in spawning grounds between the
CONCLUSION                                                                           two ABT Mediterranean sub-populations. The crucial issue of
                                                                                     the ABT Mediterranean stock structure remains inconclusive.
The study area located in the center of the Mediterranean Sea,                       The results could indicate a reproductive event or multiple
with direct influence of Atlantic and Levantine waters, creates                      reproductive events, resulting from Atlantic or resident ABT, or
unique environmental conditions selected as optimal spawning                         both. We still need to know more about this area, as we still do not
grounds by different tuna species as has been observed for other                     know the larval origin and if the larvae come from the resident
species (Falcini et al., 2020; Mangano et al., 2020; Patti et al.,                   adult fraction or not. By studying these lesser-known spawning
2020). In this study, similarities with other well-characterized                     areas, we wanted to take the first step, laying the foundations,
spawning grounds in the Central and Western Mediterranean                            to fill critical gaps in the understanding of the unique dynamics
were highlighted, where the three selected tuna species also                         of the Mediterranean stock for these species that, to date, have
coexist (Alemany et al., 2010; Koched et al., 2013). This study                      remained unanswered.
targets the lesser-known central Mediterranean Sea spawning
area, revealing that temperature, salinity, and day of the year were
the main variables driving tuna larval geographical distribution.                    DATA AVAILABILITY STATEMENT
However, the lack of a long time series in the region and
the different sampling methods in the area compared with the                         The raw data supporting the conclusions of this article will be
other areas made the detection of significant temporal trends                        made available by the authors, without undue reservation.

Frontiers in Marine Science | www.frontiersin.org                               10                                      August 2021 | Volume 8 | Article 708775
Russo et al. Tuna Larval Distributions
AUTHOR CONTRIBUTIONS the Italian National Research Council and funded by the Italian
Ministry of Economic Development and the Italian Ministry of
SR, AC, and GS contributed to the conception and design of the Education, University and Research within the National Research
study. MT, BP, and AC carried out the sampling. SR, AC, and PR Program 2011–2013.
taxonomic identification. SR, MT, and BP organized the database.
SR, MT, DAB, and PR performed the statistical analysis. SR wrote ACKNOWLEDGMENTS
the first draft of the manuscript. GS and AC secured funding. All
authors contributed to manuscript revision, read, and approved We thank all the CNR and IEO-COB technicians for the
the submitted version. support during species identification, especially Melissa Martin
Quetglas and the PhD students (Catalina Mena Oliver and
FUNDING Daniel Ottmann Riera) for the help during preliminary data
exploration, Dr. Luigi Giaramita and Carlo Patti for their support
Fondo Sociale Europeo Sicilia 2020 supported SR’s PhD research during oceanographic surveys and sampling collection. We
presented in this study. Data collection was mainly supported thank Francisco J. Alemany, Walter Ingram, Lorenzo Ciannelli,
by the Italian National Research Council (CNR) through the and Hanane Elyaagoubi for their helpful comments on the
USPO office, and by the FAO Regional Project MedSudMed preliminary study. We thank Mr. Emanuele Gentile, master of the
Assessment and Monitoring of the Fishery Resources and R/V Urania and R/V Minerva Uno, and his crew for their work
the Ecosystems in the Straits of Sicily, funded by the Italian in support of plankton sampling during oceanographic cruises.
Ministry MIPAAF and co-funded by the Directorate-General for
Maritime Affairs and Fisheries of the European Commission SUPPLEMENTARY MATERIAL
(DG MARE). Sampling activity was also supported by other
research projects, namely, Grandi Pelagici, funded by the Sicilian The Supplementary Material for this article can be found
Regional Government, and SSD-PESCA and the Flagship Project online at: https://www.frontiersin.org/articles/10.3389/fmars.
RITMARE—The Italian Research for the Sea—coordinated by 2021.708775/full#supplementary-material
REFERENCES Ciannelli, L., Bailey, K., and Olsen, E. M. (2015). Evolutionary and ecological
constraints of fish spawning habitats. ICES J. Mar. Sci. 72, 285–296.
Abascal, F. J., Medina, A., De la Serna, J. M., Godoy, D., and Aranda, G. (2016). doi: 10.1093/icesjms/fsu145
Tracking Bluefin tuna reproductive migration into the Mediterranean Sea with Cuttitta, A., Arigo, A., Basilone, G., Bonanno, A., Buscaino, G., Rollandi, L.,
electronic pop-up satellite archival tags using two tagging procedures. Fish. et al. (2004). Mesopelagic fish larvae species in the Strait of Sicily and their
Oceanogr. 25, 54–66. doi: 10.1111/fog.12134 relationships to main oceanographic events. Hydrobiologia 527, 177–182.
Alemany, F., Quintanilla, L., Velez-Belchí, P., García, A., Cortés, D., Rodríguez, J. doi: 10.1023/B:HYDR.0000043299.65829.2f
M., et al. (2010). Characterization of the spawning habitat of Atlantic Bluefin Cuttitta, A., Quinci, E. M., Patti, B., Bonomo, S., Bonanno, A., Musco, M.,
tuna and related species in the Balearic Sea (western Mediterranean). Prog. et al. (2016). Different key roles of mesoscale oceanographic structures and
Oceanogr. 86, 21–38. doi: 10.1016/j.pocean.2010.04.014 ocean bathymetry in shaping larval fish distribution pattern: a case study in
Allaya, H., Hattour, A., Hajjej, G., and Trabelsi, M. (2013). Some biological Sicilian waters in summer 2009. J. Sea Res. 115, 6–17. doi: 10.1016/j.seares.2016.
parameters of the bullet tuna Auxis rochei (Risso, 1810) in Tunisian waters. Cah. 04.005
Biol. Mar. 54, 287–292. doi: 10.21411/CBM.A.8CBA0364 Cuttitta, A., Torri, M., Zarrad, R., Zgozi, S., Jarboui, O., Quinci, E. M., et al.
Alvarez-Berastegui, D., Ciannelli, L., Aparicio-Gonzalez, A., Reglero, P., (2018). Linking surface hydrodynamics to planktonic ecosystem: the case
Hidalgo, M., López-Jurado, J. L., et al. (2014). Spatial scale, means study of the ichthyoplanktonic assemblages in the Central Mediterranean Sea.
and gradients of hydrographic variables define pelagic seascapes of Hydrobiologia 821, 191–214. doi: 10.1007/s10750-017-3483-x
bluefin and bullet tuna spawning distribution. PLoS ONE 9:e109338. Falcini, F., Corrado, R., Torri, M., Mangano, M. C., Zarrad, R., Di Cintio,
doi: 10.1371/journal.pone.0109338 A., et al. (2020). Seascape connectivity of European anchovy in the
Alvarez-Berastegui, D., Saber, S., Ingram Jr, G. W., Díaz-Barroso, L., Central Mediterranean Sea revealed by weighted Lagrangian backtracking
Reglero, P., Macías, D., et al. (2018). Integrating reproductive ecology, and bio-energetic modelling. Sci. Rep. 10, 1–13. doi: 10.1038/s41598-020-
early life dynamics and mesoscale oceanography to improve albacore 75680-8
tuna assessment in the Western Mediterranean. Fish. Res. 208, 329–338. Fromentin, J. M. (2010). Tagging Bluefin tuna in the Mediterranean Sea: challenge
doi: 10.1016/j.fishres.2018.08.014 or mission: impossible. Collect. Vol. Sci. Pap. ICCAT 65, 812–821.
Bakun, A. (2013). Ocean eddies, predator pits and bluefin tuna: implications García Lafuente, J., García, A., Mazzola, S., Quintanilla, L., Delgado, J.,
of an inferred ‘low risk–limited payoff ’reproductive scheme of a (former) Cuttitta, A., et al. (2002). Hydrographic phenomena influencing early
archetypical top predator. Fish Fish. 14, 424–438. doi: 10.1111/faf.12002 life stages of the Sicilian Channel anchovy. Fish. Oceanogr. 11, 31–44.
Block, B. A., Teo, S. L., Walli, A., Boustany, A., Stokesbury, M. J., Farwell, C. J., doi: 10.1046/j.1365-2419.2002.00186.x
et al. (2005). Electronic tagging and population structure of Atlantic Bluefin Heinisch, G., Corriero, A., Medina, A., Abascal, F. J., De La Serna, J. M., Vassallo-
tuna. Nature 434, 1121–1127. doi: 10.1038/nature03463 Agius, R., et al. (2008). Spatial–temporal pattern of bluefin tuna (Thunnus
Bonanno, A., Placenti, F., Basilone, G., Mifsud, R., Genovese, S., Patti, B., et al. thynnus L. 1758) gonad maturation across the Mediterranean Sea. Mar. Biol.
(2014). Variability of water mass properties in the Strait of Sicily in summer 154(4), 623-630. doi: 10.1007/s00227-008-0955-6
period of 1998–2013. Ocean Sci. 10, 759–770. doi: 10.5194/os-10-759-2014 Karakulak, F. S., and Yıldız, T. (2016). “Atlantic Bluefin Tuna in the Mediterranean
Cermeno, P., Quilez-Badia, G., Ospina-Alvarez, A., Sainz-Trápaga, S., Boustany, Sea: Fisheries, Farming, Management and Conservation,” in The Turkish Part
A. M., Seitz, A. C., et al. (2015). Electronic tagging of Atlantic Bluefin tuna of The Mediterranean Sea Marine Biodiversity Fisheries Conservation and
(Thunnus thynnus L.) reveals habitat use and behaviors in the Mediterranean Governance, eds C. Turan, B. Salihoğlu, E. O. Özbek, and B. Öztürk (Istanbul:
Sea. PLoS ONE 10:e0116638. doi: 10.1371/journal.pone.0116638 The Turkish Marine Research Foundation (TUDAV) Press), 595, 320–332.
Frontiers in Marine Science | www.frontiersin.org 11 August 2021 | Volume 8 | Article 708775Russo et al. Tuna Larval Distributions
Koched, W., Alemany, F., Rimel, B., and Hattour, A. (2016). Characterization of component in tuna. Mar. Ecol. Prog. Ser. 433, 205–219. doi: 10.3354/meps
the spawning area of tuna species on the northern Tunisian coasts. Sci. Mar. 80, 09187
187–198. doi: 10.3989/scimar.04332.27A Robinson, A. R., Leslie, W. G., Theocharis, A., and Lascaratos,
Koched, W., Hattour, A., Alemany, F., Garcia, A., and Said, K. (2013). Spatial A. (2001). Mediterranean Sea circulation. Ocean Curr. 1:19.
distribution of tuna larvae in the Gulf of Gabes (Eastern Mediterranean) doi: 10.1016/B978-012374473-9.00376-3
in relation with environmental parameters. Mediterr. Mar. Sci. 14, 5–14. Rodríguez, J. M., Alemany, F., and Garcia, A. (2017). A Guide to the Eggs
doi: 10.12681/mms.314 and Larvae of 100 Common Western Mediterranean Sea Bony Fish Species.
Koched, W., Hattour, A., Alemany, F., Zarrad, R., and García-García, A. (2012). Rome: FAO.
Distribution of tuna larvae in Tunisian east coasts and its environmental RStudio Inc (2016). RStudio: Integrated Development for R. Boston, MA. Available
scenario. Cah. Biol. Mar. 53, 505–515. doi: 10.21411/CBM.A.763B5CD1 online at: http://www.rstudio.com/ (accessed November 12, 2018).
Livi, S., Romeo, T., De Innocentiis, S., Greco, C., Battaglia, P., Marino, G., et al. Sarà, G., and Sarà, R. (2007). Feeding habits and trophic levels of bluefin tuna
(2019). The genetic population structure of Thunnus thynnus (Linnaeus, 1758) Thunnus thynnus of different size classes in the Mediterranean Sea. J. Appl.
in the Mediterranean Sea, a controversial issue. J. Appl. Ichthyol. 35, 436–443. Ichthyol. 23, 122–127. doi: 10.1111/j.1439-0426.2006.00829.x
doi: 10.1111/jai.13867 Sun, C. H., Chiang, F. S., Squires, D., Rogers, A., and Jan, M. S. (2019). More
Mangano, M. C., Mieszkowska, N., Helmuth, B., Domingos, T., Sousa, T., landings for higher profit? Inverse demand analysis of the Bluefin tuna
Baiamonte, G., et al. (2020). Moving toward a strategy for addressing climate auction price in Japan and economic incentives in global Bluefin tuna fisheries
displacement of marine resources: a proof-of-concept. Front. Mar. Sci. 7: 408. management. PLoS ONE 14:e0221147. doi: 10.1371/journal.pone.0221147
doi: 10.3389/fmars.2020.00408 Torri, M., Corrado, R., Falcini, F., Cuttitta, A., Palatella, L., Lacorata, G., et al.
Muhling, B. A., Lamkin, J. T., Alemany, F., García, A., Farley, J., Ingram, (2018). Planktonic stages of small pelagic fishes (Sardinella aurita and Engraulis
G. W., et al. (2017). Reproduction and larval biology in tunas, and the encrasicolus) in the central Mediterranean Sea: the key role of physical forcings
importance of restricted area spawning grounds. Rev. Fish Biol. Fish. 27, and implications for fisheries management. Prog. Oceanogr. 162, 25–39.
697–732. doi: 10.1007/s11160-017-9471-4 doi: 10.1016/j.pocean.2018.02.009
Mylonas, C. C., De La Gándara, F., Corriero, A., and Ríos, A. B. (2010). Wood, S. N. (2011). Fast stable restricted maximum likelihood and marginal
Atlantic Bluefin tuna (Thunnus thynnus) farming and fattening in likelihood estimation of semiparametric generalized linear models. J. R. Stat.
the Mediterranean Sea. Reviews in Fisheries Science 18, 266–280. Soc. Ser. B Stat. Methodol. 73, 3–36. doi: 10.1111/j.1467-9868.2010.00749.x
doi: 10.1080/10641262.2010.509520 Zarrad, R., Alemany, F., Rodriguez, J. M., Jarboui, O., Lopez-Jurado, J. L.,
Patti, B., Guisande, C., Bonanno, A., Basilone, G., Cuttitta, A., and Mazzola, and andBalbin, R. (2013). Influence of summer conditions on the larval
S. (2010). Role of physical forcings and nutrient availability on the control fish assemblage in the eastern coast of Tunisia (Ionian Sea, Southern
of satellite-based chlorophyll a concentration in the coastal upwelling area Mediterranean). J. Sea Res. 76, 114–125. doi: 10.1016/j.seares.2012.08.001
of the Sicilian Channel. Sci. Mar. 74, 577–588. doi: 10.3989/scimar.2010.74
n3577 Conflict of Interest: The authors declare that the research was conducted in the
Patti, B., Torri, M., and Cuttitta, A. (2020). General surface circulation controls absence of any commercial or financial relationships that could be construed as a
the interannual fluctuations of anchovy stock biomass in the Central potential conflict of interest.
Mediterranean Sea. Sci. Rep. 10:1554. doi: 10.1038/s41598-020-58028-0
Patti, B., Zarrad, R., Jarboui, O., Cuttitta, A., Basilone, G., Aronica, S., et al. (2018). Publisher’s Note: All claims expressed in this article are solely those of the authors
Anchovy (Engraulis encrasicolus) early life stages in the Central Mediterranean and do not necessarily represent those of their affiliated organizations, or those of
Sea: connectivity issues emerging among adjacent sub-areas across the Strait of
the publisher, the editors and the reviewers. Any product that may be evaluated in
Sicily. Hydrobiologia 821, 25–40. doi: 10.1007/s10750-017-3253-9
this article, or claim that may be made by its manufacturer, is not guaranteed or
Reglero, P., Ciannelli, L., Alvarez-Berastegui, D., Balbín, R., López-Jurado, J. L.,
and Alemany, F. (2012). Geographically and environmentally driven spawning endorsed by the publisher.
distributions of tuna species in the western Mediterranean Sea. Mar. Ecol. Prog.
Ser. 463, 273–284. doi: 10.3354/meps09800 Copyright © 2021 Russo, Torri, Patti, Reglero, Álvarez-Berastegui, Cuttitta and Sarà.
Reglero, P., Tittensor, D. P., Álvarez-Berastegui, D., Aparicio-González, A., and This is an open-access article distributed under the terms of the Creative Commons
Worm, B. (2014). Worldwide distributions of tuna larvae: revisiting hypotheses Attribution License (CC BY). The use, distribution or reproduction in other forums
on environmental requirements for spawning habitats. Mar. Ecol. Prog. Ser. is permitted, provided the original author(s) and the copyright owner(s) are credited
501, 207–224. and that the original publication in this journal is cited, in accordance with accepted
Reglero, P., Urtizberea, A., Torres, A. P., Alemany, F., and Fiksen, Ø. (2011). academic practice. No use, distribution or reproduction is permitted which does not
Cannibalism among size classes of larvae may be a substantial mortality comply with these terms.
Frontiers in Marine Science | www.frontiersin.org 12 August 2021 | Volume 8 | Article 708775You can also read