From Cedar Cemeteries to Marsh Lakes: a Case Study of Sea-Level Rise and Habitat Change in a Northeastern US Salt Marsh
←
→
Page content transcription
If your browser does not render page correctly, please read the page content below
Estuaries and Coasts (2021) 44:1649–1657
https://doi.org/10.1007/s12237-021-00946-x

    SPECIAL ISSUE: CONCEPTS AND CONTROVERSIES IN TIDAL MARSH ECOLOGY REVISITED

From Cedar Cemeteries to Marsh Lakes: a Case Study of Sea-Level
Rise and Habitat Change in a Northeastern US Salt Marsh
Kenneth W. Able 1

Received: 2 October 2020 / Revised: 26 April 2021 / Accepted: 3 May 2021 / Published online: 5 June 2021
# Coastal and Estuarine Research Federation 2021

Abstract
Evidence for relative sea-level rise in the Mullica River-Great Bay, a relatively undisturbed watershed in southern New Jersey,
stretches over hundreds of years. The increase in global sea-level rise in the region is enhanced by subsidence and results in rates
that are approximately double the global average. In recent decades, the occurrence of “ghost forests,” standing dead forests,
especially of the salt-intolerant Atlantic White Cedar, is becoming increasingly obvious as tidal inundation of salty waters
increases further inland, especially in the upper portions of the Mullica River and its tributaries. Even older evidence of sea-
level rise in the watershed is the subtidal and intertidal occurrence of “cedar cemeteries,” i.e., buried accumulations of Atlantic
white cedar stumps and timbers that have been radiocarbon-dated from the fifteenth to the sixteenth centuries to as old as the fifth
century. Some of these are being exposed as rising water extends intertidal creeks into adjacent wetlands and uncovers this rot-
resistant wood. Sea-level rise is perhaps the most significant threat to the persistence of salt marshes over the coming century.
Sea-level rise decreases salt marsh area by erosion at the marsh edge, drowning of the marsh surface, and the expansion of marsh
pools into larger marsh “lakes.” In some instances, this loss of salt marshes is compensated for by expansion landward into ghost
forests, but in this watershed and others, the expansion is by invasive plant species such as Phragmites australis, which is
suboptimal habitat for fishes, crabs, and other invertebrates. The combination of a fast rate of sea-level rise in an area relatively
free from recent human intervention makes the Mullica Valley watershed an ideal location to continue to evaluate the effects of
sea-level rise on salt marsh ecosystems.

Keywords Sea-level rise . Marshes . Ghost forests . Cedar cemeteries . Habitat

Introduction                                                                  impacted estuarine habitats is salt marshes both generally
                                                                              (Crosby et al. 2016; Roman 2017; Schuerch et al. 2018;
Sea-level rise is increasingly recognized as a profound influ-                Stevenson and Kearny 2009), and including in specific areas
ence on estuarine habitats ranging from maritime forests to                   such as Chesapeake Bay (Beckett et al. 2016), southern New
marshes (Cahoon et al. 2006; Colombano et al. 2021; Gedan                     England (Cahoon et al. 2019; Watson et al. 2017a, b), and
et al. 2009; Mariotti 2020). This is especially evident in the                especially those that are microtidal (< 2 m) (Kearney and
Mid-Atlantic Bight region of the USA because the rates of                     Turner 2016). This is evident in several metrics, most often
sea-level rise are among the highest in the world, approxi-                   as changes in vegetation type, loss at the marsh edge, or loss in
mately double the global average (Ezer and Atkinson 2014;                     the marsh interior.
Horton et al. 2013; Kemp et al. 2013; Miller et al. 2013;                        The changes in the vegetation are evident as alteration from
Sallenger Jr. et al. 2012; Walker et al. 2021). One of the most               high marsh (e.g., Spartina patens, Distichlis spicata) to low
                                                                              marsh (Spartina alterniflora) species (Carey et al. 2017;
                                                                              Donnelly and Bertness 2001; Morris et al. 2002; Raposa
Communicated by John C. Callaway
                                                                              et al. 2017; Smith and Pellew 2021). Marsh loss is most fre-
                                                                              quently recognized at the marsh edge even though the eroded
* Kenneth W. Able
  able@marine.rutgers.edu
                                                                              edge sediments may add vertical accretion of the remaining
                                                                              marsh (Hopkinson et al. 2018). Marsh accretion can occur
1
     Rutgers University Marine Field Station, 800 Great Bay Boulevard,        through such processes as ice rafting, where ice and associated
     Tuckerton, NJ 08087, USA                                                 sediments are carried on to the marsh surface and encourage
1650 Estuaries and Coasts (2021) 44:1649–1657
growth of vegetation (Hardwick-Whitman 1985, 1986). In vegetation, marsh accretion rates and surface elevation, and
some systems there is dramatic loss of vegetated marsh in conversion of marsh to intertidal/subtidal habitat (Kennish
the interior as it is converted to new and/or larger ponds or et al. 2016; Meixler et al. 2017).
“lakes” on the marsh platform (Delaune et al. 1994; Mariotti The purpose of this case study is to improve our under-
2016). This is a very dynamic process that varies between standing of sea-level rise effects on the marshes and maritime
ditched and unditched marshes (Smith and Pellew 2021). forests and evaluate the responses of these habitats over a time
However, the loss in interior vegetation is consistently report- span from years to centuries in this relatively unaltered water-
ed from Maine (Wilson et al. 2009, 2010), southern New shed. The study combines a review of the prior studies on sea-
England (Hartig et al. 2002; Van Huissteden and Van De level rise in this system and original data on these topics in
Plassche 1998; Watson et al. 2017b), and Maryland order to provide much-needed perspective from the past and
(Schepers et al. 2016). In other instances, coastal marshes for the future.
are expanding and/or migrating in response to sea-level rise
(Raabe and Stumpf 2015; Scheider et al. 2018) if there are no
upland barriers or human influences which deter the marsh Perspectives
migration (Kirwan and Megonigal 2013).
Another habitat influenced by sea-level rise is maritime Sea-Level Rise
forests that are dying due to increasing exposure to salt water,
i.e., “ghost forests” that are composed of standing dead trees Evidence for sea-level rise in the Mullica River-Great Bay
that have been recently killed due to sea-level rise (Kirwan watershed is rapidly accumulating. In order to examine for
et al. 2007; Kirwan and Gedan 2019). Prior preliminary sur- change in the annual flooding regime on Great Bay
veys in the Mullica River-Great Bay watershed have deter- Boulevard, and thus the surrounding marshes of the
mined that the death of maritime forests is common based Sheepshead Meadows (Fig. 1), we evaluated US Geological
on the standing remains of many species of trees, including Survey (USGS) tide gauge observations between 2001 and
the salt-intolerant Atlantic white cedar bordering the estuary 2019 taken in the RUMFS boat basin and calibrated these
(Able et al. 2018a, b). Evidence of earlier sea-level rise effects against direct observations of flooding in the marshes along
are based on the occurrence of former ghost forests, now in- Great Bay Boulevard. Based on prior calculations, and numer-
tertidal and subtidal Atlantic white cedar stumps and timbers, ous direct visual observations along the road, readings of 0.8
which are referred to as “cedar cemeteries,” in now saline m and above were assigned marsh flooded status. An index to
portions of the estuary (Able et al. 2018a, b; Able 2020). the total hours the road was flooded in each year was estimat-
Our ability to interpret the effects of sea-level rise on estu- ed using readings every 6 min from the USGS tide gauge. The
aries is often confounded by human impacts on these shore- total hours the road was flooded was estimated for each year
lines (Crotty et al. 2017; Gedan et al. 2009; Gilby et al. 2020). by multiplying the total number of observations where the
Sea-level rise is clearly occurring in the Mullica River-Great gauge reading was over 0.8 m by 6 (for 6-min intervals) and
Bay watershed in southern New Jersey (Fig. 1) based on tide dividing that number by 60 (60 min in an hour). We then used
gauge data from the early 1900s at nearby Atlantic City linear regression to evaluate whether there was a trend in total
(Miller et al. 2013). Fortunately, this watershed provides an hours flooded over time (Fig. 2). The trend observed was
exceptional baseline to evaluate these changes because the constant and increasing as was the tide gauge from nearby
system is relatively unaltered (Good and Good 1984; Atlantic City (Fig. 1), for the period 1912 to the turn of the
Kennish 2004) and the shorelines of the estuary are century (Miller et al. 2013). The relationship between these
surrounded by extensive Spartina marshes (Lathrop et al. tide gauges was closely correlated (p < 0.0001). At that site,
2000). The estuary has broad seasonal temperature range there has been a consistent increase over time, with a rise in
(− 2 to 28 °C) and a microtidal tidal range (1.1 m) (Kennish relative sea level of approximately 40 cm since 1912. This
2004). The Great Bay portion of the estuary is polyhaline, increase, coupled with subsidence, makes sea-level rise in
while salinity is somewhat reduced in the lower Mullica Atlantic City about two times the global average (Miller
River. The freshwater-saltwater interface typically occurs fur- et al. 2013). Thus, over the time period from 1912 to the
ther up the Mullica River near Lower Bank (Fig. 1). This present, these combined data show that relative sea-level rise
watershed has low human population density, large areas in the region is occurring, in part because it is compounded by
protected by federal and state holdings, few dams to interfere local (Miller et al. 2013) and regional (Crosby et al. 2016; Ezer
with the hydrology, and a natural inlet to the ocean. As a and Atkinson 2014; Sallenger Jr. et al. 2012) subsidence. Thus,
result, there are several efforts to use a portion of this estuary these observations in the study area account for some of the
(Sheepshead Meadows, Fig. 1, bottom) as a sentinel site for highest rates of sea-level rise in the world (Walker et al. 2021).
assessing climate change effects (Kennish et al. 2014a, b) Observations of the maritime forests in the watershed were
including specific projects to determine changes in marsh made at large spatial scales with historic aerial imagery and,Estuaries and Coasts (2021) 44:1649–1657 1651 more recently, from helicopters and drones, to provide another away based on comparisons of aerial photos from the 1930s metric of sea-level rise. Environmental Systems Research and the present, there are large numbers of exposed Atlantic Institute (ESRI) aerial imagery was used to perform spatio- white cedar stumps and timbers (see Fig. 13.13 in Able 2020). temporal analysis of marsh pools from 1930 to 2015 while Radiocarbon dating of this wood indicates it originated from HistoricAerials.com was used to observe change during the fourteenth to the fifteenth centuries (Able et al. 2018a, b). intermediate years. Pools selected for comparison were on These types of features have been detected in the same general the relatively unaltered (not altered by any nearby Open area as the ghost forests (Fig. 3) as observed abundantly in the Marsh Water Management [OMWM] or mosquito-ditched upper intertidal edges of the Bass River (Fig. S2 and Fig. 13.9 areas) southern portion of Sheepshead Meadows (Fig. 1, in Able 2020). These cedar cemeteries also occur in deeper bottom). Photographs of individual pools were selected based waters of the study area as detected with sidescan sonar in the on their occurrence, or their remnants, in aerial images from subtidal waters of the Bass, Wading, and Mullica rivers (Fig. 1930 to 2015 based on a 1:1000 scale in the most recent 13.14, 13.15 in Able 2020). In the Mullica River near Lower images. Observations of marsh pools over time were based Bank (Fig. 1), radiocarbon dates from submerged Atlantic on the change in extent over time. Pool location and size were white cedar date to the fifteenth century (Able et al. 2018a, b). screen-digitized in ArcMap. We visited almost all pools that were identified from the 1930s and 2015 images by walking Response of Marshes the marsh surface to verify their current status during fall 2017 and winter 2018. The marsh edge in the Sheepshead Meadow is dynamic with Aerial images from a helicopter were collected by two ob- regard to direction and rate of sedimentation. Sediments can servers with cameras and GPS locaters on four dates between be deposited, as overwash, on the marsh surface during 2015 and 2018 and filmed with a Go-Pro camera over the storms. These typically sandy sediments, presumably of ma- Mullica River Valley to identify the occurrence and location rine origin, are obvious from aerial photographs over the last (Fig. 3) of “ghost forests” (Fig. S1). In addition, we used small 20 years (see Fig. S3). At the same time, significant erosion at drones to confirm the identity of individual ghost forests. In the southern end of the Sheepshead Meadows peninsula is the fall of 2017, a DJI Phantom 3 Professional drone was evident through the same imagery. As a result, the marsh edge flown at standardized elevations for most flights at 15 and 4 at this location has retreated up to 57 m since 1995 (Fig. S3). m. Other groundtruthing of marshes, ghost forests, and cedar At the same time, channel widening within the peninsula is cemetery occurrence and distribution was made during 2015– frequently occurring as indicated by sloughing off of the chan- 2019 from kayak (217 km) and motorboat (322 km) through- nel edge (Able et al. 2018a, b). out the watershed (Fig. 3). Marshes in the Mullica Valley have been able to keep pace The record of the occurrence of modern “ghost forests” with sea-level rise in previous centuries by trapping and (Fig. S1) and ancient “cedar cemeteries” (Fig. S2) in the retaining sediments (Suk et al. 1999) as occurs elsewhere Mullica River-Great Bay watershed due to sea-level rise and (Hopkinson et al. 2018; Pennings and Bertness 2001). As an subsidence over decades and centuries is evident from several example in the study area, during winter 2017 through sum- sources. The distribution of ghost forests is centered in the mer 2018, drone flights focused on the distribution and chang- upper portion of the watershed including the Mullica River es in ice-rafted sediments in the Sheepshead Meadows. A and its tributaries including the Bass and Wading rivers and recent (January 2018) event, Winterstorm Grayson, contribut- Nacote Creek. They are not present in the consistently fresh- ed to marsh surface sedimentation in the study area. The event water portions of the upstream Mullica and Wading rivers. was prompted by near record cold temperatures which Ghost forests are absent from the lower, higher salinity por- allowed the salt water to freeze to the bottom of creeks and tions of the Mullica, Wading, and Bass rivers as well as the in the process the muddy bottom sediments were incorporated entire perimeter of Great Bay (Fig. 3). This is particularly into the ice in an area near RUMFS (Fig. 1, bottom). On noteworthy because much of the mortality in these ghost for- January 4, 2018, the tides carried the ice, along with the bot- ests is to Atlantic white cedar, which typically occurs in fresh- tom sediments, on to the marsh surface. Subsequently, we waters of bogs and along streams (Able et al. 2018a, b; Able sampled the sediments at a number of locations and found 2020; Sedia 2008). Another indication of sea-level rise is the 2.5–5.1 cm of sediment in a well-defined pattern on top of frequent occurrence of ghost forests elsewhere along the east the previous year’s dead vegetation (Fig. 5.8 & 5.9 in Able coast of the USA (Kirwan et al. 2007; Kirwan and Gedan 2020). These sediments were visible until early May 2018 2019). when the marsh vegetation began growing through the sedi- Former ghost forests, now cedar cemeteries, were also ev- ments. We verified that this ice-rafted sediment was a broader ident in intertidal creeks and just under the surface of the phenomenon when we identified the presence of similar mud- marshes (Fig. 3). As an example, an area in the upper, salty dy ice-rafted sediments at three other locations elsewhere in waters of Nacote Creek, where the marsh has been washed the Sheepshead Meadows during the same period. The
1652 Estuaries and Coasts (2021) 44:1649–1657
Estuaries and Coasts (2021) 44:1649–1657 1653
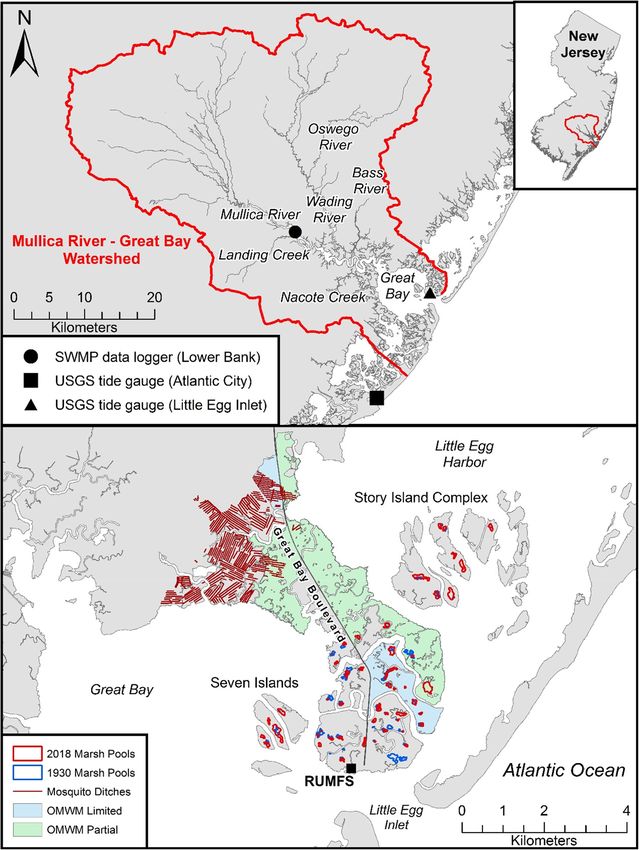
Fig. 1 Location of Mullica Valley study area in southern New Jersey (top the combination of sea-level rise and subsidence, individual
right inset) with identification of major tributaries and variety of data marsh pools expand as the vegetation around the perimeter
loggers (top). The USGS tide gauge labeled Little Egg Inlet is located
in the Rutgers University Marine Field Station boat basin. The location of
and in adjacent areas dies. These continue to grow in areal
natural marsh pools (n = 50) is indicated as closed circles in the extent over time as pools enlarge and coalesce (Fig. S4).
Sheepshead Meadows and adjacent islands (Seven Island, Story Island This results in individual pools that contain both shallow por-
Complex) largely outside the area of modifications (mosquito ditches, tions with stiff bottom peat substrates (Fig. 13.24 from Able
partial and limited Open Marsh Water Management [OMWM]) to these
marshes (bottom)
2020) and deeper portions with a soft substrate of digested
peat and soft sediments (Fig. 13.26 from Able 2020).
The occurrence and size of marsh pools in the Mullica
occurrence of ice-rafted sediments occurs elsewhere Valley has varied over the period from 1930 to 2018 based
(Hardwick-Whitman 1985, 1986), but might be becoming less on aerial photographs. Multiple surveys of the marsh pools on
frequent as the study watershed continues on a trend of warm- the undisturbed portion of the southeastern Sheepshead
er, ice-free winters (Able 2020; Able and Fahay 2010). Meadows (Fig. 1, bottom) found one of the dominant types
Another indication of marsh response to rising sea-levels is of change in these surveys is the birth and expansion of marsh
that the marsh platform vegetation in the Sheepshead pools and the resulting decrease in amount of vegetation
Meadows was considered moderately stressed (McKenna (Table 1). These marsh pool processes are consistent between
et al. 2018). This was based on their findings that only 60% the peninsula and adjacent islands (Fig. 1, Table 1). Based on
of Spartina alterniflora plants were situated in their optimal our analysis of marsh pools (n = 50), there was a net increase
growth range. Furthermore, this finding was qualified by stat- in pool area of 206,199 m2, or 72% between 1930 and 2018
ing these plants “may not be unhealthy, potentially just in (Table 1). In some instances, pools had originated from pre-
transition to a new community type such as upland or open viously completely vegetated marsh surfaces since the 1930
water.” Reference to the latter is relevant to our finding that images. But during this time period, some pools became
extensive areas of the Sheepshead Meadow are transitioning smaller and disappeared (76,817 m2) because they become
to open water. This lower plant growth observed by McKenna vegetated as they transitioned from isolated marsh pools to
et al. (2018) may be because Spartina alterniflora cannot those connected to adjacent creeks, filled with sediment, and
tolerate continuous flooding or standing water (Adam 1990). were colonized by Spartina alterniflora. This marsh pool
The death of these plants eventually results in shallow pools or “death” and revegetation is evident in Maine salt marshes
depressions with no vegetation (Fig. 13.23 in Able 2020). (Wilson et al. 2009), southern New England (Watson et al.
These new and expanded pools are typically located the fur- 2017a, b) as “paleopools” (Fig. 13.27 in Able 2020), and in
thest from the sources of sediment (Temmerman et al. 2005), southern New Jersey outside of this study area (Smith and
i.e., the marsh creeks that flood the marsh surface. Pellew 2021). In other marshes, these pools do not recover
Changes in marsh pool size and distribution are common in after connection to tidal creeks (Mariotti 2016). These chang-
the high-salinity marshes of the Mullica River-Great Bay es- es, both increase and decrease in pool size, were most evident
tuary based on the same aerial surveys for ghost forests. With on the undisturbed portion of the Sheepshead Meadows
(Table 1, Fig. 1, bottom). On the marsh islands, there were
only positive increases of 165,730 m2 in marsh pool area with
no loss of them between 1930 and 2018 (Table 1). In addition
to these changes, some pools were in transition, i.e., they were
originally identified as marsh pools but in the most recent
images were connected to an adjacent creek. As such, these
were not isolated pools but neither were they vegetated. These
pools were neither classified as marsh pool losses or gains
because they were in a transitional state (Table 1).
As a result of this study, it is clear that the number
of the pools and areal extent of the pools has become
much larger, thus these are referred to as “lakes.” As a
result of these changes, the amount of vegetation on the
marsh surface has become less. Based on closer inspec-
Fig. 2 Annual variation in flooding frequency in the marshes along Great tion with drone imagery and groundtruthing individual
Bay Boulevard in the Sheepshead Meadows study area from 2000 to pools, the number of pools was much greater than can
2019 based on comparison with a US Geological Survey tide gauge in
the nearby Rutgers University Marine Field Station (RUMFS) boat basin
be identified with aerial images. Thus, the transition to
as an indication of marsh flooding and local sea-level rise. See Fig. 1 for a wetter marsh surface occurred as more standing water
location accumulated on the lower elevations of the marsh1654 Estuaries and Coasts (2021) 44:1649–1657
Fig. 3 Spatial distribution of recent standing ghost forests (open circles or kayak and sidescan sonar of cedar cemeteries (filled circles). “X”
ovals) in the Mullica Valley from aerial imagery (area enclosed within indicates no ghost forests or stumps observed. Square indicates location
dashed line) from helicopter and drone flights and groundtruthing from of cedar cemetery in deep marsh sediments
surface and reduced plant density and growth or elimi- These patterns of marsh pool gain, because of increase in
nated them entirely. number and size, are often referred to as “ponding” and have
Table 1 Summary of marsh pool
loss (vegetation gain) and gain Location Sample size Area (m2) Percent vegetation loss
(vegetation loss) in the
Sheepshead Meadows peninsula Peninsula
and adjacent islands (Seven Pool loss (in area) 13 76,817
Islands, Story Island Complex) Pool gain 24 117,286
study area from 1930 to 2018.
Transitional pools include those Net pool change 37 + 40,469 65.4%
that were previously marsh pools Islands
but are now connected to an Pool loss (in area) 0 0
adjacent creek. The majority of
Pool gain 13 165,730
study marsh pools were located
outside the major modifications to Net pool change 13 + 165,730 100%
the marsh surface (mosquito Peninsula/islands
ditches, Open Marsh Water Pool loss (in area) 76,817
Management [see Fig. 1, bottom])
Pool gain 283,016
Net pool change 20 + 206,199 72.8%
Transitional pools 6 41,527 -Estuaries and Coasts (2021) 44:1649–1657 1655
been reported in Maine (Wilson et al. 2009, 2010), southern occur as the result of increases in the invasive Phragmites
New England (Hartig et al. 2002), and elsewhere in New australis because of its reduced ecological contributions rela-
Jersey (Mariotti 2016) and the USA (Andres et al. 2019; tive to Spartina alterniflora.
Kearney et al. 1988; Mariotti 2016; Schepers et al. 2016).
This is an area of particular concern since tidal range in the
Mullica River-Great Bay watershed is microtidal, and thus, Supplementary Information The online version contains supplementary
material available at https://doi.org/10.1007/s12237-021-00946-x.
the volume of flood events, with associated sediments, is re-
duced. These general patterns of marsh loss due to marsh Acknowledgements Numerous individuals helped to bring this review to
pools expanding and turning into marsh “lakes” are also ob- fruition. Ron Baker and Matt Taylor organized and invited me to present
served in other Mid-Atlantic marshes including elsewhere in the keynote address at the November 2019 CERF workshop on Concepts
and Controversies in Tidal Marsh Ecology Revisited. Numerous RUMFS
New Jersey (Mariotti 2016), Maryland (Kearney et al. 1988;
technicians and students assisted in bringing together the various parts of
Schepers et al. 2016), Virginia (Kirwan and Megonigal 2013; this study. Jason Morson developed the relationship between tide gauges
Kirwan et al. 2016), New York (Hartig et al. 2002), Maine and road/marsh flooding. Ryan Larum helped with interpreting changes
(Wilson et al. 2009, 2010), and elsewhere in New England in marsh pools over time. Other technicians assisted in various parts of
data and image collection, especially Ryan Larum, Maggie Shaw, Roland
(Adamowicz and Roman 2005; Watson et al. 2017a, b;
Hagan, and T.J. Johnson. Pat Filardi lent his expertise with on-the-water
Wilson et al. 2010). observations from kayaks. Judy Redlawsk provided her skills and heli-
Together, the above responses to sea-level rise are resulting copter to observations from the air. This manuscript benefitted from sev-
in overall marsh loss. This loss may be mitigated by marsh eral external reviews. The drone for aerial imagery was donated to
RUMFS from the late Diane Adams of the Rutgers University
migration where human alterations do not occur (Crosby et al.
Department of Marine and Coastal Sciences.
2016; Kirwan and Gedan 2019; Kirwan and Megonigal 2013;
Scheider et al. 2018). As frequently happens, the migration of Funding Financial support for this project was provided from current
marsh grasses into upland forests, usually in ghost forests studies by RUMFS.
(Able et al. 2018a, b; Kirwan et al. 2007; Kirwan et al.
2016) is led by the invasive form of Phragmites australis in
the study area (Fig. 13.7 in Able 2020; Windham 1999;
References
Windham and Lathrop Jr. 1999), elsewhere in New Jersey
(Smith 2013) and in North America (Chambers et al. 1999; Able, K.W. 2020. Beneath the surface: understanding nature in the
Meyerson et al. 2000). Although Phragmites australis may Mullica Valley Estuary. Rutgers University Press.
provide some food web services (Weinstein et al. 2000) and Able, K. W. and M. P. Fahay. 2010. Ecology of estuarine fishes: temper-
an elevational buffer against sea-level rise (Weis and Weis ate waters of the Western North Atlantic. Johns Hopkins University
Press, Baltimore, MD. 566.
2003), the ecological services provided by it is limited relative
Able, K.W., and S.M. Hagan. 2003. Impact of common reed, Phragmites
to Spartina alterniflora. Our prior studies have shown that australis, on essential fish habitat: influence on reproduction, em-
when Phragmites becomes established, i.e., the “late inva- bryological development, and larval abundance of mummichog
sion” stage, its value as fish and invertebrate habitat declines (Fundulus heteroclitus). Estuaries 26 (1): 40–50.
(Able and Hagan 2003; Able et al. 2003, 2006; Angradi et al. Able, K.W., S.M. Hagan, and S.A. Brown. 2003. Mechanisms of marsh
habitat alteration due to Phragmites: response in young-of-the-year
2001; Weinstein and Balletto 1999). This pattern is also evi- mummichog (Fundulus heteroclitus) to treatment for Phragmites
dent in nearby southern (Able et al. 2003; Hagan et al. 2007) removal. Estuaries 26 (2): 484–494.
and northern (Raichel et al. 2003) New Jersey marshes and Able, K.W., S.M. Hagan, and S.A. Brown. 2006. Habitat use, movement
elsewhere along the east coast of the USA (Hunter et al. 2006). and growth of young-of-the-year Fundulus spp. in southern New
Jersey salt marshes: comparisons based on tag/recapture. Journal
In summary, the response to relative sea-level rise and sub- of Experimental Marine Biology and Ecology. 335 (2): 177–187.
sidence in the Mullica River-Great Bay watershed is especial- Able, K.W., J. Walker, and B.P. Horton. 2018a. Ghost forests in the
ly relevant to the understanding of the persistence of salt Mullica Valley: indicators of sea-level rise. SoJourn 2: 87–96.
marshes in the future. This is because the study area is in a Able, K. W., C. J. Welsh, and R. Larum. 2018b. Salt marsh peat dispersal:
relatively undisturbed estuary where the effects of sea-level habitat for fishes, decapod crustaceans, and bivalves. Chapter 2 9-28
In: Peat, Intech Ltd., Rijeka, Croatia. https://doi.org/10.5772/
rise are less confounded by human alterations compared to intechopen.74087
many other estuaries and marshes elsewhere along the east Adam, P. 1990. Saltmarsh ecology: Cambridge studies in ecology.
coast of the USA. These observations, from multiple sources, Cambridge University Press.
indicate how change has occurred over centuries based on the Adamowicz, S.C., and C.T. Roman. 2005. New England salt marsh
distribution and abundance of cedar cemeteries. More recent- pools: a quantitative analysis of geomorphic and geographic fea-
tures. Wetlands 25 (2): 279–288.
ly, ghost forests and marsh loss, on the edge and interior, are
Andres, K., M. Savarese, B. Bovard, and M. Parsons. 2019. Coastal
further indications of the occurrence and rate of sea-level rise. wetland geomorphic and vegetative change: effects of sea-level rise
The ability of marshes to migrate inland may compensate, to and water management on brackish marshes. Estuaries and Coasts
some degree, for these losses but these will be limited if they 42 (5): 1308–1327.1656 Estuaries and Coasts (2021) 44:1649–1657
Angradi, T.R., S.M. Hagan, and K.W. Able. 2001. Vegetation type and Hardwick-Whitman, M.N. 1985. Biological consequences of ice rafting
the intertidal macroinvertebrate fauna of a brackish marsh. in a New England salt marsh community. Journal of Experimental
Phragmites vs Spartina. Wetlands 21 (1): 75–92. Marine Biology and Ecology 87 (3): 283–298.
Beckett, L.H., A.H. Baldwin, and M.S. Kearney. 2016. Tidal marshes Hardwick-Whitman, M.N. 1986. Aerial survey of a salt marsh: ice rafting
across a Chesapeake Bay subestuary are not keeping up with sea- to the lower intertidal zone. Estuarine Coastal and Shelf Science 22
level rise. PLoS One 11 (7): e0159753. (3): 379–383.
Cahoon, D.R., P.F. Hensel, T. Spencer, D.J. Reed, K.L. McKee, and N. Hartig, E.K., V. Gornitz, A. Kolker, F. Mushacke, and D. Fallon. 2002.
Saintilan. 2006. Coastal wetland vulnerability to relative sea-level Anthropogenic and climate-change impacts on salt marshes of
rise: wetland elevation trends and process controls, 271-292. In Jamaica Bay, New York City. Wetlands 22 (1): 71–89.
Wetlands and natural resource management ecological studies Hopkinson, C.S., J.T. Morris, S. Fagherazzi, W.M. Wollheim, and P.A.
(Analysis and Synthesis), Vol. 190, eds. J.T.A. Verhoeven, B. Raymond. 2018. Lateral marsh edge erosion as a source of sedi-
Beltman, R. Bobbink, and D.F. Whigham. Berlin: Springer. ments for vertical marsh accretion. Journal of Biogeosciences 123:
Cahoon, R.C., J.C. Lynch, C.T. Roman, J.P. Schmit, and D.E. Skidds. 2444–2465.
2019. Evaluating the relationship among wetland vertical develop- Horton, B.P., S.E. Engelhart, D.F. Hill, A.C. Kemp, D. Nikitina, K.G.
ment, elevation capital, sea-level rise, and tidal marsh sustainability. Miller, and W.R. Peltier. 2013. Influence of tidal-range change and
Estuaries and Coasts 42 (1): 1–15. sediment compaction on Holocene relative sea-level change in New
Carey, J.C., K.B. Raposa, C. Wigand, and R.S. Warren. 2017. Jersey, USA. Journal of Quaternary Science 28 (4): 403–411.
Contrasting decadal-scale changes in elevation and vegetation in Hunter, K.L., D.A. Fox, L.M. Brown, and K.W. Able. 2006. Responses
two Long Island Sound salt marshes. Estuaries and Coasts 40 (3): of resident marsh fishes to stages of Phragmites australis invasion in
651–661. three mid-Atlantic estuaries, U.S.A. Estuaries and Coasts 29 (3):
Chambers, R.M., L.A. Meyerson, and K. Saltonstall. 1999. Expansion of 487–498.
Phragmites into tidal wetlands of North America. Aquatic Botany Kearney, M.S., and R.E. Turner. 2016. Microtidal marshes: can these
64 (3-4): 261–273. widespread and fragile marshes survive increasing climate-sea-
Colombano D. D., S. Y. Litvin, Ziegler S.L., Alford S.B., Baker R., level variability and human action? Journal of Coastal Research
Barbeau M.A., Cebrián J., Connolly R.M., Currin C.A., Deegan 32 (3): 686–699.
L.A., Lesser J.S., Martin C.W., McDonald A.E., McLuckie C., Kearney, M.S., R.E. Grace, and J.T. Stevenson. 1988. Marsh loss in
Morrison B.H., Pahl J.W., Risse L.M., Smith J.A., Staver L.W., Nanticoke Estuary, Chesapeake Bay. Geographical Review 78 (2):
Turner R.E., Waltham N.J. 2021. Climate change implications for 205–220.
tidal marshes and food web linkages to estuarine and coastal nekton. Kemp, A.C., B.P. Horton, C.H. Vane, C.E. Bernhardt, D.R. Corbett, S.E.
Estuaries and Coasts. https://doi.org/10.1007/s12237-020-00891-1. Engelhart, S.A. Anisfeld, A.C. Parnell, and N. Cahill. 2013. Sea-
Crosby, S.C., D.F. Sax, M.E. Palmer, H.S. Booth, L.A. Deegan, M.D. level change during the last 2500 years in New Jersey, USA.
Bertness, and H.M. Leslie. 2016. Salt marsh persistence is threat- Quaternary Science Reviews 81: 90–104.
ened by predicted sea-level rise. Estuarine, Coastal and Shelf Kennish, M.J. 2004. Chapter 3: Jacques Cousteau National Estuarine
Science 181: 93–99. Research Reserve, 59-115. In Estuarine Research Monitoring, and
Crotty, S.M., C. Angelini, and M.D. Bertness. 2017. Multiple stressors Resource Protection, ed. M. Kennish. New York: CRC Press.
and the potential for synergistic loss of New England salt marshes. Kennish, M.J., M.S. Meixler, G. Petruzzelli, and B. Fertig. 2014a.
PLoS One 9: e0183058. Tuckerton peninsula salt marsh system: a sentinel site for assessing
DeLaune, R.D., J.A. Nyman, and W.H. Patrick Jr. 1994. Peat collapse, climate change effects. Bulletin of the New Jersey Academy of
ponding and wetland loss in a rapidly submerging coastal marsh. Science 59: 1–5.
Journal of Coastal Research 10: 1021–1030. Kennish, M.J., A. Spahn, and G.P. Sakowicz. 2014b. Sentinel site devel-
Donnelly, J.P., and M.D. Bertness. 2001. Rapid shoreward encroachment opment of a major salt marsh system in the Mid-Atlantic region
of salt marsh cordgrass in response to accelerated sea-level rise. (USA). Open Journal of Ecology 4 (03): 77–86. https://doi.org/10.
Proceedings of the National Academy of Sciences 98 (25): 14218– 4236/oje.2014.43010.
14223. Kennish, M.J., R.G. Lathrop Jr., A. Spahn, G.P. Sakowicz, and R.
Ezer, T., and L.P. Atkinson. 2014. Accelerated flooding along the U.S. Sacatelli. 2016. The JCNERR sentinel site: research and monitoring
east coast: on the impact of sea-level rise, tides, storms, the Gulf applications. Bulletin of the New Jersey Academy of Science 61: 1–8.
Stream, and the North Atlantic oscillations. Earth’s Future 2 (8): Kirwan, M.L., and K.B. Gedan. 2019. Sea-level driven land conversion
362–382. and the formation of ghost forests. Nature Climate Change 9 (6):
450–457.
Gedan, K.B., B.R. Silliman, and M.D. Bertness. 2009. Centuries of
human-driven change in salt marsh ecosystems. Annual Review of Kirwan, M.L., and J.P. Megonigal. 2013. Tidal wetland stability in the
Marine Science 1 (1): 117–141. face of human impacts and sea-level rise. Nature 504 (7478): 53–60.
Gilby, B.L., M. P. Weinstein, R. Baker, J. Cebrian, S. B. Alford, A. Kirwan, M.L., J.L. Kirwan, and C.A. Copenheaver. 2007. Dynamics of
Chelsky, D. Colombano, R. M. Connolly, C. A. Currin, I. C. an estuarine forest and its response to rising sea-level. Journal of
Feller, A. Frank, J. A. Goeke, L. A. Goodridge Gaines, F. E. Coastal Research 23: 457–463.
Hardcastle, C. J. Henderson, C. W. Martin, A. E. McDonald, B. Kirwan, M.L., S. Temmerman, E.E. Skeehan, G.R. Guntenspergen, and
H. Morrison, A. D. Olds, J. S. Rehage, N. J. Waltham and S. L. S. Fagherazzi. 2016. Overestimation of marsh vulnerability to sea-
Ziegler. 2020 Human actions alter tidal marsh seascapes and the level rise. Nature Climate Change 6. https://doi.org/10.1038/
provision of ecosystem services. Estuaries and Coasts. https://doi. Nclimate2909.
org/10.1007/s12237-020-00830-0 Lathrop, R.G., M.B. Cole, and R.D. Showalter. 2000. Quantifying the
Good, R.E., and N.F. Good. 1984. The Pinelands National Reserve: an habitat structure and spatial pattern of New Jersey (U.S.A.) salt
ecosystem approach to management. Bioscience 34 (3): 169–173. marshes under different management regimes. Wetlands Ecology
and Management 8 (2/3): 163–172.
Hagan, S.M., S.A. Brown, and K.W. Able. 2007. Production of mummi-
Mariotti, G. 2016. Revisiting salt marsh resilience to sea-level rise: are
chog (Fundulus heteroclitus): response in marshes treated for com-
ponds responsible for permanent land loss? Journal of Geophysical
mon reed (Phragmites australis) removal. Wetlands 27 (1): 54–67.
Research: Earth Surface 121 (7): 1391–1407.Estuaries and Coasts (2021) 44:1649–1657 1657
Mariotti, G. 2020. Beyond marsh drowning: the many faces of marsh loss Smith, J.A.M., and M. Pellew. 2021. Pond dynamics yield minimal net
(and gain). Advances in Water Resources 144: 103710. https://doi. loss of vegetation cover across an unditched salt marsh landscape.
org/10.1016/j.advwatres.2020.103710. Estuaries and Coasts. https://doi.org/10.1007/s12237-020-00882-2.
McKenna, K., N. DiCosmo, B. Greenfeld, J. Gebert, and H. Jensen. 2018. Stevenson, J.C., and M.S. Kearny. 2009. Impacts of global climate
Quantification of flood event forcing and the impact of natural wet- change and sea-level rise on tidal wetlands, 171-206. In Human
land systems: Great Bay Boulevard, Ocean County, New Jersey. impacts on salt marshes: a global perspective, ed. B.R. Silliman,
U.S. Army Corps of Engineers Institute for Water Resources. E.D. Grosholz, and M.D. Bertness. Berkeley: University of
Technical Report No. FHWA-HEP-18-069. California Press.
Meixler, M.S., M.J. Kennish, and K.F. Crowley. 2017. Assessment of Suk, N.S., Q. Guo, and N.P. Psuty. 1999. Suspended solids flux between
plant community characteristics in natural and human-altered coast- salt marsh and adjacent bay: a long-term continuous measurement.
al marsh ecosystems. Estuaries and Coasts. 41 (1): 52–64. https:// Estuarine, Coastal and Shelf Science 49 (1): 61–81.
doi.org/10.1007/s12237-017-0296-0. Temmerman, S., T.J. Bouma, G. Govers, and D. Lauwaet. 2005. Flow
Meyerson, L.A., K. Saltonstall, L. Windham, E. Kiviat, and S. Findlay. paths of water and sediment in a tidal marsh: relations with marsh
2000. A comparison of Phragmites australis in freshwater and development stage and tidal inundation height. Estuaries 28 (3):
brackish marsh environments in North America. Wetlands Ecology 338–352.
Management 8 (2/3): 89–103. Van Huissteden, J., and O. Van de Plassche. 1998. Sulphate reduction as
Miller, K.G., R.E. Kopp, B.P. Horton, J.V. Browning, and A.C. Kemp. a geomorphological agent in tidal marshes (‘Great Marshes’ at
2013. A geological perspective on sea-level rise and its impacts Barnstable, Cape Cod, USA). Earth Surface Processes and
along the U.S mid-Atlantic coast. Earth’s Future. https://doi.org/ Landforms 23 (3): 223–236.
10.1002/2013EF000135. Walker, J.S., R.E. Kopp, T.A. Shaw, N. Cahill, N.S. Khan, D.C. Barber,
Morris, J.T., P.V. Sundareshwar, C.T. Nietch, B. Kjerfve, and D.R. E.L. Ashe, M.J. Brain, J.L. Clear, D. Reide Corbett, and B.P.
Cahoon. 2002. Responses of coastal wetlands to rising sea-level. Horton. 2021. Common Era seal-level budgets along the U.S.
Ecology 83 (10): 2869–2877. Atlantic Coast. Nature Communications 12:1841. 12 (1): 1841.
Pennings, S.C., and M.O. Bertness. 2001. Salt marsh communities. In https://doi.org/10.1038/s41467-021-22079-2.
Marine Community Ecology, ed. M.D. Bertness, S.D. Gaines, and
Watson, E.B., K.B. Raposa, J.C. Carey, C. Wigand, and R.S. Warren.
M.G. Hay, 289–316. Sunderland, MA: Sinauer Associates.
2017a. Anthropocene survival of Southern New England’s salt
Raabe, E.A., and R.P. Stumpf. 2015. Expansion of tidal marsh in re-
marshes. Estuaries and Coasts 40 (3): 617–625.
sponse to sea-level rise: Gulf coast of Florida, USA. Estuaries and
Watson, E.B., C. Wigand, E.W. Davey, H.M. Andrews, J. Bishop, and
Coasts 39: 145–157.
K.B. Raposa. 2017b. Wetland loss patterns and inundation-
Raichel, D.L., K.W. Able, and J.M. Hartman. 2003. The influence of
productivity relationships prognosticate widespread salt marsh loss
Phragmites (common reed) on the distribution, abundance and po-
for Southern New England. Estuaries and Coasts 40 (3): 662–681.
tential prey of a resident marsh fish in the Hackensack
Weinstein, M.P., and J.H. Balletto. 1999. Does the common reed,
Meadowlands, New Jersey. Estuaries 26 (2): 511–521.
Phragmites australis, affect essential fish habitat? Estuaries 22
Raposa, K.B., R.L.J. Weber, M.C. Ekberg, and W. Ferguson. 2017.
(3): 793–802.
Vegetation dynamics in Rhode Island salt marshes during a period
of accelerating sea-level rise and extreme sea-level events. Estuaries Weinstein, M.P., S.Y. Litvin, K.L. Bosley, C.M. Fuller, and S.C.
and Coasts 40 (3): 640–650. Wainwright. 2000. The role of tidal salt marsh as an energy source
Roman, C.T. 2017. Salt marsh sustainability: challenges during an uncer- for marine transient and resident finfishes: a stable isotope approach.
tain future. Estuaries and Coasts 40 (3): 711–716. Transactions of the American Fisheries Society 129 (3): 797–810.
Sallenger, A.H., Jr., K.S. Doran, and P.A. Howd. 2012. Hotspot of ac- Weis, J.S., and P. Weis. 2003. Is the invasion of the common reed,
celerated sea-level rise on the Atlantic coast of North America. Phragmites australis, into tidal marshes of the eastern U.S. an eco-
Nature Climate Change 2 (12): 884–888. logical disaster? Marine Pollution Bulletin 46 (7): 816–820.
Scheider, N.W., D.C. Walters, and M.L. Kirwan. 2018. Massive upland Wilson, K.R., J.T. Kelley, A. Croitoru, M. Dionne, D.F. Belknap, and R.
to wetland conversion compensated for historical marsh loss in Steneck. 2009. Stratigraphic and ecophysical characterizations of
Chesapeake Bay, USA. Estuaries and Coasts 41 (4): 940–951. salt pools: dynamic landforms of the Webhannet Salt Marsh,
Schepers, L., M. Kirwan, G. Guntenspergen, and S. Temmerman. 2016. Wells, ME, USA. Estuaries and Coasts 32 (5): 855–870.
Spatio-temporal development of vegetation die-off in a submerging Wilson, K.R., J.T. Kelley, B.R. Tanner, and D.F. Belknap. 2010. Probing
coastal marsh. Limnology and Oceanography 62: 137–150. the origins and stratigraphic signature of salt pools from north-
Schuerch, M., T. Spencer, S. Temmerman, M.L. Kirwan, C. Wolf, D. temperate marshes in Maine, U.S.A. Journal of Coastal Research
Lincke, C.J. McOwen, M.D. Pickering, R. Reef, A.T. Vafeidis, J. 26: 1007–1026.
Hinkel, R.J. Nicholls, and S. Brown. 2018. Future response of glob- Windham, L. 1999. Microscale spatial distribution of Phragmites
al coastal wetlands to sea-level rise. Nature 561 (7722): 231–234. australis (common reed) invasion into Spartina patens (salt hay)-
Sedia, E. and G.L. Zimmermann. 2006. Effects of salinity and flooding dominated communities in brackish tidal marsh. Biological
on Atlantic white-cedar seedlings. The Ecology and Management of Invasions 1 (2/3): 137–148.
Atlantic white-cedar Symposium 2008, Atlantic City, New Jersey. Windham, L., and R.G. Lathrop Jr. 1999. Effects of Phragmites australis
Smith, J.A.M. 2013. The role of Phragmites australis in mediating inland (Common reed) invasion on aboveground biomass and soil proper-
salt marsh migration in a Mid-Atlantic estuary. PLoS One 8 (5): ties in brackish tidal marsh of the Mullica River, New Jersey.
e65091. Estuaries 22 (4): 927–935.You can also read