Continuous borehole optical televiewing reveals variable englacial debris concentrations at Khumbu Glacier, Nepal - DORA 4RI
←
→
Page content transcription
If your browser does not render page correctly, please read the page content below
ARTICLE
                  https://doi.org/10.1038/s43247-020-00070-x              OPEN

                  Continuous borehole optical televiewing reveals
                  variable englacial debris concentrations at Khumbu
                  Glacier, Nepal
                  Katie E. Miles 1 ✉, Bryn Hubbard 1, Evan S. Miles                          2,   Duncan J. Quincey          3,   Ann V. Rowan        4,

                  Martin Kirkbride 5 & Josephine Hornsey4
1234567890():,;

                  Surface melting of High Mountain Asian debris-covered glaciers shapes the seasonal water
                  supply to millions of people. This melt is strongly influenced by the spatially variable thick-
                  ness of the supraglacial debris layer, which is itself partially controlled by englacial debris
                  concentration and melt-out. Here, we present measurements of deep englacial debris con-
                  centrations from debris-covered Khumbu Glacier, Nepal, based on four borehole optical
                  televiewer logs, each up to 150 m long. The mean borehole englacial debris content is ≤ 0.7%
                  by volume in the glacier’s mid-to-upper ablation area, and increases to 6.4% by volume near
                  the terminus. These concentrations are higher than those reported for other valley glaciers,
                  although those measurements relate to discrete samples while our approach yields a con-
                  tinuous depth profile. The vertical distribution of englacial debris increases with depth, but is
                  also highly variable, which will complicate predictions of future rates of surface melt and
                  debris exhumation at such glaciers.

                  1 Centre for Glaciology, Department of Geography and Earth Sciences, Aberystwyth University, Aberystwyth, UK. 2 Swiss Federal Research Institute WSL,

                  Birmensdorf, Switzerland. 3 School of Geography, University of Leeds, Leeds, UK. 4 Department of Geography, University of Sheffield, Sheffield, UK.
                  5 Department of Geography and Environmental Science, University of Dundee, Dundee, UK. ✉email: kam64@aber.ac.uk

                  COMMUNICATIONS EARTH & ENVIRONMENT | (2021)2:12 | https://doi.org/10.1038/s43247-020-00070-x | www.nature.com/commsenv                              1
ARTICLE                                              COMMUNICATIONS EARTH & ENVIRONMENT | https://doi.org/10.1038/s43247-020-00070-x

T
        he importance of glacier meltwater in contributing to global         ice glaciers disappear. Yet, recent studies have found glacier-scale
        water resources and moderating seasonal streamflow varia-             thinning rates at debris-covered glaciers to be similar to those at
        tions is widely recognised, particularly for catchments              clean-ice glaciers, referred to as the ‘debris-cover anomaly’15–19.
draining High Mountain Asia1–4. However, the shrinking of glaciers           Importantly, as mass balance becomes more negative, supraglacial
in response to a warming climate5 raises concerns over their                 debris layers will increase in thickness and extend upglacier over
longevity and contribution to future water resources1,4. For exam-           time20, primarily due to the enhanced exhumation of englacial
ple, the passing of ‘peak water’ is predicted to occur across High           debris14,21–23, augmented by deposits from hillslopes and lateral
Mountain Asia before the end of this century, after which glacial            moraines that will continue to contribute spatially and temporally
inputs to streamflow will diminish rapidly1,6,7. As a result, the             discrete supplies24–27. Englacial debris will therefore play a key
potential impact of climatic changes on these basins is becoming             role in determining rates of ice loss, potentially insulating these
increasingly apparent; in a global study of 78 ‘water towers’, the           important ice reserves for decades to come. However, despite its
three most vulnerable were located in High Mountain Asia8.                   importance, no measurements of englacial debris concentration
   The rate of atmospherically driven surface melting at debris-             or distribution have yet been reported for any High Mountain
covered glaciers, which comprise ~30% of glacial ablation areas in           Asian debris-covered glacier.
High Mountain Asia5, is strongly influenced by the spatially                     Our aim herein is to measure and report the first deep and
variable supraglacial debris thickness, described by the shape of            spatially distributed englacial debris concentrations at a High
the Østrem curve9. Where debris layers are thin, melt rates are              Mountain Asian debris-covered glacier. We drilled by pressurised
enhanced compared to debris-free (‘clean-ice’) surfaces, peaking             water28 and logged by optical televiewer (OPTV)29 four boreholes
at the ‘effective thickness’, a value of the order of 0.02–0.05 m            located across the ablation area of debris-covered Khumbu Gla-
according to local conditions. As the debris layer thickens beyond           cier, Nepal Himalaya (Fig. 1), in 2017 and 2018 (Supplementary
this, it reaches a ‘critical thickness’ of ~0.05 m at which the melt         Table 1). The OPTV logs provide a geometrically accurate full-
rate of the debris-covered ice is equal to that of clean ice. Above          colour image of the complete borehole wall at a typical resolution
this critical thickness, the debris layer insulates the ice surface and      of ~0.22 mm laterally and ~1 mm vertically, providing an effective
suppresses, rather than enhances, atmospherically driven abla-               means of identifying and quantifying inclusions29 such as eng-
tion9–13. Due to this melt suppression, debris-covered glaciers are          lacial debris. Here, we analyse these four OPTV image logs to
expected to persist longer than climatically equivalent clean-ice            map and quantify englacial debris concentrations at Khumbu
glaciers14, becoming increasingly important water stores as clean-           Glacier.

Fig. 1 Location of Khumbu Glacier and televiewed boreholes. a Location of Khumbu Glacier, Nepal. b Location of boreholes logged by optical televiewer on
the glacier. The background is a Sentinel-2A image acquired on 30 October 2018. Glacier contours are at 100 m intervals from 4900 to 6800 m a.s.l.,
created from the 2015 SETSM DEM57. Supraglacial debris thicknesses are modelled outputs27. Each borehole is labelled with the site number, borehole
ID28,33,58, and OPTV log length59.

2           COMMUNICATIONS EARTH & ENVIRONMENT | (2021)2:12 | https://doi.org/10.1038/s43247-020-00070-x | www.nature.com/commsenv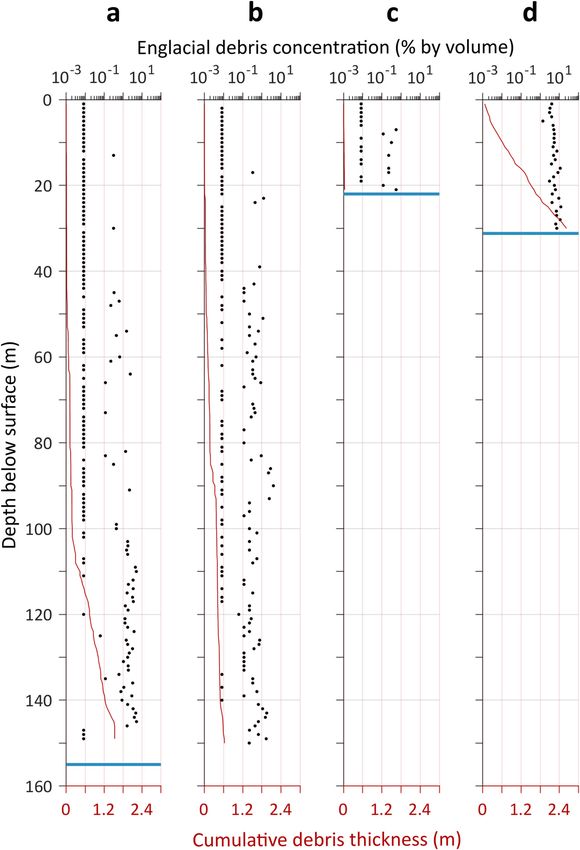
COMMUNICATIONS EARTH & ENVIRONMENT | https://doi.org/10.1038/s43247-020-00070-x                                                            ARTICLE

Fig. 2 Examples of OPTV image log debris inclusions and classifications (coloured bars). a A single large clast in BH17-09 (Site 2). b Fine debris and
small clasts in BH17-01 (Site 1). c Large clasts and fine, dispersed sediment in BH18-04 (Site 4). d High concentration of small clasts in BH17-01 (Site 1).
e A high concentration, discrete layer of fine sediment in BH17-13 (Site 3). f High concentration, discrete layers of small debris clasts, and fine sediment in
BH17-13 (Site 3). g Very high concentration, discrete layers of fine sediment in BH17-01 (Site 1). All logs are unrolled to progress North-East-South-West-
North from left to right. Saturated vertical reflections are superficial artefacts from the drilling process. Obscured parts of the images (i.e., b from N–S;
c from SW–N; and d–g from N–SE) are due to turbid water (Supplementary Fig. 5 and ‘Methods’ section), and are excluded from all analysis.

Results                                                                         often obscured by turbid borehole water and/or uneven borehole
The OPTV successfully logged all four boreholes, totalling 345.5                drilling28 (Supplementary Fig. 5). However, debris was clearly
m of the glacier’s interior (full, raw image logs are shown in                  visible in all the OPTV images as reflections brighter than the
Supplementary Figs. 1–4). Two of the logs, at Sites 3 and 4 in the              background ice, often with a lithologically controlled red-gold
mid-ablation area, each reached ~150 m depth (Fig. 1b and                       hue (Fig. 2). Debris distribution through the logs varied: fine
Supplementary Table 1). Image quality was variable, with sectors                sediment and discrete clasts were observed to be either dispersed

COMMUNICATIONS EARTH & ENVIRONMENT | (2021)2:12 | https://doi.org/10.1038/s43247-020-00070-x | www.nature.com/commsenv                                     3

ARTICLE COMMUNICATIONS EARTH & ENVIRONMENT | https://doi.org/10.1038/s43247-020-00070-x
Table 1 Summary of borehole englacial debris concentrations and estimated ice column debris thickness, by site.
Facies Site 1 Site 2 Site 3 Site 4 Units
Low (0.0083% by volume) 1 26.8 98.1 88.2 95.6 % of OPTV image area
Medium (5.5% by volume) 2a 58.3 1.8 11.4 3.7
High (15% by volume) 2b 13.0 0.2 0.5 0.7
Very high (65% by volume) 3 1.9 0 0 0
Mean borehole englacial debris concentration 6.4 0.1 0.7 0.3 % by volume
OPTV log length (visible image) 27.0 20.1 147.4 134.4 m
Equivalent debris layer thickness from borehole ice deptha 2.6 0.04 1.5 0.6
Estimated full ice thicknessb 46 225 337 252
Equivalent debris layer thickness from estimated full ice thicknessa 4.4 0.4 3.5 1.2 m
Uncertainties in the category debris concentrations, and therefore the mean borehole debris concentrations and thicknesses, are estimated to be ±50% (Methods). The estimates presented exclude
basal debris or any additional debris layers, such as buried rockfall deposits, that could not be penetrated by the hot-water drill28. Bolding indicates key values derived by our analyses.
aThickness of the supraglacial debris layer that would result from melting the borehole length or full ice column (as indicated), assuming no debris redistribution at the surface and a bulk effective
porosity of 0.33 (ref. 31). Calculations are provided the 'Methods' section.
bIce thicknesses are model outputs27, except for Site 1 where the neighbouring borehole was considered to have reached the bed28,33
through the ice column or focused in discrete bands (examples increase in cumulative debris thickness along the full borehole
are shown in Fig. 2). The image resolution was such that textures length. This reflects the large number of medium category layers
and shadows were visible on some of the larger clasts (‘Methods’ located throughout the borehole, augmented at depth by an
section). Each log was classified manually according to debris increase in the presence of high and very high debris con-
concentration into four categories (Fig. 2 and ‘Methods’ section): centration categories: 86% and 96% of these layers were located in
low, medium, high, or very high. The debris content of the the lower half of the borehole, respectively.
medium and high categories (mean of 5.5% and 15% by volume,
respectively) was determined directly from the OPTV image logs
(‘Methods’ section and Supplementary Fig. 6). This was not Discussion
possible for the low and very high categories, for which debris Technique evaluation. The OPTV image logs presented herein
concentrations (mean of 0.0083% and 65% by volume, respec- (Fig. 2 and Supplementary Figs. 1–4) yield unprecedented views
tively) were attributed on the basis of their visual similarity to ice at four locations into the interior of a high-elevation debris-
facies that have already been identified, and whose debris con- covered glacier. Each log provides a continuous, geometrically
centrations have been ascertained by direct measurement30 consistent, and fine-resolution image from which englacial debris
(‘Methods’ section). The full classification of each image log at concentrations have been approximated (uncertainty is discussed
0.01 m vertical resolution is shown in Supplementary Fig. 7 and below). Thus, relative to traditional sample-based methods,
the percentage of each log in each category is presented in measurement of englacial debris concentration by borehole
Table 1. Most of the imaged ice (≥88% at Sites 2–4; Table 1) OPTV is less accurate, but has several other advantages. First, the
hosted debris that comprised small, scattered clasts, and dispersed raw data resolution is millimetric, enabling high-resolution var-
fine sediment of low concentration (Fig. 2), though some iations in debris concentration to be identified and quantified.
appeared at higher concentrations (Fig. 2c–g), either dispersed Second, precise debris disposition and association with structure
throughout the ice or concentrated as dipping layers (Fig. 2e–g). is visible in the OPTV images (such patterns are not readily
The mean borehole englacial debris concentration at Sites 2–4 identifiable in surface samples, which are commonly melted in
(Fig. 1b) was ≤0.7% by volume (Table 1). This contrasts markedly the field rather than returned to the laboratory for more precise
with the higher mean concentration (6.4% by volume) measured analysis32). Third, OPTV-derived debris concentration profiles
at Site 1, located near the glacier’s terminus. Indeed, if the entire are continuous, and therefore free from bias introduced by
ice column at Site 1 were melted, a total debris thickness of 4.4 m selective surface sampling. Fourth, continuous OPTV-derived
would be released, which is higher than at any of Sites 2–4 debris concentration profiles include subsurface ice that may not
(0.4–3.5 m thickness) despite the ~5x greater ice thickness at Sites be accessible (for safety or other logistical reasons) when it is
3 and 4 (Table 1). These debris thicknesses assume a bulk eventually exposed at the surface. Finally, the properties of a given
effective porosity of 0.33, as measured on neighbouring Ngo- ice–debris parcel will have changed during transport prior to
zumpa Glacier, Nepal31, and may be considered as equivalent exhumation. Consequently, although logistically demanding,
because no account is taken of debris spreading or erosion at the borehole-derived englacial debris concentrations such as those we
surface. provide herein yield more spatially continuous—and hence
The englacial debris concentration profiles along each borehole representative—values of the volume and distribution of englacial
are both highly variable and show a general increase in con- debris than has previously been possible. To our knowledge,
centration with depth (Fig. 3). This is particularly evident in neither deep englacial debris concentrations nor the continuous
terms of the presence of relatively high local debris concentra- variation of englacial debris with depth have hitherto been
tions along the two longer boreholes: the lowermost 50 m of each reported for any ice mass.
of the OPTV image logs at Sites 3 and 4 contain 92% and 56% of Despite the improvements noted above, calculating englacial
the medium category layers, respectively (Fig. 3 and Supple- debris concentrations from the analysis of OPTV image logs
mentary Fig. 7). Similarly, the lower half of the boreholes at Sites involves a higher level of uncertainty than does direct ice
3 and 4 also host 73% and 84% of the high concentration debris sampling. We consider the largest source of this uncertainty to be
layers, respectively. The impact of these higher concentration associated with the manual delineation and calculation of the
layers with depth is highlighted by the cumulative debris thick- areas of individual clasts, when determining the medium and
ness curves (red lines on Fig. 3), which show an almost negligible high category concentrations (‘Methods’ section). This uncer-
increase between the surface and depths of ~100 and ~85 m at tainty was approximated through operator analysis of seven
Sites 3 and 4, respectively. In contrast, Site 1 shows a strong representative OPTV image samples of these two ice types. For
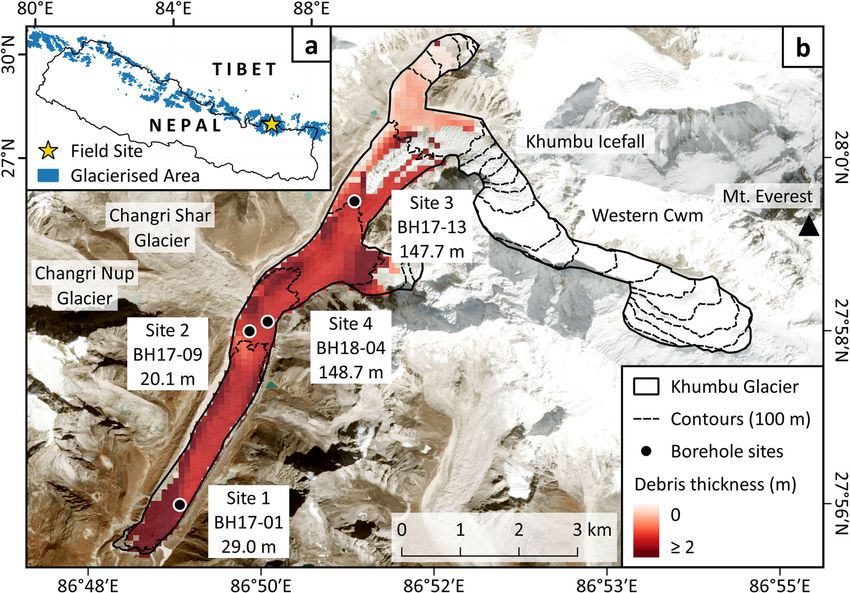
4 COMMUNICATIONS EARTH & ENVIRONMENT | (2021)2:12 | https://doi.org/10.1038/s43247-020-00070-x | www.nature.com/commsenvCOMMUNICATIONS EARTH & ENVIRONMENT | https://doi.org/10.1038/s43247-020-00070-x ARTICLE Fig. 3 Englacial debris concentrations plotted against depth for 1 m borehole sections from upglacier (left) to downglacier (right). a Site 3; b Site 4; c Site 2; and d Site 1. Black dots show the mean englacial debris concentration for each 1 m section of the borehole. Red lines show the equivalent cumulative debris thickness (assuming no debris spreading or erosion and a bulk porosity of 0.33)31 that would be left if the ice above were to be melted (incrementing in the same 1 m sections), and thick blue lines represent the base of each borehole (Site 4 is at 192 m)28. The uppermost ~2 m of each borehole was not logged as this is the length of probe above the camera. each sample, every identifiable debris clast was delineated, high categories (‘Methods’ section), we take uncertainty to be the yielding a mean debris concentration of 5.5% (standard error standard deviation of the multiple samples analysed by the 0.98%) for the medium debris concentration category and 15% original study30 (‘Methods’ section). (standard error 1.7%) for the high debris concentration category. Although the image log resolution was high (pixel size In adopting published debris concentrations for our low and very estimated to be ~0.22 laterally and 1 mm vertically), it was COMMUNICATIONS EARTH & ENVIRONMENT | (2021)2:12 | https://doi.org/10.1038/s43247-020-00070-x | www.nature.com/commsenv 5
ARTICLE                                             COMMUNICATIONS EARTH & ENVIRONMENT | https://doi.org/10.1038/s43247-020-00070-x

insufficient to view individual scattered fine (≪1 mm) particles,             model of Khumbu Glacier. Their modelled glacier was fed by a
likely resulting in an underestimation of the total debris                  constant debris input equivalent to an estimated headwall erosion
concentration. However, our observations of ice forming                     rate of 1 mm a−1. Our englacial debris concentrations are therefore
supraglacial cliff faces across the tongue of Khumbu Glacier                within the range of values derived from estimates of headwall
suggest that the scattered presence of fine debris is unlikely to be         erosion at Khumbu Glacier, for example, 0.6 ± 0.3 mm a−1 for the
significant to the glacier’s overall englacial debris concentration          present day (0.8 ± 0.2 mm a−1 during the Holocene) by Barker37.
(in contrast to aggregations of such debris, which were visibly             While our concentrations are higher than some published values,
identifiable in the OPTV image logs, e.g., Fig. 2e, g). The debris           these likely underestimate englacial debris concentration. For
concentration of the Site 4 image log may also be underestimated,           example, one estimate38 relied on inversion of the supraglacial
as numerous small, saturated (i.e., all RGB channels at or close to         debris volume and did not account for subsurface debris, while a
maximum brightness (255)) reflections were interpreted as                    second25 based the erosion rate calculation on only one debris
bubbles in the ice rather than as debris (which typically has a             lithology.
red-gold hue). It is possible for debris to appear as saturated                Debris concentrations reconstructed along our boreholes are
reflections, but the shapes and clustering of the saturated                  not uniform; instead, concentration increases with depth,
reflections were more akin to bubbles than other clasts through              particularly in terms of the frequency of high concentration
the log, and were therefore classified as such.                              layers (Fig. 3 and Supplementary Fig. 7). While this pattern would
   Other sources of uncertainty include the occasionally poor               be expected at Site 1, where the base of the OPTV log is thought
quality of the OPTV image logs (turbid water obscuring the                  to be ~15 m above the bed and thus a basal influence is likely, the
borehole wall in places; Supplementary Fig. 5) and the manual               longer boreholes at Sites 3 and 4 extend through only ~50% of the
classification of the logs into one of the four debris categories.           ice column33,39. Higher debris concentrations at depth within
Furthermore, as only one of our boreholes may have reached the              Khumbu Glacier (and hence other similar glaciers) may result
bed28,33, all borehole debris concentrations are effectively lower          from a variety of processes, such as: (i) greater debris
limits of the glacier’s net debris content, as they exclude debris          incorporation into the glacier in the upper than the lower
entrained within basal ice and any additional layers too thick for          accumulation area; (ii) debris falling to the base of crevasses in the
the hot-water drill to penetrate, such as at Site 2 (ref. 28).              glacier’s icefall or at its margins; (iii) entrainment and elevation of
   Given the complexity of the uncertainties outlined above (and            basal debris within the glacier, such as in association with the
in the absence of accompanying deep ice cores that would allow              icefall and its band ogives26,40; or (iv) tributaries (present or
direct quantitative comparison), we adopt a net uncertainty in              former) joining from hanging cirques/valleys leaving their basal
our reconstructed debris concentrations at the borehole and facies          debris layers in the lower sections of the main glacier tongue.
scale of ±50% (including summary values shown in Table 1).

                                                                            Englacial debris facies. Based on the debris concentration cate-
Englacial debris concentrations. The mean englacial debris                  gories and their prevalence in the boreholes, we identify three
concentrations measured along each borehole at Khumbu Glacier               material facies within Khumbu Glacier (Table 1) and discuss their
(0.1–6.4% by volume; Table 1) are generally higher than englacial           likely sources. Facies 1 comprises the low category of pre-
debris concentrations measured - usually by discrete surface                dominantly fine, dispersed debris (Fig. 2), akin to the dispersed
sampling - at glaciers elsewhere. While the low and very high               facies in otherwise ‘clean’ glacier ice reported at other valley
debris categories were attributed published concentrations30, the           glaciers41. This facies forms ≥88% of the borehole wall at Sites
medium and high categories were calculated directly by OPTV                 2–4 and 27% at Site 1, and we therefore interpret this facies as the
image analysis. Assuming an ice density of 0.91 g cm−3 and a                background matrix of ice at Khumbu Glacier. Due to its dispersed
debris density of 2.2 g cm−3, the medium category of 5.5% by                nature, the debris is most likely entrained in a spatially distributed
volume equates to 12% by weight, and the high category of 15%               manner during snow burial and firnification in the glacier’s
by volume to 30% by weight. The mean borehole englacial debris              accumulation area42, quite possibly associated with frequent
concentrations we recorded at Khumbu Glacier were 14% by                    minor mass movement events (e.g., rockfalls and avalanches) in
weight at Site 1; 0.31% by weight at Site 2; 1.7% by weight at Site         Everest’s Western Cwm (Fig. 1b).
3; and 0.75% by weight at Site 4. All these values are higher than             We define facies 2 as the medium and high debris concentra-
published englacial debris concentrations; for example,                     tion categories of predominantly fine, scattered material of higher
0.0001–0.0097% by weight on the clean-ice Watts Outlet Glacier,             concentration than facies 1, with some larger clast sizes and
Baffin Island, Canada34, and 0.12% by weight on the debris-                  banding of debris (e.g., Fig. 2c–f). We divide this facies into two
covered Djankuat Glacier, Caucasus35 (both determined by sur-               sub-facies: facies 2a for the medium category extending through
face measurements alone), and are closer to measured basal ice              broad zones of our OPTV image logs, and facies 2b for the high
concentrations, which can range from 1–84% by weight30,36.                  category, in which some discrete debris bands are visible. The
Indeed, our very high category was assumed to have the same                 primarily scattered nature of the debris incorporated within this
concentration as solid facies basal ice30; this category exists solely      facies suggests a similar formation to facies 1, though infrequent
as a small number of discrete, high-density layers, which further           thin bands of higher concentration debris could be the proximal
suggests they may have been entrained at the bed, compared to               edges of entrained mass movement deposits. The presence of
the medium and high categories where the debris tends to be                 isolated larger clasts deep in the ice column may be debris that
more dispersed.                                                             has fallen into crevasses during transit through the icefall or,
   While most ice-flow models of debris-covered glaciers do not              perhaps more likely, individual clasts that have been loosened by
consider englacial debris transport, the few that do either specify a       freeze–thaw cycles on rock slopes within the Western Cwm,
uniform englacial debris content23,35 or approximate it from                dislodged and buried in the glacier’s accumulation area during
considerations of the distribution of debris supplied to the                avalanches43–45.
glacier14,27. Our mean borehole englacial debris concentration at              Facies 3, present only at Site 1, comprises the very high
Site 3 (0.7% by volume) is similar to the mean englacial debris             category of discrete layers of debris that is generally fine-textured,
concentration of 0.6% by volume for the uppermost 145 m of the              but includes some small clasts. The very high debris concentra-
ice column at the base of the icefall yielded from Rowan et al.’s27         tion of these layers (65% by volume; Table 1) is within the range

6           COMMUNICATIONS EARTH & ENVIRONMENT | (2021)2:12 | https://doi.org/10.1038/s43247-020-00070-x | www.nature.com/commsenv
COMMUNICATIONS EARTH & ENVIRONMENT | https://doi.org/10.1038/s43247-020-00070-x ARTICLE
of reported basal debris layers36,41, and although we did not and, to our knowledge, for any ice mass. Even accounting for
record such layers in any other of our OPTV image logs, we uncertainty, these reconstructed englacial debris concentrations
observed debris-rich basal ice at the glacier surface near Site 2 are higher than point-based surface measurements made else-
(Supplementary Fig. 8). We therefore interpret facies 3 as layers where on valley glaciers. The concentrations we record also
of debris entrained at the bed and raised into an englacial increase with depth and are highly variable; both these properties
position42. This concurs with observations of faceted and striated have implications for future temporal evolution of surface melt
debris clasts—indicating erosion during former transport at the and debris exhumation. We have identified three material facies
glacier bed26—in the supraglacial debris layer towards the within the glacier and noted evidence for basal debris being
glacier’s terminus. Facies 3 forms only 1.9% of the Site 1 borehole transported towards the surface in the lower ablation area of
ice column (Table 1), which may reflect the glacier’s temperate Khumbu Glacier. These results are important for building models
basal interface in this area33; basal freeze-on of debris-laden of debris-covered glaciers, contributing to the robust representa-
material is more prevalent at cold-based glaciers or at a marginal tion of: (i) englacial debris transfer and deposition; (ii) surface
warm-to-cold transition46. Regardless, the presence of these basal energy balance and future evolution (particularly the develop-
ice layers indicates that not all sediment has been removed from ment of the supraglacial debris layer and its influence on
the glacier bed by meltwater, which is consistent with inferences ablation); and (iii) ice motion, since the occurrence of basal
of minimal subglacial drainage at Khumbu Glacier47. The shearing implies sediment incorporation and sliding upglacier of
glacier’s terminus has previously been interpreted to sit on a the point of initiation. Refinement of these processes in numerical
raised bed of permeable sediment37, which would allow models is necessary to forecast changes in the runoff of high-
percolation of some subglacial meltwater into the groundwater elevation debris-covered glaciers, and to project their impact on
system47 with only minor sediment entrainment. downstream discharge and the water supply to over 300 million
We identify ~14 layers of facies 3 material in the Site 1 OPTV people in the Ganges–Brahmaputra basin8.
image. Consistent with the trend of increasing debris concentra-
tion with depth recorded at Sites 2–4, more of these layers are Methods
located deep in the borehole (Fig. 3): only one layer occurs in the OPTV log acquisition. Boreholes were drilled using pressurised hot water;
uppermost 15 m of the OPTV image log, while ten are present in methods and borehole properties are provided in previous EverDrill
the lowermost ~10 m (Supplementary Fig. 7). The deepest layer is publications28,33. At four sites (Fig. 1), a borehole was logged by an OPTV29: a 360°
high-resolution camera that provides a true-colour, geometrically accurate, con-
~30.21 m from the surface, ~0.06 m above the base of the OPTV tinuous image of the borehole wall. Borehole depths varied from 22–192 m, but the
log, and an estimated 15 m above the glacier bed28. Some of the length of OPTV images was limited by the winch capacity of 150 m. Image logs
layers are closely spaced (e.g., two layers within ~0.02 m, and four begin at ~2 m depth below the surface (Supplementary Table 1), as this is the
layers occur within ~0.74 m) and may be single layers that have length of probe above the camera, and were taken of each borehole in both the
down and up directions (Supplementary Table 1), with minimal notable difference
been subjected to intense deformation and isoclinal folding48, but between these images. The raw up-direction image logs are shown in full in
which would appear as separate layers in OPTV image logs. The Supplementary Figs. 1–4. All image logs were north-orientated and acquired at a
mean dip of all facies 3 layers at Site 1 is 43.0°, with some layers logging speed of ~1 m min−1, yielding a vertical image resolution of ~1 mm per
dipping very steeply: for example, the layer illustrated in Fig. 2g pixel and a round-borehole image width of 1440 pixels29. Borehole diameter varies
with depth, being widest at the surface and narrower at depth; for an estimated
dips upglacier at 74.1°. The depth, location, and angle of these mean diameter of 100 mm, the horizontal image resolution is ~0.22 mm per pixel.
layers is consistent with previous reports of thrusting49, and we
therefore interpret these layers as thrusts, resulting from basal
OPTV log processing. OPTV images for each borehole were collated and
shearing within the glacier’s terminal region. There are several imported for analysis and presentation into WellCAD software. The Site 4 down
mechanisms by which such thrusting could occur at Khumbu log required depth adjustments to match the up log due to the OPTV sonde
Glacier, including: (i) velocity variations at the base of the occasionally becoming stuck on debris protruding from the borehole wall; manual
icefall50, where faster-moving ice departing the icefall is forced raising and lowering to free the sonde resulted in artificial jumps in depth. This did
not affect any other log, including the Site 4 up-direction log.
over slower-moving terminal ice; (ii) velocity variations at
junctions with tributary glaciers51; and (iii) variations in basal
conditions, such as a spatial48 or temporal52 change in thermal OPTV log classification. Englacial debris visible in the OPTV logs was manually
classified in WellCAD into ‘low’, ‘medium’, ‘high’, or ‘very high’ category bands
regime or the presence of a topographic barrier, such as a bedrock (Fig. 2). Debris clasts included in the analysis were bright reflections with sharply
obstacle46, a reverse in bed slope53, or a proglacial debris apron52. defined outlines; patches that appeared to be clasts but were dark in colour and had
We note that our estimates of englacial debris concentration at blurred outlines were assumed to be recessed from the borehole wall and were
Khumbu Glacier (summarised in Table 1) do not include the omitted from all analysis. Automated classification was not possible due to the
variability of debris reflections, the similarity between reflections from some debris
presence of potentially debris-rich basal ice at the glacier bed and drilling artefacts on the borehole wall (Supplementary Fig. 5), and illumination
(below the base of any of our upglacier boreholes at Sites 2–4), differences between the logs. Sections where the borehole wall was obscured across
nor an unknown quantity of spatially discrete, thicker englacial the full image width by turbid water were omitted from the analysis (Supple-
deposits that our hot-water drill was unable to penetrate, as mentary Fig. 5). If only part of the width was obscured, the debris concentration of
the unobscured side was assumed to be representative of the full width. The
occurred at Site 2 (ref. 28). Such layers could be larger mass thickness of each debris concentration band was summed to yield the total length
movement deposits that were buried with the ice54 in the Western of each debris concentration category by borehole.
Cwm or, at Site 2, debris delivered from Changri Shar and
Changri Nup Glaciers (Fig. 1b) before their detachment from Category debris concentrations. Debris concentrations of the medium and high
Khumbu Glacier. It is notable that no such deposits were categories were determined by manually delineating all debris clasts within
intersected during any of the 760 m successfully drilled across all representative samples of each category in BIFAT software56 (Supplementary
sites, nor terminated any boreholes at Sites 1, 3, and 4 (ref. 28). Fig. 6). Seven sample sections of each category were selected from across the four
up-direction logs. The resulting debris area was expressed as a percentage of the
Such debris layers therefore appear to be spatially restricted, section area and averaged for each category, yielding a debris concentration by
consistent with an origin as avalanche and/or rockfall deposits volume of 5.452% for medium (standard deviation 2.6%; standard error 0.98%) and
from valley sidewalls, or as flood-related deposits from tributary 15.36% for high (standard deviation 4.4%; standard error 1.7%). This was not
glacier valleys55. possible for the low and very high categories due to the prevalence of very fine,
dispersed sediment, so these categories were assigned (on the basis of their visual
We have quantified, for the first time, deep englacial debris similarity) ice facies reported from other valley glaciers30,41. The visual appearance
concentrations and the continuous variation of englacial debris of the low category at the glacier surface was most similar to ‘clean glacier ice’,
with depth for a High Mountain Asian debris-covered glacier which has an equivalent debris concentration of 0.0083% by volume; standard
COMMUNICATIONS EARTH & ENVIRONMENT | (2021)2:12 | https://doi.org/10.1038/s43247-020-00070-x | www.nature.com/commsenv 7ARTICLE COMMUNICATIONS EARTH & ENVIRONMENT | https://doi.org/10.1038/s43247-020-00070-x
deviation of 0.0041% by volume30. The visual appearance of the very high category 16. Kääb, A., Berthier, E., Nuth, C., Gardelle, J. & Arnaud, Y. Contrasting patterns
(Supplementary Fig. 8) was most similar to ‘solid facies ice’, which has an of early twenty-first-century glacier mass change in the Himalayas. Nature
equivalent debris concentration of 65% by volume; standard deviation of 79% by 488, 495–498 (2012).
volume30. The debris concentrations of the low and very high categories, from 17. King, O., Bhattacharya, A., Bhambri, R. & Bolch, T. Glacial lakes exacerbate
Hubbard and Sharp30, are means of samples from 11 glaciers in the Western Alps. Himalayan glacier mass loss. Sci. Rep. 9, 1–9 (2019).
All category concentrations are summarised in Table 1. 18. Brun, F. et al. Heterogeneous influence of glacier morphology on the mass
balance variability in High Mountain Asia. J. Geophys. Res. Earth Surf. 124,
Borehole debris concentrations. The mean borehole debris concentration 1331–1345 (2019).
(CBH, %) of the visible length of each borehole (LBH, m) was calculated using 19. Pellicciotti, F. et al. Mass-balance changes of the debris-covered glaciers in the
the debris concentration (Ccat, %) and the total lengths (Lcat, m) of each category Langtang Himal, Nepal, from 1974 to 1999. J. Glaciol. 61, 373–386 (2015).
within each borehole: 20. Kirkbride, M. P. & Warren, C. R. Tasman Glacier, New Zealand: 20th-century
thinning and predicted calving retreat. Glob. Planet. Change 22, 11–28 (1999).
ðClow Llow Þ þ ðCmed Lmed Þ þ ðChigh Lhigh Þ þ ðCVhigh LVhigh Þ 21. Gibson, M. J. et al. Temporal variations in supraglacial debris distribution on
CBH ¼ :
LBH Baltoro Glacier, Karakoram between 2001 and 2012. Geomorphology 295,
572–585 (2017).
The equivalent debris thickness in the borehole (Table 1), i.e., the depth of
22. Kirkbride, M. P. & Deline, P. The formation of supraglacial debris covers by
debris that would remain if the ice column were melted, was calculated by
primary dispersal from transverse englacial debris bands. Earth Surf. Process.
multiplying the mean borehole debris concentration by volume by the visible
Landforms 38, 1779–1792 (2013).
length of the OPTV log. This was extrapolated to the entire ice column at each
borehole location by assuming the debris concentration measured in the borehole 23. Glazyrin, G. E. The formation of ablation moraines as a function of the
was applicable to the rest of the ice column. The mean borehole debris climatological environment. Int. Assoc. Hydrol. Sci. 104, 106–110 (1975).
concentration was multiplied by the estimated ice column thickness (negating the 24. van Woerkom, T., Steiner, J. F., Kraaijenbrink, P. D. A., Miles, E. S. &
unknown depth and debris concentration of any basal ice/debris layers), taken Immerzeel, W. W. Sediment supply from lateral moraines to a debris-covered
from model outputs27 for all borehole locations except for Site 1, where the glacier in the Himalaya. Earth Surf. Dyn. 7, 411–427 (2019).
neighbouring borehole was considered to have reached the bed28,33. Equivalent 25. Nakawo, M., Iwata, S., Watanabe, O. & Yoshida, M. Processes which distribute
supraglacial debris layer thicknesses (from both the borehole ice depth and full ice supraglacial debris on the Khumbu Glacier, Nepal Himalaya. Ann. Glaciol. 8,
column depth) were calculated assuming a bulk effective porosity of 0.33, as 129–131 (1986).
measured on the neighbouring Ngozumpa Glacier, Nepal31. 26. Hambrey, M. J. et al. Sedimentological, geomorphological and dynamic
context of debris-mantled glaciers, Mount Everest (Sagarmatha) region, Nepal.
Quat. Sci. Rev. 28, 1084 (2008).
Data availability 27. Rowan, A. V., Egholm, D. L., Quincey, D. J. & Glasser, N. F. Modelling the
All raw data are available from the UK Polar Data Centre (OPTV images: https://doi.org/ feedbacks between mass balance, ice flow and debris transport to predict the
10.5285/d80f5c86-89a7-46d6-8718-47e3d34ab368; general borehole information: https:// response to climate change of debris-covered glaciers in the Himalaya. Earth
doi.org/10.5285/a7f28dea-64f7-43b5-bc39-a6cfcdeefbda). Englacial debris concentration Planet. Sci. Lett. 430, 427–438 (2015).
datasets are available for download from: https://doi.org/10.6084/m9.figshare.13153340. 28. Miles, K. E. et al. Instruments and methods: hot-water borehole drilling at a
high-elevation debris-covered glacier. J. Glaciol. 65, 882–832 (2019).
Received: 12 June 2020; Accepted: 24 November 2020; 29. Hubbard, B., Roberson, S., Samyn, D. & Merton-Lyn, D. Digital optical
televiewing of ice boreholes. J. Glaciol. 54, 823–830 (2008).
30. Hubbard, B. & Sharp, M. J. Basal ice facies and their formation in the western
Alps. Arct. Alp. Res. 27, 301–310 (1995).
31. Nicholson, L. & Benn, D. I. Properties of natural supraglacial debris in relation
to modelling sub-debris ice ablation. Earth Surf. Process. Landforms 38,
References 490–501 (2013).
1. Huss, M. & Hock, R. Global-scale hydrological response to future glacier mass 32. Hubbard, B. & Glasser, N. F. Field Techniques in Glaciology and Glacial
loss. Nat. Clim. Chang. 8, 135–140 (2018). Geomorphology (Wiley, Chichester, 2005).
2. Immerzeel, W. W., van Beek, L. P. H. & Bierkens, M. F. P. Climate change will 33. Miles, K. E. et al. Polythermal structure of a Himalayan debris-covered glacier
affect the Asian water towers. Science. 328, 1382–1385 (2010). revealed by borehole thermometry. Sci. Rep. 8, 1–9 (2018).
3. Bolch, T. et al. in The Hindu Kush Himalaya Assessment (eds Wester, P., 34. Dowdeswell, J. A. The distribution and character of sediments in a tidewater
Mishra, A., Mukherji, A. & Shrestha, A. B.) 209–255 (Springer, Cham, 2019). glacier, southern Baffin Island, N.W.T., Canada. Arct. Alp. Res. 18, 45–56
4. Pritchard, H. D. Asia’s shrinking glaciers protect large populations from (1986).
drought stress. Nature 569, 649–654 (2019). 35. Bozhinskiy, A. N., Krass, M. S. & Popovnin, V. V. Role of debris cover in the
5. Kraaijenbrink, P. D. A., Bierkens, M. F. P., Lutz, A. F. & Immerzeel, W. W. thermal physics of glaciers. J. Glaciol. 32, 255–266 (1986).
Impact of a global temperature rise of 1.5 degrees Celsius on Asia’s glaciers. 36. Kirkbride, M. P. in Modern and past glacial environments (ed Menzies, J.)
Nature 549, 257–260 (2017). 146–169 (Butterworth-Heinemann, 2002).
6. Hock, R. et al. in IPCC Special Report on the Ocean and Cryosphere in a 37. Barker, A. D. Glaciers, erosion and climate change in the Himalaya and St.
Changing Climate (eds Pörtner, H. O. et al.) 202 (IPCC, 2019). Elias Range, SE Alaska. PhD Thesis, University of Washington (2016).
7. Rounce, D. R., Hock, R. & Shean, D. E. Glacier mass change in High Mountain 38. Banerjee, A. & Wani, B. A. Exponentially decreasing erosion rates protect the
Asia through 2100 using the open-source Python Glacier Evolution Model high-elevation crests of the Himalaya. Earth Planet. Sci. Lett. 497, 22–28
(PyGEM). Front. Earth Sci. 7, 1–20 (2020). (2018).
8. Immerzeel, W. W. et al. Importance and vulnerability of the world’s water 39. Gades, A., Conway, H., Nereson, N., Naito, N. & Kadota, T. in Debris-Covered
towers. Nature 577, 364–369 (2020). Glaciers, Vol. 264 (eds Nakawo, M., Raymond, C. F. & Fountain, A.) 13–22
9. Østrem, G. Ice melting under a thin layer of moraine, and the existence of ice (International Association of Hydrological Sciences, 2000).
cores in moraine ridges. Geogr. Ann. 41, 228–230 (1959). 40. Goodsell, B., Hambrey, M. J. & Glasser, N. F. Formation of band ogives and
10. Kayastha, R. B., Takeuchi, Y., Nakawo, M. & Ageta, Y. in Debris-Covered associated structures at Bas Glacier d’Arolla, Valais, Switzerland. J. Glaciol. 48,
Glaciers (eds Nakawo, M., Raymond, C. F. & Fountain, A.) 71–81 287–300 (2002).
(International Association of Hydrological Sciences, 2000). 41. Hubbard, B., Cook, S. & Coulson, H. Basal ice facies: a review and unifying
11. Nicholson, L. & Benn, D. I. Calculating ice melt beneath a debris layer using approach. Quat. Sci. Rev. 28, 1956–1969 (2009).
meteorological data. J. Glaciol. 52, 463–470 (2006). 42. Hambrey, M. J., Bennett, M. R., Dowdeswell, J. A., Glasser, N. F. & Huddart,
12. Collier, E. et al. Representing moisture fluxes and phase changes in D. Debris entrainment and transfer in polythermal valley glaciers. J. Glaciol.
glacier debris cover using a reservoir approach. Cryosph. 8, 1429–1444 45, 69–86 (1999).
(2014). 43. Scherler, D. Climatic limits to headwall retreat in the Khumbu Himalaya,
13. Fyffe, C. L. et al. Processes at the margins of supraglacial debris cover: eastern Nepal. Geology 42, 1019–1022 (2014).
quantifying dirty ice ablation and debris redistribution. Earth Surf. Process. 44. Nagai, H., Fujita, K., Nuimura, T. & Sakai, A. Southwest-facing slopes control
Landforms 45, 2272–2290 (2020). the formation of debris-covered glaciers in the Bhutan Himalaya. Cryosph. 7,
14. Anderson, L. S. & Anderson, R. S. Modeling debris-covered glaciers: Response 1303–1314 (2013).
to steady debris deposition. Cryosphere 10, 1105–1124 (2016). 45. Regmi, D. & Watanabe, T. Short communication: rockfall activity in the
15. Gardelle, J., Berthier, E. & Arnaud, Y. Slight mass gain of Karakoram glaciers Kanchenjunga Area, Nepal Himalaya. Permafr. Periglac. Process. 20, 390–398
in the early twenty-first century. Nat. Geosci. 5, 322–325 (2012). (2009).
8 COMMUNICATIONS EARTH & ENVIRONMENT | (2021)2:12 | https://doi.org/10.1038/s43247-020-00070-x | www.nature.com/commsenvCOMMUNICATIONS EARTH & ENVIRONMENT | https://doi.org/10.1038/s43247-020-00070-x ARTICLE
46. Boulton, G. S. On the origin and transport of englacial debris in Svalbard and Sheffield (NE/P00265X). K.E.M. was funded by an AberDoc PhD Scholarship
glaciers. J. Glaciol. 9, 461–465 (1970). (Aberystwyth University). J.H. is funded by a UK Natural Environment Research Council
47. Miles, K. E. et al. Surface and subsurface hydrology of debris-covered Khumbu PhD studentship (NE/L002450/1). We thank Himalayan Research Expeditions for
Glacier, Nepal, revealed by dye tracing. Earth Planet. Sci. Lett. 513, 176–186 organising the logistics that supported fieldwork in Nepal in 2017 and 2018, and in
(2019). particular Mahesh Magar for guiding, navigation, and fieldwork assistance. We
48. Hambrey, M. J. & Huddart, D. Englacial and proglacial glaciotectonic acknowledge the support of the Sagarmatha National Park and their assistance with
processes at the snout of a thermally complex glacier in Svalbard. J. Quat. Sci. permitting.
10, 313–326 (1995).
49. Hambrey, M. J., Dowdeswell, J. A., Murrav, T. & Porter, P. R. Thrusting and
debris entrainment in a surging glacier: Bakaninbreen, Svalbard. Ann. Glaciol.
Author contributions
D.J.Q. conceived of and led, and B.H. and A.V.R. co-led, the EverDrill project. B.H. led
22, 241–X8 (1996).
the hot-water drilling, to which K.E.M., D.J.Q., and E.S.M. contributed. B.H. and K.E.M.
50. Fushimi, H. Structural studies of glaciers in the Khumbu region. Seppyo 39,
carried out the OPTV logging. K.E.M. processed the data and wrote the manuscript.
30–39 (1977).
K.E.M., B.H., E.S.M., D.J.Q., A.V.R., M.K., and J.H. contributed to the data analysis and
51. Hewitt, K. Tributary glacier surges: an exceptional concentration at Panmah
editing of the manuscript.
Glacier, Karakoram Himalaya. J. Glaciol. 53, 181–188 (2007).
52. Evans, D. J. A. Apron entrainment at the margins of sub-polar glaciers, north-
west Ellesmere Island, Canadian High Arctic. J. Glaciol. 35, 317–324 (1989). Competing interests
53. Glasser, N. F. & Hambrey, M. J. Sedimentary facies and landform genesis at a The authors declare no competing interests.
temperate outlet glacier: Soler glacier, North Patagonian Icefield.
Sedimentology 49, 43–64 (2002).
54. Dunning, S. A., Rosser, N. J., Mccoll, S. T. & Reznichenko, N. V. Rapid Additional information
sequestration of rock avalanche deposits within glaciers. Nat. Commun. 6, 1–7 Supplementary information is available for this paper at https://doi.org/10.1038/s43247-
(2015). 020-00070-x.
55. Miles, E. S. et al. Glacial and geomorphic effects of a supraglacial lake drainage
and outburst event. Nepal Himalaya. Cryosph. 12, 3891–3905 (2018). Correspondence and requests for materials should be addressed to K.E.M.
56. Malone, T., Hubbard, B., Merton-Lyn, D., Worthington, P. & Zwiggelaar, R.
Borehole and Ice Feature Annotation Tool (BIFAT): a program for the Peer review information Primary handling editors: Heike Langenberg.
automatic and manual annotation of glacier borehole images. Comput. Geosci.
51, 381–389 (2013). Reprints and permission information is available at http://www.nature.com/reprints
57. Noh, M. J. & Howat, I. M. Automated stereo-photogrammetric DEM
generation at high latitudes: surface Extraction from TIN-Based Search Publisher’s note Springer Nature remains neutral with regard to jurisdictional claims in
Minimization (SETSM) validation and demonstration over glaciated regions. published maps and institutional affiliations.
GIScience Remote Sens. 52, 198–217 (2015).
58. Hubbard, B., Miles, K. E., Quincey, D. J. & Miles, E. S. Summary of
instrumentation installed in boreholes drilled into Khumbu Glacier, Nepal, in Open Access This article is licensed under a Creative Commons
2017 and 2018 as part of EverDrill research project [Data set]. UK Polar Data Attribution 4.0 International License, which permits use, sharing,
Centre, Nat. Environ. Res. Counc. UK Res. Innov. https://doi.org/10.5285/ adaptation, distribution and reproduction in any medium or format, as long as you give
a7f28dea-64f7-43b5-bc39-a6cfcdeefbda (2019). appropriate credit to the original author(s) and the source, provide a link to the Creative
59. Hubbard, B., Miles, K. E. & Quincey, D. J. Borehole optical televiewer (OPTV) Commons license, and indicate if changes were made. The images or other third party
logs of boreholes drilled into Khumbu Glacier, Nepal, in 2017 and 2018 as part material in this article are included in the article’s Creative Commons license, unless
of EverDrill research project. UK Polar Data Centre, Nat. Environ. Res. Counc. indicated otherwise in a credit line to the material. If material is not included in the
UK Res. Innov. https://doi.org/10.5285/d80f5c86-89a7-46d6-8718-47e3d34ab368 article’s Creative Commons license and your intended use is not permitted by statutory
(2019). regulation or exceeds the permitted use, you will need to obtain permission directly from
the copyright holder. To view a copy of this license, visit http://creativecommons.org/
licenses/by/4.0/.
Acknowledgements
This research was supported by the ‘EverDrill’ Natural Environment Research Council
Grant awarded to Aberystwyth University (NE/P002021), and the Universities of Leeds © The Author(s) 2021
COMMUNICATIONS EARTH & ENVIRONMENT | (2021)2:12 | https://doi.org/10.1038/s43247-020-00070-x | www.nature.com/commsenv 9You can also read