EXHIBITION PARK DEVELOPMENT PLAN - Prepared for City of Lethbridge Capital Improvement Program 2014-2023
←
→
Page content transcription
If your browser does not render page correctly, please read the page content below
Trade & Convention Centre

   EXHIBITION PARK DEVELOPMENT PLAN
         Prepared for City of Lethbridge
    Capital Improvement Program 2014-2023

Agriplex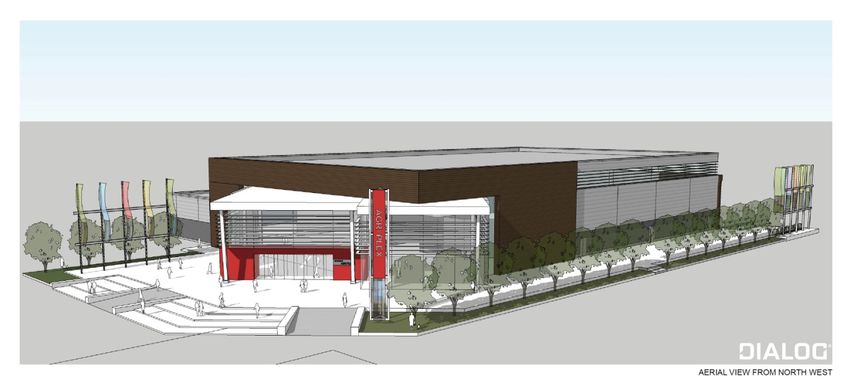
ACKNOWLEDGEMENTS
We would like to thank all those who were involved in this development plan process. There
were hundreds of hours spent by volunteers who generously contributed their time, passion and
expertise to this plan.

We would also like to thank all the hundreds of shareholders, stakeholders, employees and
residents involved in creating a development plan that is truly one that belongs not just to
Exhibition Park but to the community it serves.

Joint Committee Members (2009-2013):
Don Young, President, Lethbridge & District Exhibition
Gord Scheurman, Past President, Lethbridge & District Exhibition
Andy Cumming, 1st Vice President, Lethbridge & District Exhibition
Dennis Carrier, Director, Lethbridge & District Exhibition
Herman Elfring, Director, Lethbridge & District Exhibition
Tom Wickersham, Alderman, City of Lethbridge
Joe Mauro, Alderman, City of Lethbridge
Henry Doeve, County of Lethbridge, Councillor
Bruce Galts, Team Lethbridge Member
Dennis Chinner, Past President, Chamber of Commerce
Randy Tremel, Past President, Chamber of Commerce
Bary Beck, Director of Community Services, City of Lethbridge
Rudy Friesen, General Manager, Exhibition Park

Sub-Committee Members (2011-2013)
Dwayne Stratton, President Lethbridge Lodging Association
Bruce Primeau, Past President Lethbridge Lodging Association
Nikolaus Wyslouzil, General Manager, Chinook Country Tourist Association
Jaylene Ulmer, Economic Development Lethbridge

2013 Board of Directors Lethbridge & District Exhibition (not already mentioned)
Mike Davis, Director 2nd Vice President
Kai Yip, Director
Bob Simonton, Director
Ken Benson, Director
Hazel Hart, Director
Max Gibb, Director
Rick Neudorf, Director
Bev Lanz, Director
Lorne Hickey, Reeve, County of Lethbridge

Exhibition Park Staff
Bridget Mearns, Development Coordinator
Bryan Litchfield, Manager of Operations and Facilities
Bruce Larson, Controller
Doug Kryzanowski, Manager Corporate Relations, Events, Entertainment and Marketing
Diana DiRocco, Executive Assistant

City Of Lethbridge
City of Lethbridge employees who worked with on this project from infrastructure, transportation
and specifically Sam Conrad who led us through the CBA process.

                                                                                          Page 2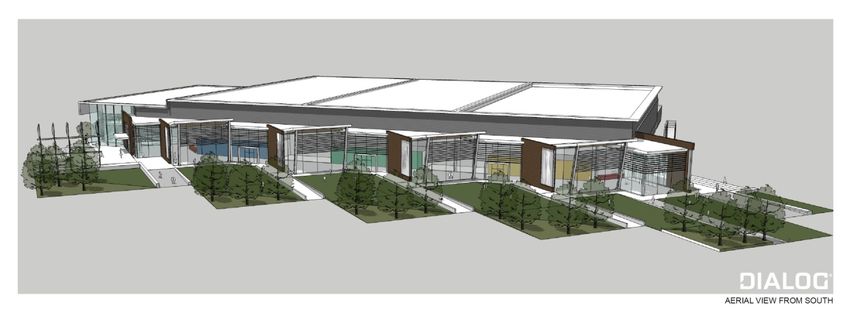
Consulting Team
David Woodman and Alex Whitehouse, MNP (Business Case Consultants),
Blair Grier, Mission Beach Developments (Engineer Consultant)
Mike McCready, Scott Construction (Engineer Consultant),
Jim Goodwin, Dialog (Building and Site Design Consultants),

                                                                      Page 3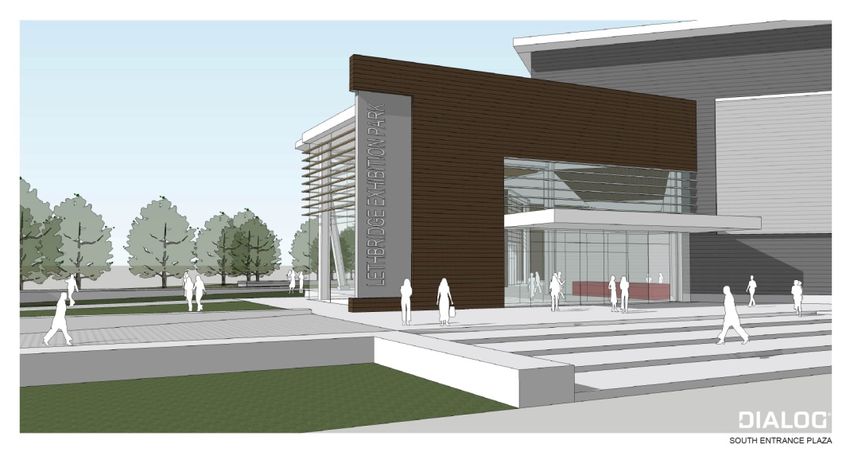
CONTENTS
                                                                     PAGE
   1. Background                                                     5

   2. Executive Summary                                              7

   3. Needs Assessment & Market Research                             9

   4. Site Plan & Design Principles                                  11

   5. Capital Cost Estimates                                         16

   6. Business Case                                                  18

   7. Economic Implications of Development                           22

   8. Capital Funding & Financing Strategy                           23

   9. Community Support                                              25

Appendix A: Concept Drawings - Dialog
Appendix B: Scope of Work Assumptions – Mission Beach Developments
Appendix C: Projected Revenue Sources – MNP
Appendix D: Statement of Estimated Revenues, Expenses and Net Operating Income –
MNP
Appendix E: Letters of Support
Appendix F: Petition

                                                                            Page 4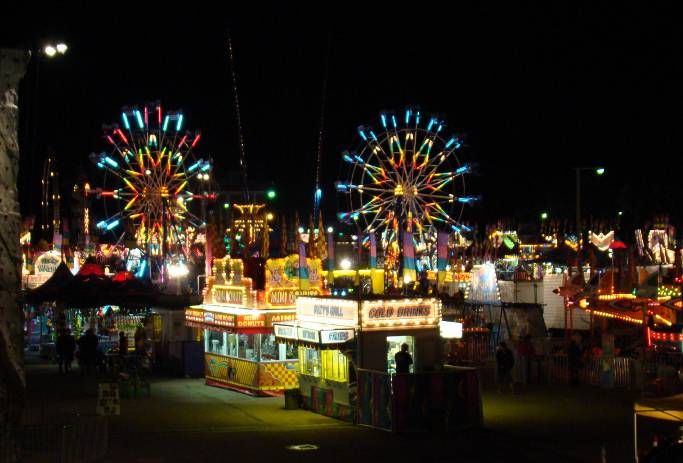
1. BACKGROUND
                                                       For more than 115 years, the Lethbridge
                                                       & District Exhibition has provided
                                                       programming and facilities focused on
                                                       agricultural, social, entertainment, cultural
                                                       and economic needs of Lethbridge and
                                                       Southern Alberta. Over this time the
                                                       population of the area has increased
                                                       dramatically      and       facilities   and
                                                       programming have been added at
                                                       Exhibition Park to keep pace.

                                                       Mission Statement
                                                       Exhibition Park exists within its means, to
                                                       provide the people of Lethbridge &
District with an agricultural and community gathering place at which to participate in events,
conduct business, learn and be entertained.

At present, Exhibition Park has a significant impact, both socially and economically, on the city
of Lethbridge and its surrounding areas. It serves a growing market area of 280,000, including
the 89,074 residents of the Lethbridge. There was a total of 1574 rental days in 2012. More
than 452 companies rented the facilities last year. Overall attendance at these events amounted
                                                      to more than 850,000 visitors. A 2005
                                                      study of the economic and community
                                                      benefits of Exhibition Park showed the
                                                      activities conducted at Exhibition Park
                                                      contributed to economic stimulation of
                                                      almost $82 million annually.

                                                      Pursuing a mandate focused on economic
                                                      development, community development
                                                      and entertainment, and agriculture,
                                                      Exhibition Park has consistently involved
                                                      other       community   and       regional
                                                      organizations and stakeholders in building
                                                      its direction.

Existing Facilities
With the exception of the newer Main Pavilion, the facilities range in age from 25 to 87 years
and average 51 years old.

Heritage Hall built in 1926 (9,000 sq ft - 87 yrs)
South Pavilion 1961 (31,700 sq ft - 52 yrs)
North Pavilion 1971 (34,500 sq ft - 42 yrs)
West Pavilion 1988 (17,00 sq ft - 25 yrs)
Main Pavilion 2000 (28,910 sq ft - 13 yrs)

The facilities are used for many purposes, including community events (Whoop Up Days,
Children’s Festival), trade shows (Home & Garden, Outdoor Adventure Show), consumer shows
(RV & Auto Shows), large gatherings (Rotary Lobsterfest, Family Fest), and agricultural sales
and events (eg. Ag Expo, 4H programming).

                                                                                            Page 5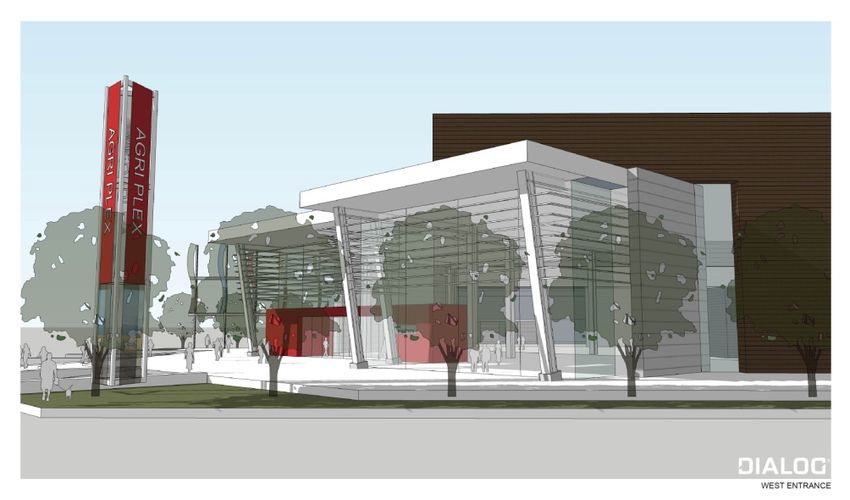
This development plan represents 3 years of comprehensive work by a Joint Committee made
of members of City Council, Lethbridge & District Exhibition Board of Directors, Chamber of
Commerce, County of Lethbridge and members from stakeholder organizations.

The Joint Committee worked through a number of steps to ensure that this plan was
comprehensive, methodical and responsive to community and market demands. They
completed a financial review of Exhibition Park Operations, Facility Condition Audit of all
buildings, Market & Needs assessment, Choosing By Advantages workshop in addition to a
multiple accounts evaluation framework study conducted by MNP to arrive at the current site as
the preferred site for development.

The Financial Review revealed the law of diminishing returns, inability to grow shows and
inability to generate incremental revenue due to functional and conditional constraints. The
Facility Condition Audit, performed by MPE Engineering, indicated that facilities of EP are
reaching the end of their life cycle, aging rapidly and require replacement. The Choosing By
Advantages process identified 2 options (rebuild on current site and green site) as having
‘equivalent’ benefit & cost profiles. Finally the Multiple Accounts Evaluation Framework, when all
accounts, and the risks associated with the project as a whole were considered, it determined
there was not enough compelling incremental economic impact and benefit to support the
relocation to a greenfield site and concluded that the current site remains the preferred site for
the renewed EP facilities.

   “Gas King has been a proud corporate sponsor of Exhibition Park for over 10
   years and knows firsthand the benefits of Exhibition Park programming.”
   Brent Morris, President

                                                                                           Page 6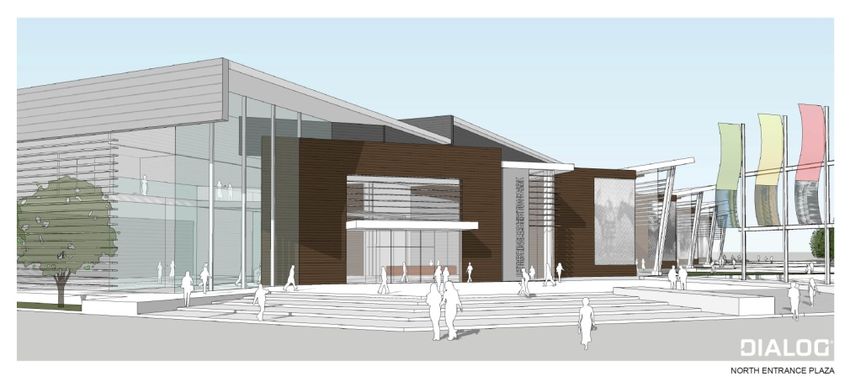
2. EXECUTIVE SUMMARY
The vision laid out in this development plan takes into consideration input from over 15 years of
market research and community needs assessments and studies and 3 years of methodical
work on the part of a Joint Committee made up of dedicated community volunteers and
Exhibition Park staff. This document will not go into every detail of that research and assumes
the reader is aware of the infrastructure, functional and condition restraints of the current
facilities. This plan will focus on how the research and input was used to create the facility
designs, site plan, business case as well as demonstrating current community support to have
the development of Exhibition Park identified as a capital priority and funded in The City of
Lethbridge Capital Improvement Program 2014-2023.

Along with previous market research, in 2012 the Joint Committee conducted a facilities tour of
exhibitions Prairieland Park in Saskatoon and Westerner Park in Red Deer. These tours were
invaluable in assisting the Joint Committee and consultants in ensuring that the facilities designs
were building on their successes and challenges.

The facilities and site designs are based on design principles determined by the community and
market demand research. The trade and convention centre will have 172,000 square feet of
connected open span space with a minimum height of 30-40 feet and large bay loading doors.
In addition, it will have 25,000 sq ft higher finished meeting and banquet space. On site will be
an industrial kitchen to provide for in-house catering service. The design takes advantage of the
views of Henderson Lake. The floor plan is designed with moveable partitions to maximize the
space to accommodate multiple rentals and multiple configurations. The Trade and Convention
Centre will also have break out rooms each equipped with audio/visual equipment.

The site is designed to allow for current operations to continue while Phase one is being built
minimizing the disruption to Exhibition Park programming and clients. The relocation of Pioneer
Park to the former Henderson campground site allows for a continuation of outdoor festival
space and programming. A site survey and a geotechnical evaluation were done to ensure that
the facilities could be accommodated on the site.

Phase two is a 75,000 sq ft agriplex allowing for dedicated livestock programming. This type of
programming is currently not being well served under the current facilities, as dirt is brought in
and out of the pavilions at a significant cost.

This development plan is supported by a realistic and industry vetted business case with
revenue and expense analysis which forecasts a positive sustainable net operating income.
The new facilities will generate 3 sources of income – existing, enhanced and incremental. The
business case is a conservative financial model that plans for the operational and maintenance
costs to be borne by Lethbridge & District Exhibition. This plan will have no ongoing pressure
on the City of Lethbridge operating budget, and by leveraging the expected positive net
operating income, Lethbridge & District Exhibition will also be in a position to support the debt
servicing requirement of the project.

The funding strategy anticipates using capital grants from Municipal, Provincial and Federal
capital programs, potential reallocating of current CIP funding, corporate and community
sponsorship in addition to Exhibition Park’s ability to invest in the plan through financing and
reinvestment of a capital asset (land in SE Lethbridge) and through their capital reserves.

Further to the community at large, shareholders, stakeholders and industry guiding the vision
and design of the facilities and site, the development plan has been shared with our community
at large through community presentations, open houses, and public displays. Community
support has been strong. The benefits of this development are far reaching from the direct and
                                                                                            Page 7
indirect economic benefits to organizations, to being able to host regional conventions and
events, to a better visitor experience at Exhibition Park. This is evidenced by the 32 letters of
support from a variety of different private and public sector organizations and a petition signed
by 638 citizens.
An investment in exhibition infrastructure is made because of the economic and social benefits
that accrue to the community from its use. While benefits exist in several areas, these benefits
result significantly from spending in the community by attendees in connection with events
staged at the facilities. Increased availability of exhibition space is expected to lead to increased
attendance, notably by visitors to the community, more entertainment and other events that
benefit the local population, and increased awareness and profile for the community.
Exhibition Park development will provide positive and significant short and long term economic
impacts and implications for Lethbridge and region. The impact is illustrated in the tables below.
Note not included in these numbers are the economic impact of the events specifically. For
example, 2010 Whoop-Up Days generated $5,282,082 in total demand side economic
spending.
Direct & Indirect Economic
Benefit (Lethbridge & Provincial & Federal Tax
region) FTE Revenue
During Construction
(2015-2018) $ 70,000,000 750 $ 21,000,000
Direct & Indirect Economic
Benefit (on incremental Provincial & Federal Tax
portion) FTE Revenue
At Steady State (over
10 year period, 2020-
2030) $ 30,000,000 700 $ 10,000,000
The addition of convention centre facilities in the development plan is a game changer for
Lethbridge. It will bring convention business to Lethbridge that it is currently not attracting
because the appropriate facilities do not exist- specifically the ability to accommodate a
tradeshow, breakout rooms and banquet space under one roof. The economic impact of a
convention centre in the local, regional, and provincial economics are significant and should be
recognized when evaluating the need for such facilities.
Many single purpose convention facilities in Canada and North America operate with an annual
net operating loss. The Lethbridge & District Exhibition are proposing a multi-purpose
convention tradeshow and exhibition facility that has been purposely configured to allow for
maximum profitable capacity utilization, allowing different community and other programming to
occur simultaneously within the complex.
Adding exhibition infrastructure is adding community infrastructure. As municipalities grapple
with increasing operating cost pressures partnerships such as the one between Exhibition Park
and the City of Lethbridge are all the more relevant. As a Not-For-Profit Society (whose
mandate is focused on community benefits and 115 year history of operating Exhibition facilities
and programing) it is appropriate for Lethbridge & District Exhibition to facilitate this
development.
Page 83. NEEDS ASSESSMENT & MARKET RESEARCH
The Development Plan and Design Concepts are based on years of market research and
community needs assessments. Below is not a comprehensive summary of all the documents
but rather a snap shot of the main themes.
Existing Client
Facility Condition audit performed by MPE Engineering indicated that facilities of EP are
reaching the end of their life cycle, are aging rapidly and require replacement. Community and
Exhibitor needs assessment conducted showed that needs of the community and other users
are changing, evolving beyond the capability of the existing facilities, regardless of condition.
Analysis shows that the capacity and state of the facilities at Exhibition Park limits growth on
existing programming and rental demand. The facilities cannot accommodate growth that would
result in new revenue and in fact, they are limiting the growth of the tenants. However, demand
continues to grow. Ag Expo and Home & Garden Tradeshow both have a waiting list for
Exhibitors and have for 10+ years. This is not only lost revenue to Exhibition Park but the direct
and indirect spin off benefits are lost to the city.
“Southern Alberta is a livestock and agricultural hub and is world class. We
should be seen as that and have more events, meetings and trade shows down
here but we don’t have the facilities to properly accommodate.”
Ag Expo Exhibitor
Despite the condition and function of the current facilities, it should also be noted that Exhibition
Park is considered an important community gathering place for its residents and vital economic
generator for local business.
“This facility is the heart of our city and broader Community.”
Rick Casson, Former MP Lethbridge
Convention and Meeting Space
As early as 1999 it was identified in the City of Lethbridge report Fixed Roof
Accommodation/Convention and Exhibition Space Analysis by PwC (Price Waterhouse
Coopers) that Lethbridge was unable to effectively compete with other comparable destinations
due to the limited range of facilities and infrastructure required to support the needs of various
meeting/convention and exhibition groups.
Increasingly conventions are both conferences and trade shows. Event organizers often use
such events to build revenue for their organization from trade show exhibitor fees. As evidenced
by the feedback letter from the recent Lethbridge Chamber of Commerce National AGM bid,
“Based on the proposal, as delegates would not be in the same venue as the Expo, exhibitors
would have far less exposure, making the Expo less appealing to potential exhibitors and
contributing to a loss of revenue for us.” Marley Ransom, Event Planner, The Canadian
Chamber of Commerce (2012)
“As the city grows, the need for superior convention and trade show space also
grows. If Lethbridge wants to be seen as a vibrant city and the place to live,
greater care needs to be afforded resources like Exhibition Park. ”
Lethbridge Chamber of Commerce, Member
Page 9In 2012 the Joint Committee toured Prairieland Park in Saskatoon and Westerner Park in Red
Deer. The executives at these two facilities confirmed much of what the research had already
determined. Some key “take aways” were that demand for meeting space and breakout rooms
continues to increase; there is value in providing in-house catering to be able to control cost and
quality of food services; it is important to have separate agricultural space; and vital to have the
ability to maximize the square footage to accommodate a variety of needs.
The market and needs assessment research conclusively determines that
Exhibition Park is vital part of the City’s economic and social health of Lethbridge
Condition and function of current Exhibition Park is not meeting current demands of the
community
Community (residents, businesses and stakeholders) of Lethbridge support a long term
solution for EP and there is some impatience for the planning to begin
To attract conventions to Lethbridge we must have facilities that can accommodate
tradeshow, banquet & meeting spaces under one roof
Demand for meeting space in Lethbridge is unmet and growing
Below are some of the studies and documents considered in this development plan:
1999 – Fixed Roof Convention & Exhibition Space Analysis – City of Lethbridge by
PriceWaterhouse Coopers PwC
2004 – Community Needs Analysis – Lethbridge College Student Research Study
2005-2006 – Embrace the Challenge – Manecon Business Strategies - Market Analysis
and opportunities, Demand for Facilities and Marketing
2006 – Reputation/Brand Audit – Kick Creative Group Inc.
2006 – Facility Market Study - Manecon Business Strategies
2007 – Brand Audit Tracking Study – Kick Creative Group
2008 – Economic, Social & Educational Benefits Study (2008 Whoop-Up Days) –
Enigma Research Corp.
2009 - Facilities Condition Audit - MPE Engineering
2010 – Extracted Demand-Side Economic Impact Reporting (2010 Whoop-Up Days)–
EventCorp Services Inc.
2011 – Choosing By Advantages workshop on site location (City of Lethbridge)
2009-2010 – Multiple user group needs assessment (presentations to Joint Committee)
2009-2010 – Exhibitor, Chamber members, and Community survey
2011 – Multiple Accounts Evaluation Framework Study – Meyers Norris Penny (MNP)
2011- Industry and stakeholder interviews - Meyers Norris Penny (MNP)
2011 – Within Reach – Strategic Direction for Alberta Agricultural Societies - Manecon
Business Strategies
2012 - Exhibition Park Site Survey – Mike Spencer Geometrics
2012 – Geotechnical Evaluation of Exhibition Grounds – EBA Engineering Consultants
2012 – Facility Site Tours and Facilities Comparison (Exhibition Park, Saskatoon
Prairieland & Red Deer Westerner Park)
Any of the above reports will be available upon request.
“As the province of Alberta moves to diversify its economy, it is expected tourism will
play a major role. The many programs and service provide by the Lethbridge
Exhibition Park now and in the future will impact not only the economic environment
but have a significant impact on the quality of life for individuals in the Lethbridge
region.”
Wynn McLean, Travel Alberta
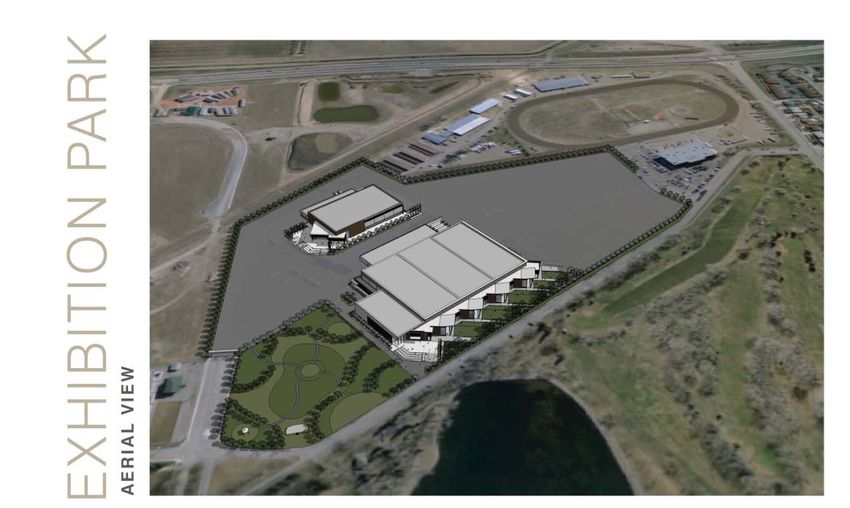
Page 104. SITE PLAN AND DESIGN PRINCIPLES
Gateway Entry
The Conceptual Design incorporates two gateways into Exhibition Park. The North Gateway
entry will be utilized as the primary front entry to the Park, while the South Gateway will provide
secondary vehicular access.
Main Boulevard
The main boulevard street that links the relocated Pioneer Park to the north, with the South
Gateway will provide a perimeter, tailored edge to Henderson Lake to the west. The boulevard
will segregate vehicular and pedestrian traffic.
The entrances to the Trade and Convention Centre will be located adjacent to, and parallel with
this street and take advantage of the elevation change between the Exhibition Park and
Henderson Lake.
Edge Conditions
The Conceptual Plan recognizes the North Edge condition by the relocation of Pioneer Park to
act as a green buffer between the Exhibition Park and the community of Henderson Lake. The
south and east edges of the Park will incorporate perimeter landscaped fencing and treatments.
Phasing
Phase 1 will included construction of the Trade and Convention Centre and associated support
services for this building. The Centre can be constructed while the Pavilion buildings continue to
operate. Phase 2 includes the construction of the Agriplex, once work has been completed on
TCC. It will be able to accommodate some interim function of the Agriplex, during its
construction.
Page 11Parking
Parking is distributed to the north and south portions of the site, albeit not evenly. A traffic
demand assessment will be required to determine the best method to handle parking on the
LEP site.
Pioneer Park
Pioneer Park (former location of Henderson Lake Campground) will be green festival space
where outdoor festivals, concerts, barbeques and community events will be held. The
Recreation and Culture Master Plan presented to the City of Lethbridge identified a need for
more outdoor festival space.
A geotechnical study and site survey of the property have been completed.
Trade & Convention Centre (TCC) 250,000 sq ft Phase 1
The TCC building is planned on a regular structural grid and orientated so that pre-function
spaces are facing west to take advantage of the views to Henderson Lake, and south to reduce
the amount of solar shading required. The south orientation of the saw-tooth design enhances
the ability of the building design to respond to solar heat gain through passive building
strategies including solar shading devices and solar harvesting.
The higher finished meeting space is located at the north side of the building to provide an
animated façade to the community to the north. It will also provide an urban edge to Pioneer
Park. This would be a two story structure. The space will take advantage of local and distant
views into Pioneer Park and Henderson Lake through the extensive use of glazing, where
possible.
Access and circulation
The linear, pre-function space of the building parallels the main boulevard street. A series of
storefront entrances are located along this spine, so that separate entrances can be established
during multiple events.
The linear spine (pre-function space) will also feature primary north and south entrances, in
addition to the multiple entrances described above.
The Convention Centre will be accessed via the North Gateway. The northeast entrance of the
building will serve as a passenger/dignitary pickup/drop-off area.
Page 12Back of House functions will be accessed from the east side of the building in order to
segregate pedestrian traffic from vehicular functions.
Stepped plazas will be
established on the west
side of the building, to
take advantage of the
elevation change between
the building and
Henderson Lake. Ramps
will be provided for the
disabled at all entrances.
Indoor open span connected tradeshow space 172,000 sq ft
Kitchen 8,000 sq ft (capable of hosting 2000 hot meals per seating)
Meeting & Convention Space 25,000 sq ft
Administration 5,000 sq ft
Storage, maintenance & mechanical 30,000 sq ft
Lobby & Common Areas 10,000 sq ft
The Exhibition hall, or tradeshow space, is open span connected space which can be sub-
dividable into numerous configurations based upon the final structural module. The structural
module will be selected to enhance functionality, flexibility, buildability and cost. The ceiling
height would be 30-40 feet with oversized bay doors to accommodate large equipment &
displays.
4-5 Break out rooms are located inside the open span space and designed in a way to also
allow for size and function flexibility. Each breakout room would have system controls and
Page 13audio/visual equipment. They can be accessed from the pre-function space or from within the
tradeshow space.
The facility also has an 8,000 sq ft industrial kitchen to provide in-house catering. This is key in
providing the client with “one billing” system, but also in controlling the cost and quality of food
services. The kitchen will be capable of serving 2000 hot meals per seating.
The Trade and Convention Centre will have the capacity for expansion to the south. Phase 1
will be designed to allow for limited disruption to EP activities during this construction.
AGRIPLEX 75,000 sq ft Phase 2
The Agriplex is located on the north side of Exhibition Park to provide a presence to the
community to the north. It also continues the edge of the TCC/Pioneer Park interface. The
Agriplex building is also planned on a regular structural grid and orientated orthogonally with the
TCC. Pre-function spaces are located to the southwest, so that they are visually accessible from
adjacent Parking areas. Similar to the TCC, the south orientation of the saw-tooth design
enhances the solar strategies.
The Agriplex will be accessed via the North Gateway. The southeast entrance of the building
will serve as a passenger/dignitary pickup/drop-off area. The pre-function/entry space of this
building is orientated to the south west for easy access from the south portion of the TCC.
Back of House functions such as loading and storage will be accessed from the east side of the
building in order to segregate pedestrian traffic from vehicular and livestock functions.
Similar to the TCC the structural module will be selected to enhance functionality, flexibility,
buildability and cost.
Page 14 100 x 200 sq ft dirt floor arena
150 to 175 livestock pens
12 to 15 livestock wash bays
Seating for 1,000 to 1,500
Plus a concession, gallery
space, show office etc.
Agriplex will be built after the
transition to the TCC and demolition
of the current facilities. The facility will
be designed to allow for future
expansion.
Refer to Appendix A for single page concept drawings – Dialog
Refer to Appendix B for the scope of work assumptions detail – Mission Beach Developments
Page 155. CAPITAL COST ESTIMATES
Capital cost estimates for development plan have evolved over the past 3 years, and reflect
Exhibition Park’s best estimate of capital construction costs in the Lethbridge region, based on
commonly accepted construction practices, validated by assessing similar costs on recent
projects completed in Alberta and Canada and reflecting common construction methods that
would be employed by a regional commercial/industrial contractor.
Construction cost estimates for the proposed site development and facilities replacement at
Exhibition Park were prepared based on the concept drawings. The capital cost estimates
reflect an expectation of overall per unit cost at 2012, and capital cost estimates have been
made at an AACE Class “3” level.
Class 3 estimates are prepared to form the basis for budget authorization, appropriation, and/or
funding. Class 3 estimates are used as the project budget until replaced by more detailed
estimates. The figures used can be presumed to be approximately +20%/-10% accurate.
Applicable taxes, such as GST have not been included in the capital cost estimate calculation
that follows.
The following table provides a summary of the construction cost estimates:
Gross
Facility Component Total Estimated Cost
Area Sq Ft
Phase 1 Construction 250,000 $62,651,000
Phase 2 Construction 75,000 $15,680,200
Construction Work Total 325,000 $78,331,000
Furniture, Fixtures & Equipment $ 1,500,000
Site Development Costs $11,000,000
Total Cost $90,831,200
Assumptions
• Costs to expand and renovate Exhibition Park were prepared by Mission Beach
Development and based on unit costs ranging from $183/ft2 to $305/ft2.,depending on the
nature and type of construction being done. All construction and other capital costs
have been based on 2012 dollars.
• An allowance for ‘soft costs’ has been included in each cost component noted above,
estimated at approx. $4.5M. Soft costs include:
o Design engineering, project site management
o Other consulting, legal, etc.
o Contingency
• Site development/infrastructure estimates only include costs to be incurred within the
Exhibition Park property line. Exhibition Park anticipates that City projects already
underway will be able to address external infrastructure requirements.
Page 16It is anticipated that the project will require 4 - 5 years to complete. Table below provides a
preliminary assessment of the construction cash flows over the period 2013 to 2018:
Preliminary Construction Cash Flow Assessment - Lethbridge Exhibition Facility Redevelopment
Activity 2013 2014 2015 2016 2017 2018 TOTALS
Detailed Design / Tendering $500,000 $3,230,000 $500,000 $500,000 $4,730,000
Site Prep & U/G Infrastructure $3,600,000 $2,280,000 $500,000 $2,700,000 $1,032,500 $10,112,500
Phase 1 Construction $28,000,000 $22,503,000 $50,503,000
Phase 2 Construction $13,197,000 $13,197,000
Phase 1 FF&E $1,200,000 $1,200,000
Phase 2 FF&E $300,000 $300,000
Commissioning & Miscellaneous $1,032,500 $1,032,500
Project Management $150,000 $500,000 $500,000 $250,000 $100,000 $1,500,000
Contingency $54,000 $698,200 $3,128,000 $2,520,300 $1,610,700 $245,000 $8,256,200
TOTALS $554,000 $7,678,200 $34,408,000 $27,723,300 $17,757,700 $2,710,000 $90,831,200
Construction Timeline
Page 176. BUSINESS CASE
REVENUE & OPERATIONAL EXPENSE ESTIMATES
Estimation of Operational Revenues
Exhibition Park has determined that the redevelopment and replacement of the existing facilities
will generate two major sources of additional revenue:
• Enhanced Revenue:
o Site redevelopment and replacement of the existing aging facilities will enable
additional revenues to be generated for existing events. Exhibition Park has
documented evidence that demand for access to many existing events by
promoters exists. It is expected that with the larger exhibition space available to
exhibitors, existing programs such as Ag Expo and the Home and Garden Show
events will support an increase in new exhibitors, driving and supporting a
renewed local and regional public interest in attending existing programming at
the new facilities.
• Incremental Revenue:
o Site redevelopment and replacement of the existing aging facilities will enable net
new programming to be added to the existing complement of programming being
driven and managed by Exhibition Park, generating new and incremental
revenues, over and above those being generated via existing programming.
o It is expected that new programming related to conventions, large trade shows,
large exhibitions, indoor equestrian and agricultural programs will be attracted to
the new facilities and generate a significant amount of incremental income for the
Park.
Forecasted revenues are based on 2011 dollars, adjusted to 2020 values by escalating the
base year at 3% per year. Additional details of the projected new revenue sources can be
found in Appendix C.
Exhibition Park site development and facilities replacement project will have 3 significant
revenue stream associated with its operations; the Existing, the Enhanced and the Incremental
revenue streams. At “steady state” operating condition, these 3 revenue streams are expected
to generate annual operating revenue of $7,440,730, as noted in the table below:
Steady State
Revenue Streams Revenues
(2020)
Existing Revenues $3,922,231
Enhanced Revenues $653,189
Incremental Revenues $2,865,310
Total $7,440,730
Page 18Estimation of Operational Expenses
Redevelopment and replacement of the existing facilities at Exhibition Park will also result in the
generation of new and incremental annual operating costs for utilities, supplies, staffing and the
like. In calculating and estimating the total annual operating expenses for the redeveloped site
and new facilities, Exhibition Park assumed:
• The operating expense associated with the Existing revenue streams would remain as
per the 2011 actuals, escalating annually at 3%. This escalation factor is conservative, it
represents the average annual operating expense increase year over year for Exhibition
Park in the last 13 years.
• The operating expenses associated with the Enhanced revenue stream have been
estimated to be equivalent, on a pro-rata basis, to those associated with the existing
revenue streams, escalating annually at 3%.
• The operating expenses associated with the incremental revenue stream have been
estimated to be 98% of revenues immediately upon completion of the facility, in 2018.
This is equivalent to a net operating margin of 2%. This reflects the starting point for a 3
year ramp up period, related to improving expense management at the new facilities.
• With the concurrent introduction of new programming in 2018, operating expenses have
been estimated to improve over a period of 3 years to 91% of operating revenues as
facility operations reaches “steady state” (2020) and the management team is able to
take full advantage of the anticipated reduced direct operating costs of the facility and
the synergies and economies of scale anticipated within the indirect operating expense
areas. This is equivalent to a net operating margin of 9%.
Based on these assumptions, at “steady state” operations, the total annual operating expenses
of Exhibition Park would be:
Steady State
Expenses
Expense Streams
(2020)
Existing Expenses $3,562,604
Enhanced/Incremental Expenses $3,195,185
Total $6,757,789
Page 19Estimation of Net Operating Income
Over the past 10 years, Exhibition Park has continually operated within its means, with average
operating margins over the past 10 years of 6.3%. The table below provides a breakdown of
annual operating margin during the period 2002 – 2011.
2007-2011 2002-2011
(5 year) (10 year)
Average Net Operating Income $ 215,155.67 $ 170,104.43
Average Operating Margin 7.1% 6.3%
Despite the challenges of increasing costs of operating and maintaining the existing aging
facilities, Exhibition Park has successfully managed to generate a healthy and positive net
operating margin, on average, each year during this period as is required in its mandate.
Based on the operating revenue and expense analysis that has been done to date, Exhibition
Park forecasts positive and sustainable net operating income during and following the
completion of the site development and facilities replacement project, as shown in the table
below:
Revenue vs Expenses
$10,000,000
$9,000,000
$8,000,000
$7,000,000
$6,000,000
$5,000,000
$4,000,000
$3,000,000
$2,000,000
$1,000,000
$0
2011 2012 2013 2014 2015 2016 2017 2018 2019 2020 2021 2022 2023 2024 2025 2026
Revenue Expenses
Note: Initial revenue and expense values based on 2011 dollars and inflated at 3% per annum.
Page 20The steady state estimation of net operating income has been compared with reported financial
information from similar exhibition facilities within Alberta and Saskatchewan, as outlined in the
table below:
Westerner Park Prairieland Exhibition Park
Exhibition Facility
(Red Deer, 2011 value) (Saskatoon, 2009 value) (2020 projection)
Revenue $6,465,000 $16,197,651 $7,440,730
Operating Expense $5,660,316 $15,130,352 $6,757,789
Earnings Before $804,717 $1,067,299 $697,036
Amortization
Margins 12.4% 6.5% 9.1%
Details of the current and projected operating costs and revenues, and associated net operating
incomes can be found in Appendix D.
Page 217. ECONOMIC IMPLICATIONS OF DEVELOPMENT
The Lethbridge Exhibition site development and facilities replacement project will provide
positive and significant short and long term economic impacts and implications for Lethbridge
and region. The ongoing commitment of Exhibition Park to present attractive and exciting
programming to Lethbridge citizens and visitors underpins this economic impact. New
programming at the facilities will create additional demand and participation, sustaining and
growing this baseline economic value.
To estimate these economic impacts and benefits, an industry standard methodology was
followed, using economic multipliers released in 2011 by Statistics Canada for Alberta. The
economic measures of GDP, Employment and Tax Revenue were calculated against the
‘drivers’ of economic impact and benefit: Construction Spending and Operational Spending.
Overall, the site development and facilities replacement project at Exhibition Park will deliver
real and substantial benefit within Lethbridge and the Southern Alberta region.
During the construction period of 2015 to 2018, the project will generate $70 million in total
direct and indirect benefit, with respect to the added value of the construction aspects of the
project. As well, Lethbridge & other regions can expect to see an increment of 750 full time
jobs, on site and off site, during the construction period and over $21 million in provincial and
federal tax revenue.
Direct & Indirect Economic
Benefit (Lethbridge & Provincial & Federal Tax
region) FTE Revenue
During Construction
(2015-2018) $ 70,000,000 750 $ 21,000,000
Once the facilities are built and operating at ‘steady state’, in the first 10 years of the project
(2020 to 2030) approximately $30 million in direct and indirect regional economic contribution
from new programming and incremental sources of revenue will be generated. During the same
time period, an estimated 700 full time jobs will be created and maintained and over $10 million
in net new provincial and federal tax revenues will be generated.
Direct & Indirect Economic
Benefit (on incremental Provincial & Federal Tax
portion) FTE Revenue
At Steady State (over
10 year period, 2020-
2030) $ 30,000,000 700 $ 10,000,000
In addition, there are a number of anticipated direct and indirect spin-off economic benefits to
other businesses, service providers and related organizations in the Lethbridge region that are
expected but have not yet been quantified, such as off-site visitor spending generated by
conventions and the other enhanced and incremental activities at Exhibition Park. Further, new
facilities such as those contemplated by the project have the potential to become catalysts of
community and regional growth, acting to attract new business and new residents to the area
because of their presence and availability.
Page 228. CAPITAL FUNDING & FINANCING STRATEGY
Funding & Financing Considerations
Funding for the Exhibition Park Development Project could come from a combination of several
sources, which could include:
• Lethbridge & District Exhibition contribution
• Municipal in-kind capital offset - completion of off-site infrastructure works, as required
• Municipal, Provincial & Federal capital grants
• Other - Community / Corporate
Lethbridge & District Exhibition Contribution
The Exhibition expects to contribute to the capital cost of the project in 4 ways:
1. Capital Cost Avoidance
Lethbridge & District Exhibition has reviewed the planned use of the 2010 C.I.P. funds already
received from the City of Lethbridge and estimates that of the $9.2 M in funds an amount can be
used in a way to offset / avoid an equal amount of the Site Development costs accounted for in
this project. Alternatively, only a small portion of the funds have been spent to date and the
remainder could be realigned with this project.
2. Capital Asset Offset
Lethbridge & District Exhibition currently owns approximately 156 acres of land in S.E.
Lethbridge, which is zoned “Residential”. The land was acquired in 2007 for $4.6M and based
on land values in that area of a similar location and size, has a current market value of $4.6 -
$5.2M. Revenue from the sale of land would support this project.
3. Long Term Debt Servicing Support
One of the most notable commitments that the Exhibition is able to make, relative to funding the
facility development project is to fully accept the operating risk. In this context, the Exhibition is
confident in its ability to retain existing, and attract new and profitable programming such that it
fully anticipates that operating income will exceed operating expense in each year of operation
once the facility has been constructed and is operating in a ‘steady state’ mode (approximately
2020). This plan will have no ongoing pressure on the City of Lethbridge operating budget, and
by leveraging the expected positive net operating income, Lethbridge & District Exhibition will
also be in a position to support the debt servicing requirement of the project.
4. Capital Reserve
Lethbridge & District has a capital reserve fund of $2 million which would be allocated to this
project.
Municipal in-kind Capital Offset
It is anticipated that the City of Lethbridge will construct all necessary off-site underground and
other off-site infrastructure
Municipal, Provincial & Federal Capital Grants
It is anticipated that municipal, provincial and federal capital grants will be available for the
project. These grant options will be identified and applied for upon confirmation of the project
being included in the City of Lethbridge Capital Improvement Plan.
Page 23Other - Community/Corporate Sources
Other potential capital funding sources could include a Community Capital Campaign and/or
naming rights. Private sector acquisition of the naming rights for all or some of the new facilities
being constructed will contribute to the capital cost reduction.
Page 249. COMMUNITY SUPPORT
This development project is community driven, community designed and community supported.
As much attention was spent to bringing the community up to date on the project as was done
to include community input. The following is a list of presentations and public engagement
milestones.
• Media Update – November 20, 2012
• Update Exhibition Park Staff – December 12, 2012
• Lethbridge MLAs Update – December 19, 2012
• Mayor and Council notification of project – January 8, 2013
• Media Launch – January 9, 2013
• Minister of Tourism Update – January 15, 2013
• City Management Team – January 22, 2013
• MP Update – January 22, 2013
• Minister of Culture Update – January 29, 2013
• Lethbridge & District Exhibition Shareholders – January 31, 2013
• Minister of Agriculture Update – Feb 15, 2013
• Ag Expo Booth – February 27-March 1, 2013
• Residents Open House – March 5, 2013
• Park Place Mall Booth – March 9 & 10, 2013
• Home & Garden BDO Breakfast Presentation (invite only) – March 13, 2013
• Public Presentations – Home & Garden March 13, 2013
• Booth at Home & Garden – March 13-16, 2013
As of March 20, 1013, we have received 33 letters of support from the following organizations
and a petition signed by 638 citizens. Where available and applicable we have included the
number of members these organizations represent in our community.
Name of Organization # of Members President / Chair
4H 6479 Marguerite Stark - Branch Head
AAAS 284 Tim Carson CEO
Alberta Fire Chief Association 450 Brian Cornforth - President
Allied Arts Council 250 Gloria Torrance - President
Canadian Association of Fairs &
Exhibitions 790 Karen Oliver - President
Nikolaus Wyslouzil (Executive
Chinook Country Tourist Association 220 Director)
Chamber of Commerce - Lethbridge 750 Darren Boras - President
Deborah Ganger - General
CKVN Radio n/a Manager
Clear Sky Radio n/a Casey Wilson - General Manager
Page 25Name of Organization # of Members President / Chair
10 communities in
Community Futures Region Darlene Sinclair - General Manager
County of Warner n/a Ross Ford - Reeve
CTV n/a Len Perry - Regional VP
Economic Development Lethbridge 57 Cheryl Meheden, President
Eldorado RV n/a Greg Knopp
FarmPress n/a Jeff Sarich - General Manager
Galt Museum 2100 Charleen Davidson - Chair
Jim Hillyer, MP n/a Jim Hillyer, MP
Lethbridge Lodging Association 11 Hotels Dwayne Stratton - President
Mayors & Reeves of Southwest Alberta 34 Terry Kerkhoff - Chair
Pattison Group n/a Gary Dorosz General Manager
Town of Coaldale n/a Kim Craig - Mayor
Travel Alberta n/a Wynn McLean - VP
Jim Watt - Chief Governance
UFA n/a Officer
University of Lethbridge / Conference &
Event Services n/a Erin Crane - Manager
Rocky Mountain Turf Club n/a Max Gibb - CEO
Lethbridge Senior Citizens Organization 2100 John Machielse, President
Nord-Bridge Senior Centre 1293 Jim Hahn - President
Lethbridge Construction Association 200 Roger Simpson - President
Canadian Home Builders Association -
Lethbridge 150 Anita Hartman, President
Gas King Companies n/a Brent Morris, President
Lethbridge Downtown Rotary 151 Stephen Graham, President
Lethbridge Sports Council 75 Dr. Gary Bowie, Chair
Refer to Appendix E for copies of letters
“We, the undersigned, have seen the development plans for Exhibition Park, and
we support this project being identified as a capital priority for the City of
Lethbridge and support it being funded in their Capital Improvement Program
2014-2023” Signed by 638 citizens (2013)
Refer to Appendix F.
Page 26You can also read