DXB Entertainments PJSC - Investor Presentation May| 2017
←
→
Page content transcription
If your browser does not render page correctly, please read the page content below

DXB Entertainments PJSC
Investor Presentation
May |   2017

Disclaimer
PRESENTATION AND ITS CONTENTS ARE NOT FOR RELEASE, PUBLICATION OR DISTRIBUTION, IN WHOLE OR IN PART, DIRECTLY OR
INDIRECTLY IN OR INTO ANY JURISDICTION WHERE SUCH DISTRIBUTION IS UNLAWFUL.

This presentation has been prepared and issued by DXB Entertainments PJSC (the “Company”). For the purposes of this notice, “presentation” means this
document, its contents or any part of it, any oral presentation, any question or answer session and any written or oral material discussed or distributed during
the presentation meeting.

The information set out in this presentation may be subject to updating, revision, verification and amendment and such information may change materially.
Neither the Company, any of its parent or subsidiary undertakings, the subsidiary undertakings of such parent undertakings, nor any of such person’s
respective directors, officers, employees, agents, affiliates or advisers is under an obligation to update or keep current the information contained in this
presentation to which it relates or to provide the recipient of with access to any additional information that may arise in connection with it and any opinions
expressed in this presentation are subject to change without notice. None of the Company or any of its parent or subsidiary undertakings, or the subsidiary
undertakings of such parent undertakings, and any of such person’s respective directors, officers, employees, agents, affiliates or advisers shall have any
liability whatsoever (in negligence or otherwise) for any loss whatsoever arising from any use of this presentation, or otherwise arising in connection with this
presentation.

This presentation is an advertisement for the purposes of the United Kingdom Prospectus Rules and the information contained herein are not an offer of
securities for sale in the United States nor any other jurisdiction. This presentation does not constitute or form part of, and should not be construed as, any
offer, invitation, solicitation or recommendation to purchase, sell or subscribe for any securities in any jurisdiction nor should it or any part of it form the basis of,
or be relied on in connection with, any contract or commitment whatsoever.

This presentation is for information purposes and convenient reference. It is not definitive advice, nor should it be relied upon as such. This presentation does
not purport to contain all of the information that may be required to evaluate any potential transaction and should not be relied on in connection with any such
potential transaction. Any projection, estimate, forecast or other ‘forward-looking’ statement in this presentation only illustrates hypothetical performance under
specified assumptions of events or conditions, and is not a reliable indicator of future performance.

To the extent available, the industry and market data contained in this presentation may have come from official or third party sources. Such third party
industry publications, studies and surveys generally state that the data contained therein have been obtained from sources believed to be reliable, but that
there is no guarantee of the accuracy or completeness of such data. While the Company believes that each of these publications, studies and surveys has
been prepared by a reputable source, the Company has not independently verified the data contained therein. In addition, certain of the industry and market
data contained in this presentation come from the Company's own internal research and estimates based on the knowledge and experience of the Company's
management in the market in which the Company operates. While the Company generally believes that such research and estimates are reasonable and
reliable, they, and their underlying methodology and assumptions, have not been verified by any independent source for accuracy or completeness and are
subject to change without notice. Accordingly, undue reliance should not be placed on any of the industry or market data contained in this presentation.
 You agree to be bound by the foregoing limitations and conditions and, in particular, will be deemed to have represented, warranted and undertaken that you
have read and agree to comply with the contents of this notice.

LEGO ®, the LEGO logo and LEGOLAND ® are trademarks of the LEGO Group. ©2016 The LEGO Group. LEGOLAND IS A PART OF MERLIN
ENTERTAINMENTS plc.
                                                                                                                                                                       2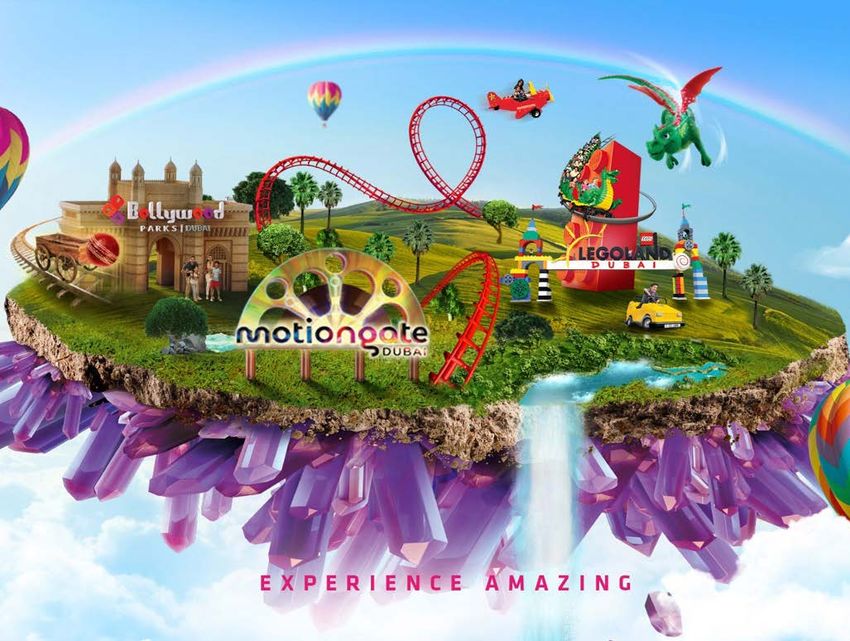
Company Overview

               3
DXB Entertainments PJSC
DXB Entertainments PJSC is a Dubai headquartered leisure and entertainment company
traded on the Dubai Financial Market under the trading symbol DXBE.

DXB Entertainments PJSC was listed on the DFM in December 2014 originally as Dubai Parks
and Resorts PJSC.

DXB Entertainments PJSC owns the Dubai Parks and Resorts destination which consists of 4
theme parks (Six Flags Dubai coming in 2019) and 1 water park all at the same location.

          8.0b                    5.2b                      8.1b
      AED 8 billion equity      AED 5.2 billion          AED 8.1 billion market
                                financing                cap
      DXB Entertainments        DXB Entertainments       DXB Entertainments
      has raised AED 6.3        has raised AED 4.2       PJSC is listed on the
      billion in equity         billion through a        Dubai Financial Market
      through an IPO in         financing facility for   and has a market cap
      2014, and an additional   Phase I for DPR, and     of AED 8.1 billion as at
      AED 1.7 billion through   an additional AED 1      31 March 2017.
      a rights issue in 2016.   billion for Phase II.

                                                                                       4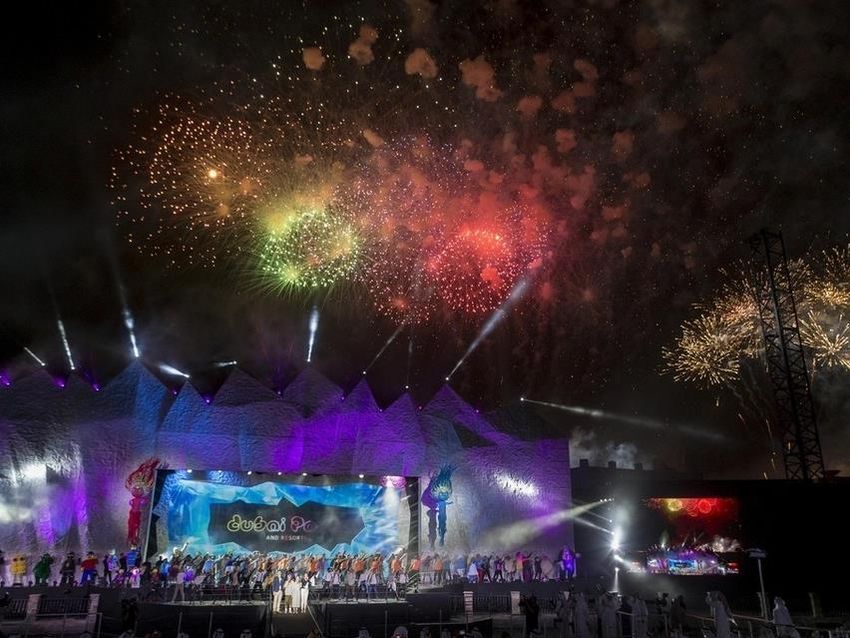
DXB Entertainments group

The Company aims to generate long term growth through developing
relevant companies and assets in target sectors:

           Theme Parks                                      Hospitality                                Retail and Dining

                                                                      Hotel*

                            *

In the short-term, DXB Entertainments’ focus is to achieve operational excellence
and delivering additional growth and stable visitor numbers at Dubai Parks and
Resorts.

In the medium to long-term the Company may seek to expand the opportunities
to include media and entertainment.
  * Phase II expansion, coming after 2018. LEGO, the LEGO ® logo and LEGOLAND ® are trademarks of the LEGO Group. ©2015 The LEGO Group.   5
  LEGOLAND IS A PART OF MERLIN ENTERTAINMENTS plc.
Shareholding structure

                                                                                           Shareholder composition
                                                                                           As at 31 March 2017

A     Dubai-based     holding   company
established in 2007, with operations and
assets in the UAE and overseas
Has access to a huge land bank in prime
locations throughout Dubai
Has launched several projects in the
tourism, retail, hospitality, leisure and
entertainment sectors
Is focused on introducing new and unique                                                          Meraas                        52%

products to the market
                                                                                                  Qatar Holding                 11%
                                                                                                  Kuwait Investment Authority   5%
Is committed to the success of DXB                                                                Institutional                 22%

Entertainments                                                                                    Retail                        10%

   Sources: Meraas, Company information, Other public sources. Shareholder structure as at 31 March 2017.
   Due to rounding, numbers presented may not add up precisely to the totals provided and percentages may not precisely reflect the absolute figures   6
Dubai Parks and Resorts

                      7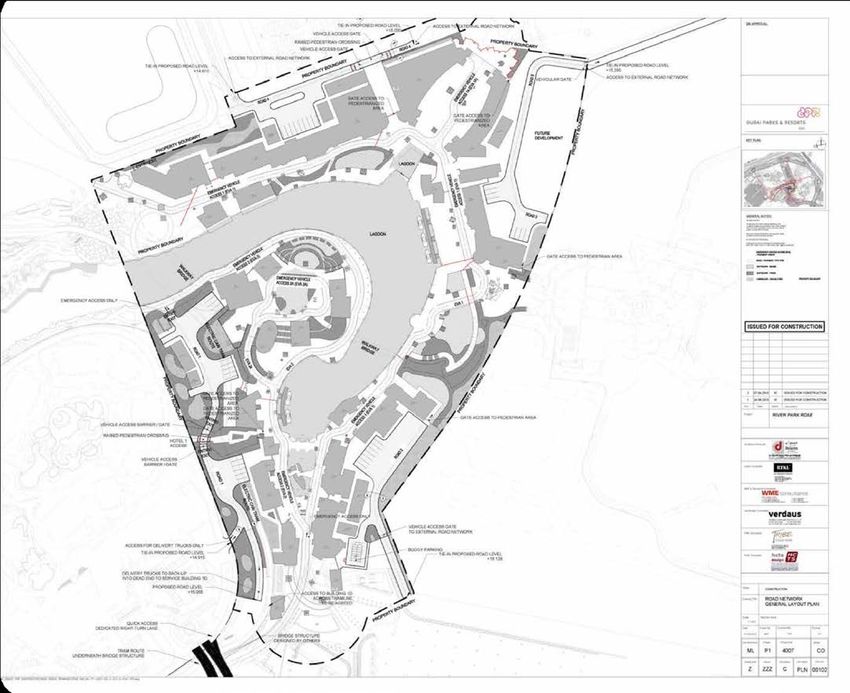
Dubai Parks and Resorts
Premier year-round integrated theme park
destination, opened on 31 October 2016
Total estimated cost is AED 13.2 billion
•   AED 10.5 billion for Phase I and
•   AED 2.7 billion for Phase II.
World class partners and brands including
LEGOLAND® Parks, DreamWorks Animation
LLC, Colombia Pictures, Lionsgate, Six Flags
and popular Bollywood movies
Set across 30.6 million square feet of land of
which 25.1 million square feet is for Phase I
and 5.5 million square feet for Phase II of DPR
•   c. 19.5 million square feet is owned by us,
    and
•   c. 11.1 million square feet of additional land,
    for which we have all necessary easement
    rights, will principally be used for access
    roads and parking

     Due to rounding, numbers presented may not add up precisely to the totals provided and percentages may not precisely reflect the absolute figures   8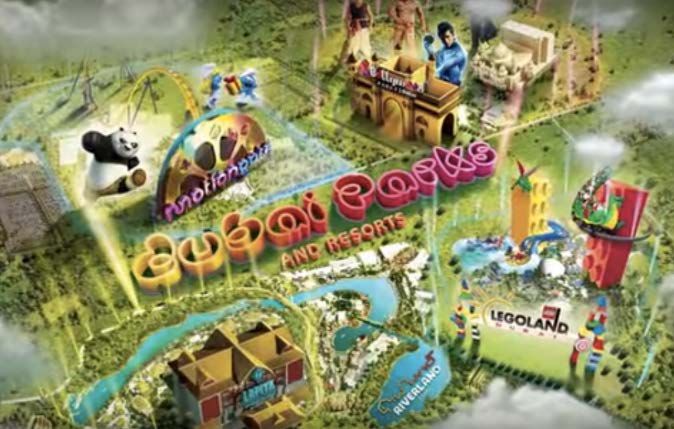
DPR location

Strategically located on Sheikh Zayed
Road mid way between Dubai and Abu
Dhabi International Airports

 20 km from Al Maktoum International Airport

 63 km for Dubai International Airport

 68 km from Abu Dhabi International Airport

                                               9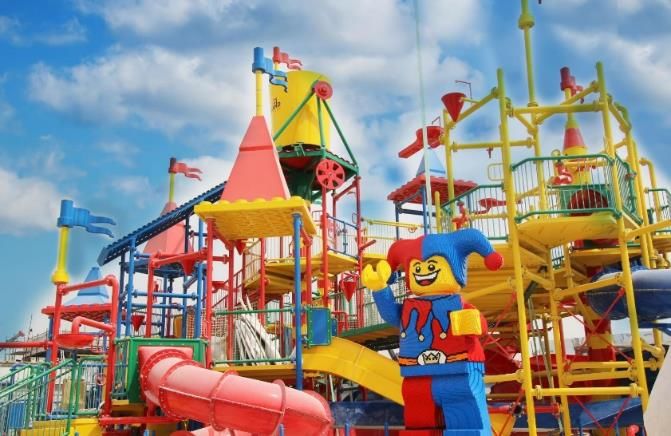
Dubai Parks and Resorts
officially inaugurated on 18
December 2016

                               10
Dubai Parks and Resorts opening
31 October 2016
LEGOLAND® Dubai and
Riverland™ Dubai
17 November 2016 16 December 2016
Bollywood Parks™ Dubai MOTIONGATE™ Dubai
2 January 2017
Lapita™ Hotel
LEGOLAND® Water Park
11Key Investment Highlights
12Key investment highlights
As the owner of the largest theme park destination in the Middle
East and Indian Subcontinent, DXB Entertainments is a unique
opportunity to tap the regional theme park market
01
Untapped theme park market in the MENA/Indian Subcontinent
Despite significant demand for theme park offerings, the Middle East and wider region
currently lacks a world class theme park destination.
02
Favourable UAE tourism growth trends
Dubai’s international visitors reached 14.9 million in 2016 – a 5% increase year on year.
In the first quarter of 2017 it has grown by 11%.
03
Unique offering
Only multi-theme park destination in the region, first Bollywood theme park in the
world, only water park targeting children in the region, first LEGOLAND® Park in the
region, and a unique Hollywood movie themed park.
13Untapped theme park market MENA/Indian subcontinent
3 billion people live DXB arrivals Top 10 global theme Dubai and Abu Dubai and Abu
within a 4 hour Dhabi tourist Dhabi
up 7.2% in 20161 park groups recorded
flight from Dubai arrivals projected population
420.4 million visits in
to grow at 8.6% growth
20152
projected at
CAGR3
4.0% CAGR3
Global Attendance Across Top
Theme Parks (2015, million) 4.6
6.8 4.7
7.7
3.6 8.9
20.5
5.2
2.9
142.7 14.7 50.0
62
UNTAPPED
MARKET
7.7
1.4
4.2
1.0
3.7
1.0
Source: AECOM
1 “Dubai Airports Factsheet. 2 AECOM. 3 Source: Dubai Parks and Resorts 2015 Feasibility Study for the period 2014-2022F. 14
Other sources: TEA and AECOM 2015 Theme park index, AECOM Global Attractions Attendance Report.Tourism growth trends
Visitors from top 10 source markets Q1 2017 Q1 2016 % change
Total visitors Jan-Mar 2017 Jan-Mar 2017 (’000 visitors) India 578 469 23%
Saudi Arabia 440 476 -8%
4.57m UK
China
Oman
350
230
334
140
5%
64%
Up 11.2% YOY Iran
214 322 -33%
181 130 39%
Pakistan 178 152 17%
USA 176 166 6%
Germany 172 171 0%
Kuwait 131 119 10%
Total 2,650 2,479 6.9%
Russia 126 61 106%
7% – Russia, CIS, EE
(Eastern Europe)
22% – Western Europe
6% – Americas 11% – North Asia and
South-East Asia
19% – GCC
18% – South Asia
12% – MENA
4% – Africa
1% – Australasia
Source of visitors by region (% in Jan-Mar 2017)
Source: Department of Tourism and Commerce Marketing (DTCM) 15Unique offering
A multi-themed destination unique to region and the world
• Only theme park destination in the world with 4 gates
within walking distance of each other
• Targets a wide audience across age groups and
demographics– families with children 2-12, teenagers,
adults
• Best-in-branded entertainment from three of the largest
picture studios in Hollywood – DreamWorks Animation,
Columbia Pictures and Lionsgate
• First Bollywood theme park in the world
• First LEGOLAND® park in the region
• First water park targeting children 2-12 in the region
LEGO, the LEGO ® logo and LEGOLAND ® are trademarks of the LEGO Group. ©2015 The LEGO Group. LEGOLAND IS A PART OF MERLIN 16
ENTERTAINMENTS plc.Q1 2017 Performance
17Key Q1 2017 performance highlights
1 January 2017 – 31 March 2017
Total Revenue Theme Park Revenue
AED 159.9 million AED 125.4 million
Visits Revenue per cap
586,355 AED 213.9
(theme parks)
Drawn down
Total assets
AED 12.5 billion AED 3.8 billion
From AED 4.2 billion facility
Due to rounding, numbers presented may not add up precisely to the totals provided and percentages may not precisely reflect the absolute figures. 31 March 2017 figures are
unaudited. 18Revenue breakdown
1 January 2017 – 31 March 2017
Totalrevenue Theme parkrevenue Retail revenue Hospitality revenue
AED159.9m AED125.4m AED14.4m AED10.4m
Theme park 78% Admissions 68% Leasing 76% Accommodation 70%
Retail 9% In-park spend 24% Non-leasing 24% Others 30%
Hospitality 7% Others 8%
Others 6%
Visits GLA leased Average occupancy
586,355 84% 21%
Revenue per capita Average daily rate
AED 213.9 AED 795
Theme parks
Due to rounding, numbers presented may not add up precisely to the totals provided and percentages may not precisely reflect the absolute figures. 31 March 2017 figures are
unaudited. The Group currently determines and presents financial information as a single operating segment based on the information that is provided internally to corporate management for 19
decision making.Visits breakdown
Total Visits
586,355 Visits breakdown (bycategory)
Jan-Mar 2017
Walk-in 33%
Online 24%
Tour operator 14%
Others 29%
Note: Others include Schools, Corporates, Annual passes, VIPs and
Complimentary passes
Key visitation factors:
Key School holidays during the period positively impact
attendance
• Saudi school holidays
• Kuwaiti school holidays
• UAE school holidays
Rainy weather during the period negatively impacts
attendance
20Summary financial results
1 January 2017 – 31 March 2017
Financial Performance
AED millions
Q1 2017 Q1 2017 Adjusted*
Revenue 160 160
Cost of Sales (13) (13)
Gross Margin 147 147
Operating Expenses (285) (214)
Depreciation (111) (111)
Interest / Financing Costs (Net) (43) (50)
Loss for the period (292) (228)
CF hedging gain (loss) on FV 4 4
Total Comprehensive loss for the period (288) (224)
* Adjusted Q1 2017 performance excludes pre-operating expenses of AED 71 million from operating expenses and AED 7 million of
interest income from Six Flags Dubai from Interest/Financing Costs
Excluding pre-operating expenses and interest income from Six Flags Dubai
Loss for the period Operating Expenses
AED228m AED214m
Excluding the pre-operating Excluding the pre-operating
expenses and interest income from expenses and interest income from
Six Flags Dubai Six Flags Dubai
Due to rounding, numbers presented may not add up precisely to the totals provided and percentages may not precisely reflect the absolute figures. 31 March 2017 figures are
unaudited. 21Summary financial results
1 January 2017 – 31 March 2017
Total assets
Financing
AED12,541m AED3.8bn
Dec 2016: AED 12,814 million AED 3.8 billion drawn down from
our AED 4.2 billion financingfacility
Property and equipment 75.14% for Phase I of DPR
Investment properties 5.01%
Investment in a Joint Venture 0.14%
Inventories 0.38%
Due from a related party 0.18%
Trade and other receivables 1.15%
Derivative financial instruments 0.33%
Other financialassets 3.34%
Cash and bank balances 14.34%
For the three months ended 31 March 2017
Movement in Cash
AED millions
800
Operating
Investing- other financial assets
600
Investing- property and equipment and
investment properties 400
Investing - others 571
Financing 200 295
-
(10)
(200) (64)
(529)
(400)
(600)
Due to rounding, numbers presented may not add up precisely to the totals provided and percentages may not precisely reflect the absolute figures. 31 March 2017 figures are
unaudited. 22Key challenges ahead
Operating during summer and Ramadan
Q2 and Q3 are expected to be lower performing
quarters due to Ramadan and the summer
months
Effective 21 May 2017 new operating hours,
improved transportation service and attractive
packages will be implemented to continue
attracting visitors during the summer
Increasing attendance numbers from tour and
travel
Key focus for the sales strategy is increasing the
contribution of the tour and travel to the visitation
numbers to ensure targets are met
Ramp-up in contribution from 5% in Q4 2016 to
14% in Q1 2017 shows promising signs of
growth
23DPR Strategy
24Sales strategy
Create active consideration and pre-
booking solutions for tourist planning
to vacation in Dubai
Drive demand and secure conversion
for tourist already in Dubai
Diversify source of business to secure
off-peak attendance
Build consumer insight and revenue
management to better forecast and
optimize our business
Deliver solid booking solution and
engaging customer portal
25Sales strategy
Source market representation and attendance targets
UK Germany / Swiss Russia
- Rep office - Rep office - Rep office
- 2 ticket brokers - 8 Tour - 9 Tour
- 10 Tour operators operators
operators
Russia
Canada
Western Europe
USA China
China
- Rep office
- 9 Tour
operators
Nigeria - 2 OTA’s
India / Pakistan
Australia
Africa
- 8 Tour
operators
UAE India
- 82 DMC’s - Rep office
- 9 Tour
operators
26Ticket prices
In line with regional and international offerings
Dubai Parks and Resorts
Adult ticket price
Park / attraction Adult ticket price ($)
(AED)
MOTIONGATETM Dubai 80 295*
Bollywood ParksTM Dubai 65 240
LEGOLAND® Dubai 80 295
LEGOLAND® Water Park 65 240
Regional
IMG World of Adventure 66 245
Ferrari World 75 275
Wild Wadi 75 275
Yas Waterworld 68 250
Aquaventure 70 260
Ski Dubai 91 335
At the Top – Burj Khalifa 55 - 136 200 - 500
International
Magic Kingdom 115 422
Disneyland Tokyo 65 238
Disneyland Anaheim 110 404
Epcot 107 392
Disneyland Paris 80 291
Universal Studios
76 199
Singapore
LEGOLAND Malaysia 34 128
* MOTIONGATE Dubai preview price is AED 250, valid until early Q2 2017. Due to rounding, numbers presented may not add up precisely to the totals provided and percentages
may not precisely reflect the absolute figures. Sources: Company information, company websites, Dubai Parks and Resorts 2014 Feasibility Study , CBRE, TEA / AECOM reports 27Revised pricing strategy
Simplifying the diversity of our offering
Single park / multi-park / multi-day ticket options
1 1 day 2 Days 7 days
day 2 parks 4 parks All theme parks
Starting
From* AED 215 AED 335 AED 425 AED 505
Annual Passes
Single VIP all
Single park + All
park parks
water park parks
Starting
From AED 755 AED 985 AED 2,496 AED 6,995
Add On
Q - Fast VIP tours VIP tickets
*the prices as per dated tickets purchased online. 28Driving in-park spend
01 02 03 04
Food and Beverage Merchandising Photography and Services
Games
All F&B concepts IP branded Picsolve Locker rental
within the parks are products International is
operated by Dubai providing in-park Stroller rental
Parks and Resorts Park branded image capture
in partnership with products Wheelchair rental
our central kitchen HB Leisure are
Destination-wide providing skills ECV rental
products games
3rd party Both are revenue
concessionaires share agreements
29Enhancing the visitor experience
Resort App
MAIN FUNCTIONALITIES:
o Discover the park
o Buy tickets
o See all attractions Tickets
o Way finding
o Geo Localization MAIN FUNCTIONALITIES:
o E-Wallet o RFID ticket
o Share E-Wallet o E-Wallet
o Family & Friends o Hotel key
o Meeting Place
o Events
o Share content
o Make reservations
o Couponing
o Push Notification
o Book a table
30Creating and leveraging our own brand IPs
31Mitigating the potential impact of seasonality
• Overall, weather is a key factor that impacts theme park attendance
• Rain, snow and high temperatures impact attendance figures and ability to operate – theme parks
Weather can be located in countries that experience high levels of precipitation (Denmark, France, etc.) or humidity
of concern for (Singapore, etc.) experience a negative impact on attendance
theme
• Temperature is a potential concern for Dubai Parks and Resorts - Dubai is hotter than other theme
park attendance
park destinations during the summer months - however, precipitation levels are by far the lowest when
compared to other international markets with significant theme park offerings
– Dubai has an average monthly precipitation level of 8 mm versus 108 mm, 53 mm and 195 mm for
Florida, Paris and Singapore respectively
The DPR master plan
Mitigating the
has been designed to
DPR heat strategically address
concern heat concerns
78% 43% 69%
% attractions indoor and air conditioned
Integrated Indoor and air Adjustment of
strategy for State-of-the-art conditioned queuing Landscape and operating hours during
dealing with the integrated cooling for rides; any architecture includes summer months to
heat systems additional outdoor significant shading address peak day
queuing has fans temperatures
Addressing the concerns around heat levels in
Dubai during the summer months
Sources: Dubai Meteorological Office, National Environment Agency Singapore, Météo-France, Danish Meteorological Institute, World Weather 32
OnlineSummer Strategy
Operating during summer and Ramadan
Effective 21 May 2017
Attractive summer packages announced
AED 195, one park + unlimited food
AED 295, two parks + unlimited food
Summer operating hours with later start
MOTIONGATE™ Dubai 2pm-10pm
Bollywood Parks™ Dubai 4pm-12am
LEGOLAND® Dubai 12pm- 8pm
LEGOLAND® Water Park 10am–7pm
Tram transportation available between the
parks and through Riverland™ Dubai
33Summer Operational Strategy
R I V E R L A N D - T R A M R OU T E
BOLLYWOOD STOP
RT1 - VIP CAR PARK STOP
MOTIONGATE STOP
RT2 - VIP CAR PARK STOP
RT1 - BOARDWALK STOP LEGOLAND STOP
Air-conditioned trams will
transport guests through
Riverland™ Dubai
RT3 - FREN CH VILLIAGE STOP
Over 150 misting fans will be
placed strategically throughout
Riverland™ Dubai.
FREN CH VILLAGE / BUS-TAXI STOP
34DPR Phase II
35Project funding – DPR Phase II
Project funding (AED m)
993
2,671
Phase II
1,678
Equity Debt Phase II
Funding Financing
Debt facility secured from Abu Dhabi Commercial Bank, Dubai Islamic Bank and Sharjah Islamic Bank.
Source: Company information
Due to rounding, numbers presented may not add up precisely to the totals provided and percentages may not precisely reflect the absolute figures 36Six Flags Dubai
As at 31 March 2017
About Six Flags Dubai
• GCC wide exclusivity (excluding KSA) + Egypt
• Due to open late 2019
• 27 rides and attractions spread across an opening day
footprint of 2 million square feet
• Construction started in July 2016
• Will be operated by Dubai Parks and Resorts (under a
management services agreement with Six Flags)
Construction update
On track to open in late 2019
Procurement:
• 7 ride agreement are signed. Agreement Signing of
10 rides are in final stage, remaining 4 rides are
under negotiation with Ride Vendors.
Design Development:
• 90% DD progressing for multiple packages.
Construction:
• Enabling works and access roads completed
• Nitro splash pond, laydown area & retention basin
substantially completed. BOH Car Park, & BOH
buildings substructure works commenced.
37LEGOLAND® Dubai Hotel
As at 31 March 2017
LEGO® themed hotel to open at Dubai Parks and
Resorts
• First LEGOLAND® Hotel in the Middle East
• Adjacent to LEGOLAND® Dubai
• Set across 300,000 square feet
• 250 rooms
• 60:40 joint venture between DXB Entertainments
and Merlin Entertainments
• Will be operated by Merlin Entertainments once
open
Construction update
Project Management
• Contracts for lead consultants finalized.
Design & Site Progress
• Detailed Design stage for Facility works completed
and currently VE exercise in progress.
• Detailed Design stage for Infrastructure works
completed and for Area Development being
developed.
• Grading works completed and Erection of Hoarding
in progress.
38Projected theme park visits and market penetration
UAE theme park addressable market Theme park visits and market penetration1
(millions of potential visitors) (2013-2022F visits in millions)
UAE Resident Population Income and Drive Qualified
45.4 43.8 Orlando Denmark Japan Hong Kong Singapore
UAE International Tourists (VFR) 40.2
9.2 Penetration rate
UAE International Tourists (Hotel Guests) 35.2 9.4 90% 42% 37% 24% 18%
32.5 8.9
30.1 4.5 No of parks 7 2 5 2 1
28.4 8.7 4.3
26.6 3.9
23.4 25.0 8.4
7.8 8.1 3.3
7.5 3.0
7.0 7.2 2.8
2.4 2.6
2.3 2.2 31.7 30.1
27.3 Total market penetration potential 44%
21.0 23.1 37%
16.8 18.0 19.2
14.1 15.5 Actual penetration (assumed 38%
28%
in business plan)
19.8
2013 2014 E 2016F 2017F 2018F 2019F 2020F 2021F 2022F
2015F
Theme Park Visits 16.9
• Total UAE theme park addressable market consists of
Potential 17.4
14.2
– Hotel tourists 15.7
12.6
– UAE residents
11.2
– Visiting friends and relatives (“VFR”) 10.1 12.1
9.1
• UAE theme park demand estimated based on penetration rates of
8.1
comparable markets 7.6 9.8 12.8
8.4 11.2
• Large variation in penetration rates based on maturity of theme park 7.8
offering
6.6
• Dubai Parks and Resorts will serve the majority of the pent up theme 3.7 6.1
park demand (number of visits does not include visits to the
0.8 1.0 1.5
Bollywood Parks’ Rajmahal theatre and to the LEGOLAND® Water 0.9 4.3 4.5 4.7
2.2 2.3 3.2
Park) 0.8 0.9 1.0
• DPR offering appeals to multiple customer segments 2013 2014 E
2015F 2016F 2017F 2018F 2019F 2020F 2021F
• World class IPs and differentiated offering Other UAE theme park visits DPR theme park visits
Source: Dubai Parks and Resorts 2014 Feasibility Study. Other UAE theme parks is based on announced and existing theme parks and assuming a steady annual growth rate in visitation numbers.
Due to rounding, numbers presented may not add up precisely to the totals provided and percentages may not precisely reflect the absolute figures
Notes: 1 - Market penetration is calculated as total theme park visits / addressable market. The addressable market for the UAE is adjusted for certain factors such as income, location etc. as per the Dubai Parks and
Resorts 2014 Feasibility Study .2 - 2016F DPR visits only include visits from expected commencement of operations as per analysis in the Dubai Parks and Resorts 2014 Feasibility Study . DPR theme park visits 39
includes Six Flags Dubai starting 2019.Financial projections summary – DPR Phase II
Total visits per year for Six Flags Dubai (million) Six Flags Dubai revenue by category (million)
1,043 1,048
893
229 230
197
78% of
theme
3.3 3.2 park
2.9 revenue
187 814 818 generate
696
d from
tickets
42
0.6 145
2019F 2020F 2021F 2022F 2019F 2020F 2021F 2022F
AED 312 AED 308 AED 316 AED 327 Revenue per capita
Tickets In-park spend
Uses of funds (AED 2,671 million) Financial performance (AED million)
Financing, corporate and others
cost Business 2020F 2021F 2022F CAGR
286 development and
issue expenses 1 Visits 2.9 3.3 3.2 5.1%
Land cost 65 Growth 13.4% -2.6%
390
Revenue 893 1,043 1,048 8.3%
Growth 16.8% 0.5%
Infrastructure EBITDA 296 371 365
cost Margin 33.2% 35.6% 34.8%
473
Net Income 134 209 204
Construction cost
1,457
1
Business Development budget to be utilized for master-planning of future phases, hospitality offering expansion, development of strategic partnerships / JV, evaluation of new concepts / ideas, etc.
In-park spend includes park sponsorship revenue. Due to rounding, numbers presented may not add up precisely to the totals provided and percentages may not precisely reflect the absolute figures. 40Contact Us
Investor Relations Contacts DXB Entertainments PJSC
Marwa Gouda Emaar Square, Building 1, Level 2
Head of Investor Relations PO Box 123311, Dubai
United Arab Emirates
Abdulrahman Al-Suwaidi
Investor Relations Officer Tel: +971 4 8200 820
Fax: +971 4 8200 819
IR@dxbentertainments.com contact@dxbentertainments.com
www.dxbentertainments.com/investor-relations www.dxbentertainments.com
41DXB Entertainments IR App
Our new Investor Relations App is available for download on the
iTunes App store and the Google Play store!
42Appendix I
Management and Board
43Senior management
Raed Kajoor Al Nuaimi Sandesh Pandhare, CFA Paul La France
Chief Executive Officer Chief Financial and Investment Officer Chief Projects Officer
• Has held senior management roles over a 15- • Over 23 years of experience in the global • Over 37 years of experience in worldwide
year period with companies such as Tatweer, private equity and investment industry entertainment and hospitality
Dubailand and Dubai Properties Group • Previously held senior positions at Istithmar developments
• Previously, he was the Chief Leisure and World and JAFZA, among others • Previously Vice President of Program
Entertainment Officer at Meraas Holding • CFA charter holder and holds a Master’s in Management at Samsung C&T
where he helped develop new strategies and Management Studies from Mumbai University, Corporation
identify opportunities for the company in the India • Selected projects include Disneyland Paris,
leisure and entertainment field Walt Disney Studios Paris, Animal
Kingdom (Florida), Hong Kong Disneyland
Resort, Universal Studios’ Hollywood and
CityWalk Expansion (California), Universal
Studios Japan, Royal Island Resort
(Bahamas)
Vinit Shah Stanford Pinto Matthew Priddy
Chief Strategy and Business Chief Parks Operating Officer Chief Technical Officer
Development Officer • Over 20 years of professional experience with • Over 35 years of experience in prototype,
expertise in the areas of risk management, project development and real estate with
• Over 15 years of experience in the leisure and
corporate governance, internal auditing, as expertise in the creative development of
hospitality industry
well as process control and design entertainment destination projects
• Has previously held senior management
management • 20 years of experience at the Walt Disney
positions at Dubai Properties Group and a
• Has previously held senior executive positions Company, with responsibility for design,
number of Fortune 500 companies
within the business consulting and risk engineering, manufacturing and overall
• Holds an MBA from the Asian Institute of
management divisions of leading accounting project management for a number of
Management in the Philippines, a Strategic
firms including Arthur Andersen and Ernst & Disney theme parks, resorts and technical
Finance certificate from the Vienna University
Young developments
of Economics and Business, and a Master’s in
• Holds an MBA from Pune University and a • Holds a bachelor’s degree in Theatrical
Commerce and Business Management from
bachelor’s degree in Commerce from the Technology from the University of
the University of Mumbai, India
University of Mumbai California, Los Angeles
Aida Hamza Klaus Assman David Loiseau
Chief Business Support Officer SVP- Retail and Hospitality SVP-Sales and Marketing
• Over 27 years of experience in management, • Over 3 decades of experience as a sales
• More than 27 years of experience in the
corporate affairs, marketing and communications and marketing professional, vastly in the
hospitality industry across the UAE, Thailand
• Has previously held the position of Director of hotel industry, working with global brands
and the United States leading the
Supply Chain Management, Human Resources, like Marriott International, Mandarin
opening/renovation of more than seven hotel
Corporate Affairs and Marketing at Ejadah Asset Oriental Hotel Groups and the Jumeirah
properties.
Management Group as well as Executive Director Group.
• Previously held the position of General
of Corporate Services at Istithmar World • Has previously held the position of Vice
Manager of Sofitel Dubai Downtown as well as
• Worked with leading companies in the UAE such President Sales with Kerzner International,
completing tenures at Jumeirah Group in the
as Dubai World, Standard Chartered Bank, ENOC, Atlantis the Palm.
UAE, Thailand and the United States, Shangri-
Citibank and Emirates Broadcasting Corporation • He is a Science Graduate with various
La Hotels and Resorts in the Philippines, Park
• Holds a bachelor’s degree in Management and leadership certifications from the industry.
Hyatt in Germany and the United States, as
Marketing from the Davis and Elkins College, West well as Nikko Hotel in the United States and
Virginia, United States the United Kingdom and Holiday Inn in
Germany
• Holds a bachelor’s degree in Hotel
Management from the Hotel School, Aachen,
Germany
44Senior management
Julien Munoz Brian Machamer Muhammad Suleman
VP – Sales VP – Theme Park Operations VP of Governance, Risk and Compliance
• More than 20 years’ experience in leisure and • Over 25 years of experience in the theme park
hospitality, including 12 in the theme park industry, including various roles in park • Over 13 years of experience in governance, risk
industry, having previously been Director, opening and operations advisory, corporate compliance, policies
Marketing & sales at Disneyland Paris. • Joined Universal Studios’ international team in development, business process review.
• He also worked with Group Accor in France, and 2008 to help design the Universal Studios • Previously he served as Senior Manager
Hilton International in the UK. theme park planned for Dubai Governance for the Engineer’s Office of His
• He now leads Dubai Parks and Resorts'’ sales • Worked with Resorts World Sentosa as Highness Sheikh Mohammed Bin Rashid Al
and distribution strategies internationally and Assistant Vice President of Attraction Maktoum and responsible for the development
domestically, and is also responsible for ticket Operations for more than 4 years, where he of its governance and control framework.
pricing and revenue management. was closely engaged in the pre-opening and • He has also previously worked with KPMG
• Mr. Munoz is an MBA graduate from Essec ongoing operations of Universal Studios (Dubai Office) as part of the Assurance &
Business School in Paris and Cornell university Singapore Business Advisory services division.
New York. • Also worked at Universal Studios Florida and • He is an Associate Member of the Institute of
Walt Disney World’s Magic Kingdom in Chartered Accountants of Pakistan. He holds
Orlando, Florida an Advanced Diploma in Management
Accountancy from CIMA—UK and a bachelor’s
degree in Commerce from the University of
Karachi, Pakistan.
Marwa Gouda, CAIA, CIRO
Head of Investor Relations
• Over 15 years experience in investor relations and
financial marketing. She previously held the
position of Head of Investor Relations at I2BF
Global Ventures, a boutique investment
management firm.
• In 2003 she joined Man Group in Switzerland and
during her six year tenure held different positions
in investment marketing and client services in
London, Zurich and Dubai. Her last position was as
Marketing and Client Service Manager at Man
Environmental Capital Opportunities, Man’s
private equity environmental finance arm.
• She is a Certified Alternative Investment Analyst
and holds a BA in Political Science and a BA in
Economics from the American University in Cairo
45Board of Directors and board committees
Nomination and Board of Directors by type
Remuneration
Name Nationality Independent Audit Committee Committee
Abdulla Al Habbai UAE Non-Executive - 5
Raed Kajoor Al Nuaimi UAE Executive -1
-3
Abdul Wahab Al-Halabi UAE Independent
Edris Alrafi UAE
Board of Directors by nationality
Fayez Mohamed Al-Boainin Qatari
Cristian Viorel Gheorghe Romanian
UAE National 5
Fahad Kazim UAE
Other Nationalities - 4
Dennis C. Gilbert USA (Chairman)
Steven D. Shaiken USA (Chairman)
Abdulla Al Habbai Abdul Wahab Al-Halabi Raed Kajoor Al Nuaimi
Chairman, Non-executive Director Non-executive Director Executive Director and Chief Executive Officer
• Group Chairman of Meraas Holding and Chairman of Dubai • Abdul Wahab Al-Halabi is the Group Chief Investment • Raed Kajoor Al Nuaimi is the Chief Executive Officer of DXB
Properties Officer of Equitativa, a diversified financial services group Entertainments PJSC
• Mr. Al Habbai is also Chief Executive Officer of the specialising in the development of REITs in emerging • Previously, he was the Chief Leisure and Entertainment Officer at
Engineering Office since 2005 and the Chairman of Dubai markets. Meraas Holding
Hills, Dubai Valiant Healthcare and Deputy Chairman of Rove • He was previously the Group Chief Investment Officer of • Has held senior management roles over a 15-year period with
Hospitality. Meraas Holding group. Mr. Al-Halabi has more than 18 companies such as Tatweer, Dubailand and Dubai Properties
• Serves on the Boards of Dubai Real Estate Corporation and years’ experience in the real estate sector, with expertise in Group
Museum of the Future amongst others. financial restructuring, crisis and debt management, credit • Holds a bachelor’s degree in Business Administration from
• Holds a Master’s Degree in Cadastral & Land Information enhancements and joint ventures. Ashford University, UK, and is a member of the Chartered Institute
Management from the University of East London • Previously held positions include partner at KPMG, Chief of Personnel and Development
Executive Officer of Dubai Properties Group
• Holds a bachelor’s degree in Economics from the London
School of Economics and an Executive MBA from Ecole
Nationale des Ponts et Chaussées
46Board of Directors contined
Edris Alrafi Cristian Viorel Gheorghe Fayez Mohamed Al-Boainin
Non-executive Director Non-executive Director Non-executive Director
• Mr Alrafi is the Chief Commercial Officer at Meraas Holding. • Mr Gheorghe is Chief Financial and Investment Officer at • Mr Al-Boainin is a talented and value-driven professional
He brings more than 13 years of experience in investment Meraas LLC. Bringing with him over 18 years of banking offering 29 years’ experience in the Information Technology
banking, finance and private equity. experience working globally across several industries. (IT) field, with 19 years in management roles.
• Prior to Meraas, he served as Head of Middle East Business • Prior to joining Meraas, Cristian served as Investment • He is currently the IT Director at Qatar Investment Authority
at the private equity firm Developing Markets Capital (DMC) Strategist at Citi Private Bank in Geneva where he led the buy managing 3 departments relating to corporate IT needs
Partners side advisory to a high profile, multibillion-dollar franchise including IT planning and strategies, business systems,
• Mr Alrafi also served as Head of UAE client coverage at relationship of the bank in Saudi Arabia. He is a board infrastructure and services.
Goldman Sachs for the UAE. Prior to Goldman Sachs, he member at Yvolve LLC, MD Health and Wellness LLC and • He is a member of the Board of the Qatar Stock Exchange
served as General Manager at First Gulf Bank in the Marsa Al Seef LLC and others. and a member of its Audit and Risk Committee. Mr Al-
Securities Division and worked closely with the CEO and • Along with a CFA designation, Cristian holds an MBA degree Boainin received his BA in Computer Science and Math from
Managing Director of the Bank. from Rotman School of Management, University of Toronto the Pacific Lutheran University in the USA.
• He is currently Vice Chairman at Noor Bank and Nshma and a Bachelor’s degree in Economics from the Academy of
Properties and the Chief Executive Officer at Dubai Holding. Economic Studies in Bucharest.
He holds a finance degree from the Higher College of
Technology in the UAE.
Fahad Kazim Denis C. Gilbert Steven D. Shaiken
Independent Non-executive Director Independent Non-executive Director
Independent Non-executive Director
• He is an Independent Advisor to the to the Group • More than 45 years of experience in the theme park and • Provides consulting services to major companies in the
attraction business travel and leisure industry including Disney, Universal,
Chairman at Meraas
• Aramark etc.
• Previously the Chief Commercial Officer at Meraas Holding Has held various senior management positions at Sea
• More than 40 years of experience in the destination
where he was responsible for the business development World of Ohio, Resorts World Sentosa (Singapore), Stone
Mountain Park (Atlanta), Ocean Embassy and three branded entertainment arena
and asset management functions including its retail
interests together with its recently launched Food & Anheuser Busch Adventure Parks • Previously, Executive Managing Director at Adventure
• Chairman of the Board and majority stockholder for World (Warsaw)
Beverage division
• Has previously worked at PwC in the audit and transaction Gilberts of Atlanta, a restaurant company operating as a • Has previously worked with industry majors such as the
‘‘Wendy’s’’ franchisee Royal Caribbean International, Seaworld Parks &
services divisions
Entertainment, Disney Cruise Lines, Starwood and Hilton
• Serves on several boards, the Oversight Board at Emirates
hotel chains, among others
REIT and Arthrogen BV.
• Holds a bachelor’s degree in Accounting from Concordia
University, Canada, and is a qualified Certified Public
Accountant
47Appendix II
Summary Financials for the three month period
ended 31 March 2017
48Condensed consolidated statement of financial position
As at 31 March 2017
Assets Equity and Liabilities
31 Mar 17 31 Dec 16 14,000 14,000
Reviewed Audited
(AED m) (AED m)
12,000 12,000
ASSETS
Property and equipment 9,423 9,465
10,000 10,000
AED Millions
Investment properties 628 634
Investment in a Joint Venture 18 -
Inventories 48 42 8,000 8,000
Due from a related parties 22 21
Trade and other receivable 144 90 6,000 6,000
Derivative financial instruments 41 37
Other financial assets 419 990
4,000 4,000
Cash and bank balances 1,798 1,535
Total assets 12,541 12,814
2,000 2,000
EQUITY AND LIABILITIES
EQUITY - -
31-Mar-17 31-Dec-16 31 Mar 17 31 Dec 16
Share capital 8,000 8,000
Cash flow hedge reserve 41 37 Property and equipment
Total Equity
Accumulated losses (930) (639) Investment properties
Bank facilities
Total equity 7,111 7,398 Investment in a Joint Venture
Trade and other payables
LIABILITIES Inventories
Bank facilities 3,560 3,204 Due from a related parties
Trade and other payables 1,870 2,212 Trade and other receivable
Total liabilities 5,430 5,416 Derivative financial instruments
Total equity and liabilities 12,541 12,814 Other financial assets
Cash and bank balances
Due to rounding, numbers presented may not add up precisely to the totals provided and percentages may not precisely reflect the absolute figures. 31 March 2017 figures
are unaudited. 49Condensed consolidated statement of comprehensive income
For the three months ended 31 March 2017
Loss for the period
31 Mar 17 31 Mar 16
Reviewed Reviewed
31-Mar-17 31-Mar-16
AED Millions
(AED m) (AED m) -
Revenue 160 - (38)
Cost of Sales (13) - (50)
General, administration and operating expenses (334) (40)
Marketing and selling expenses (41) (15) (100)
Other expenses (21) -
Interest (expenses) / income (37) 19 (150)
Amortization of borrowing cost (6) (2)
Share of loss from Joint Venture - - (200)
Loss for the period (292) (38)
Cash flow hedge gain / (loss) on fair value 4 (37) (250)
Total comprehensive loss for the period (288) (75) (292)
(300)
(350)
Due to rounding, numbers presented may not add up precisely to the totals provided and percentages may not precisely reflect the absolute figures. 31 March 2017 50
figures are unaudited.Condensed consolidated statement of cash flows
For the three months ended 31 March 2017
Movement in Cash
31 Mar 17 31 Mar 16
Reviewed Reviewed
(for three months ended 31 Mar 2017)
(AED m) (AED m)
Operating Activities
Loss for the period (292) (38)
Adjustments for:
Depreciation Expense 111 2
Interest expenses / (income) 37 (19) 800
Provision for employees' end of service indemnity 1 1
Amortization of borrowing cost 6 2 600
Share of loss from Joint Venture - -
(Increase) / Decrease in advances to contractors and other
400
receivables (43) 44
Increase in inventories (6) -
(Increase) / Decrease in trade and other payables (342) 218 200 571
Movement in related party balance (1) (13)
295
Net cash (used in) /generated by operating activities (529) 197 -
(529) (10)
Investing activities (200) (64)
Decrease in other financial assets 571 (178)
Additions to property and equipment (64) (844) (400)
Additions to investment properties - (40)
Interest received 8 3
(600)
Investment in Joint Venture (18) -
Net cash (used in) / generated by investing activities 497 (1,059) Operating
Investing-Other Financial Assets
Financing Activities
Proceeds from bank facilities 353 887 Investing-Property and equipment and Investment properties
Borrowing cost paid (6) (5) Investing-Other
Finance cost paid (52) (22)
Financing
Movement in restricted cash - (14)
Net cash (used in) / generated by financing activities 295 846
Net cash movement during the period 263 (16)
Cash and cash equivalent at the beginning of the period 1,344 364
Cash and cash equivalent at the end of the period 1,607 348
Due to rounding, numbers presented may not add up precisely to the totals provided and percentages may not precisely reflect the absolute figures. 31 March 2017
51
figures are unaudited.Appendix III
DPR Phase I projections based on 2014 IPO prospectus
52Projections DPR Phase I
Project funding (AED m)
4,214
10,536
Phase I
6,322
Equity Funding Debt Financing Phase I
2014 IPO Projections
The projections covered in this section are based on the 2014 IPO prospectus and have not been
revised since.
Management has indicated that revised guidance for 2017 will be given post Q1 2017 results and that
it is seeking a 20% operational cost reduction in 2017.
53Financial projections summary – DPR Phase I
Total visits per year (million) Theme park revenue by category (million)
2,573
2,289
2,038 616
550
492
76% of
theme park
9.1 10.3 revenue
7.9 1740 1957 generated
6.7 7.2 1546 from tickets
2017F 2018F 2019F 2020F 2021F 2017F 2018F 2019F
AED 304 AED 318 AED 324 Revenue per capita
Tickets In-park spend
Revenue by entity (AED million) Financial performance (AED million)
3,086
2,755 172 63 2017 2018 2019 CAGR
2,447 153 62 278
135 251 Visits 6.7 7.2 7.9 11.3%
220 54
Growth 7.5% 9.7%
Theme Revenue 2,447 2,755 3,086 12.3%
2573 park
2038 2289 Growth 12.6% 12.0%
revenue
is 83.4%
EBITDA 605 726 845
Margin 24.7% 26.3% 27.4%
2017F 2018F 2019F Net Income (36) 108 249
Theme parks Lapita Hotel Riverland Dubai Other
Source: Dubai Parks and Resorts 2014 Feasibility Study. Note: All the above charts capture full-year performance commencing 2017F. In-park spend includes park sponsorship revenue.
Due to rounding, numbers presented may not add up precisely to the totals provided and percentages may not precisely reflect the absolute figures. 54Summary projected financials – DPR Phase I
AED million
Forecasts as of the offering memorandum issued in November 2014
2015F 2016F 2017F 2018F 2019F
Income statement
Revenue - 563 2,447 2,755 3,086
Gross profit - 188 868 1,014 1,160
EBITDA (360) (402) 605 726 845
Operating profit before taxes and interest (360) (495) 234 351 465
Net income (326) (559) (36) 108 249
Balance sheet
Assets
Total non-current assets 4,921 9,223 8,881 8,584 8,300
Total current assets 4,138 575 719 728 865
o/w Cash 3,786 487 622 620 742
Total assets 9,059 9,798 9,600 9,312 9,165
Liabilities
Total current liabilities 687 466 91 104 119
Total non-current liabilities 2,496 4,016 4,229 3,819 3,408
o/w Loans 2,496 4,013 4,215 3,793 3,372
Total liabilities 3,183 4,482 4,320 3,923 3,527
Total equity 5,875 5,316 5,280 5,389 5,638
Total equity and liabilities 9,059 9,798 9,600 9,312 9,165
Cash flow statement
Cash flow from operating activities (152) (424) 221 726 843
Cash flow from investing activities (2,793) (4,169) (18) (65) (83)
Cash flow from financing activities 2,199 1,294 (73) (671) (645)
Sources: Company information, Dubai Parks and Resorts 2014 Feasibility Study.
Due to rounding, numbers presented may not add up precisely to the totals provided and percentages may not precisely reflect the absolute figures
Notes: 1- Income statement and cash flow statement shown above are for the periods indicated. Balance sheet relates to the financial position at the end of the corresponding
periods. 2- The financial year ending for the Company is December. 55You can also read