Negative allometric growth during ontogeny in the large pelagic filter feeding basking shark
←
→
Page content transcription
If your browser does not render page correctly, please read the page content below
Zoomorphology (2020) 139:71–83
https://doi.org/10.1007/s00435-019-00464-2
ORIGINAL PAPER
Negative allometric growth during ontogeny in the large pelagic
filter‑feeding basking shark
Harald Ahnelt1,2 · Michael Sauberer3 · David Ramler4 · Laura Koch1 · Claudia Pogoreutz5
Received: 26 May 2019 / Revised: 18 September 2019 / Accepted: 21 September 2019 / Published online: 5 October 2019
© The Author(s) 2019
Abstract
Many pelagic shark species change body and fin shape isometrically or by positive allometry during ontogeny. But some large
apex predators such as the white shark Carcharodon carcharias or the tiger shark Galeocerdo cuvier show distinct negative
allometry, especially in traits related to feeding (head) or propulsion (caudal fin). In particular, changes in propulsion are
attributed to a shift in swimming mode. The more heterocercal caudal fin of younger individuals with its large caudal fin
span seemingly aids in hunting small, agile prey. In contrast, the less heterocercal caudal fin with a larger fin area in larger
individuals aids a long-distance slow swimming mode. We were interested if negative allometric effects can be observed in
a planktivorous shark, the basking shark Cetorhinus maximus, a large species adapted to long-distance slow swimming. To
address this question, we compared three size classes, specifically < 260 cm (juveniles), 299–490 cm (subadults), and from
adults > 541 cm total length. Comparing literature data, we found negative allometric growth of the head and of the caudal
fin, but a more rapid decrease of relative caudal fin size than of relative head length. Hereby, we provide the first evidence
for early negative allometric growth of the caudal fin in a large pelagic filter-feeding shark. Our study further demonstrates
that ecomorphological approaches may add valuable insight into the life history of animals that are challenging to study in
their natural habitat, including large roving sharks such as the basking shark.
Keywords Cetorhinus maximus · Megafauna · Allometry · Swimming · Caudal fin
Introduction
Recent investigations have shown size-related spatial and
trophic guild differences within and between shark species
(Irschick and Hammerschlag 2015; Fu et al. 2016; Irschick
Electronic supplementary material The online version of this et al. 2017). These studies revealed that small-bodied sharks
article (https://doi.org/10.1007/s00435-019-00464-2) contains seemingly undergo isometric morphological changes during
supplementary material, which is available to authorized users. ontogeny, i.e., they maintain a similar body shape through-
out their life as opposed to many large shark species. In
* Harald Ahnelt
harald.ahnelt@univie.ac.at contrast, large apex predators such as the great white shark
Carcharodon carcharias (Linnaeus 1758) or the tiger shark
1
Department of Theoretical Biology, University of Vienna, Galeocerdo cuvier (Péron and Lesueur 1822) undergo a dis-
Althanstrasse 14, Vienna 1090, Austria tinct change in body proportions during ontogeny (allomet-
2
First Zoological Department, Natural History Museum ric changes sensu Gould 1966). Most obvious is a negative
in Vienna, Burgring 7, Vienna 1010, Austria allometry in the dimensions of the caudal fin. The distinctly
3
Center for Health and Bioresources, Austrian Institute larger dorsal lobe in juveniles is an indicator of ontogenetic
of Technology, Seibersdorf, Austria change in the kinematics of swimming during ontogeny
4
Department of Limnology and Bio‑Oceanography, University (Lingham-Soliar 2005; Irschick and Hammerschlag 2015;
of Vienna, Althanstrasse 14, Vienna 1090, Austria Fu et al. 2016).
5
Biological and Environmental Science and Engineering Such allometric changes during ontogeny are closely
Division (BESE), King Abdullah University of Science linked to ecological demands (Gisbert 1999; Gratwicke
and Technology (KAUST), Thuwal, Saudi Arabia
13
Vol.:(0123456789)
72                                                                                                 Zoomorphology (2020) 139:71–83

et al. 2006; Lingham-Soliar 2005). Especially the anterior         Materials and methods
(feeding, respiration) and posterior (locomotion) parts of
the body of many fish species show distinct ontogenetic            This study is mainly based on a review of the literature
allometry (Gisbert 1999; Irschick and Hammerschlag                 on juvenile, subadult and adult Cetorhinus maximus.
2015). Contrary to isometric growth, these changes drive           Overall, we reviewed 52 publications for morphologi-
the shape of morphological structures related to, e.g., feed-      cal information on body shape of basking sharks. Of
ing and locomotion and thus ensuring the survival of early         these, only 15 publications provided data other than total
ontogenetic stages occupying a distinct ecological niche           length or estimations of the size from sightings, which
(Reiss and Bonnan 2010; Richardson et al. 2011; Higham             were not included in our analysis. Finally, we retrieved
et al. 2018). More specifically, the differences in the shape      data from following 11 studies: Bigelow and Schroeder
of the caudal fins in the tiger and in the white shark are         (1948), Mathews and Parker (1950), Springer and Gil-
believed to relate to a shift in swimming mode in search           bert (1976), Casadevall and Escriche (1987), Tomaś and
for prey seemingly require a change in locomotor abil-             Gomez (1989), Izawa and Shibata (1993), Soldo et al.
ity (Irschick and Hammerschlag 2015). Indeed, younger              (1999), Lipej et al. (2000), Capapé et al. (2003), Ali et al.
individuals hunt small, agile prey (e.g., fishes). Older and       (2012) and Lipej and Mavrič (2015). Additionally, the
larger individuals show a slow swimming mode in search             data of a very small and young specimen stored at the
for predominantly large prey (e.g., marine mammals)                Naturhistorisches Museum Wien (NMW) (register number
(Lingham-Soliar 2005).                                             NMW 94393) are presented. The numbers of individuals
    Reaching a total length of more than 10 m, the basking         (n) assessed, and the numerical distribution of data points
shark, Cetorhinus maximus (Gunnerus 1765) is the second            over measured distances and size classes are presented in
largest extant fish species (Kunzlik 1988), exceeded only          Table 1.
by the whale shark Rhincodon typus Smith 1828 (> 16 m)                Including our measurements from the Vienna specimen,
(Pauly 2002). Both species are filter feeders and ovovivipa-       we were able to compile a data set of overall 29 speci-
rous (Kunzlik 1988; Compagno 2002; Sims 2008).                     mens which we grouped into three distinct size classes
    Only few datasets of body proportions are available for        (reflecting ontogeny): size class one (hereafter termed
adult basking sharks, but even fewer (only three) for juve-        “juveniles”), ranging from 207 to 260 cm TL (mean
nile specimens (Izawa and Shibata 1993; Lipej and Mavrič           233 ± 28.0 cm SD; n = 4); size class two (“subadults”),
2015). In this study, we present information of body meas-         ranging from 299 to 490 cm TL (380 ± 66.7 cm; n = 8);
urements of a fourth, very young specimen of C. maximus,           and size class three (“adults”), ranging from 541 to 871 cm
a juvenile female of 207 cm total length (TL) deposited at         TL (782 ± 89.3 cm; n = 16) (Table 2; Tables S1–S3). In
the Naturhistorisches Museum Wien (Vienna, Austria). The           the following, we use the terms “juveniles”, “subadults”
age of basking sharks of 250 cm TL is estimated to be about        and “adults”. Information on sex and ontogenetic allom-
6 months (Izawa and Shibata 1993; Lipej et al. 2000). Since        etry were available for most of the 28 specimens (Tables
juvenile basking sharks measure already 160–180 cm (and            S1–S3). Absolute (cm) and relative measurements (% TL)
possibly even more) at birth (Kunzlik 1988; Compagno               of all specimens are presented in Table 2.
2002; Sims 2008), we assume that the Vienna specimen                  The juvenile female basking shark (pelvic fins without
was only a few months old when captured. It constitutes the        claspers) deposited at the Natural History Museum Vienna
smallest basking shark known to date. Using morphological          was collected in the Mediterranean Sea. The exact col-
data from three size classes (juveniles, subadults, adults)        lection station is unknown. The specimen arrived at the
extracted from the extant literature, we examined if negative      museum between 1880 and 1900. It was preserved in 75%
allometric changes as described for large predatory sharks         ethanol and stored in a cylindrical storage glass container.
adapted to a long-distance slow swimming mode also occur           Due to its length, the specimen was bent two times, one
in the large filter feeding basking shark which exhibits a         time at the snout and the second time immediately ante-
similar swimming mode (Lingham-Soliar 2005; Sims 1999,             rior to the pelvic fins to fit the container (Fig. 1a, b). It
2008; Irschick and Hammerschlag 2015). Such observed               was not possible to unfurl it without potentially inflict-
allometric change can be used to infer unobserved (putative)       ing damage. Therefore, all measurements along the body
life history changes, such as function and behavior (LaBar-        axis exceeding these bending marks constitute composite
bera 1989; Carrier 1996; Lingham-Soliar 2005; Gratwicke            measurements between given points. Furthermore, the
et al. 2006; Carlisle et al. 2015). Thereby, inferring life his-   skin showed signs of shrinkage due to preservation. Nev-
tory from ecomorphological approaches may add valuable             ertheless, because of the extremely rare documentation of
insight into the life history of animals that are challenging to   young basking sharks of this size, we included the meas-
study in their natural habitat, including large roving sharks      urements into the dataset.
such as the basking shark.

13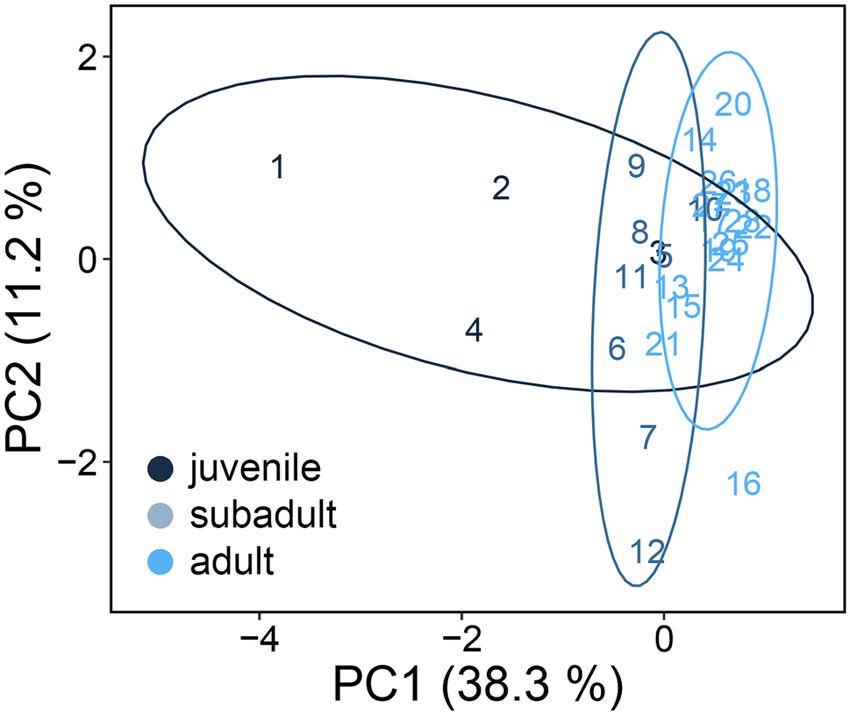
Zoomorphology (2020) 139:71–83                                                                                                    73

Table 1  Measured distances and their abbreviations on body, head     to retrieve a series of measurements for comparison from
and fins and the number of data points                                the available data. The most significant source we used is
                                  Abbreviations Number of data        Matthews and Parker (1950), who provided measurements
                                                points                of five adult males and five adult females (Table S1). Due
                                                N    JU SA AD         to this significant contribution, we have added our meas-
                                                                      urements accordingly. For instance, Matthews and Parker
Measurements                                    28   4   8    16      (1950) did not state the preorbital length from the tip of the
Precaudal length                  preCL         10   3   3     4      snout to the anterior margin of the orbit, but rather measured
Preanal length                    preAL         15   3   1    11      to the center of the eye. Since the eye of adult basking sharks
Presecond dorsal length           preD2L        19   3   3    13      is very small (0.8% of the TL), we included these data into
Prepelvic length                  preVL         16   3   2    11      our preorbital dataset. Other distances like the TL or the
Prefirst dorsal length            preD1L        22   3   4    15      length of the first dorsal fin were not explicitly stated in
Prepectoral fin length            prePL         18   3   3    12      Matthews and Parker (1950). We, therefore, reconstructed
Head length                       HL            18   3   2    13      the TL by combining the two distances “Centre of caudal
Prebranchial length               preBraL       15   3   1    11      emargination to tip of dorsal fluke” to “Tip of snout to cau-
Prespiracular length              preSpirL      13   2   1    10      dal emargination”. The length of the first dorsal fin base we
Eye length (horizontal)           EyeL          10   3   3     4      retrieved by subtracting the distance “tip of snout to anterior
Preorbital length                 preOrbL       20   3   4    13      end of base” from “tip of snout to posterior end of base”.
Prenarial length                  preNarL        7   2   3     2          One measurement which is commonly absent in the mor-
Preoral length                    preOraL       17   3   3    11      phometric characterization of basking sharks is the head
Mouth width                       MouthW         7   1   3     3      width, which is, however, an important morphometric char-
Internarial distance              intNarD        8   2   3     3      acter. In basking sharks head, width measurements are not
Dorsal caudal margin              dorsCMarg     14   3   7     7      straightforward due to the sheer size of their gill slits. As
Preventral caudal margin          prevCMarg      9   1   2     6      the gill membranes will collapse and extend laterally once
Upper postventral caudal margin   uppPCMarg     14   3   –    11      the shark is outside the water, head width will ultimately
Lower postventral caudal margin   lowPCMarg     13   2   –    11      be affected. This is probably the reason why head width is
Terminal caudal lobe              termCLobe     11   1   –    10      generally a feature missing in basking shark datasets. As the
First dorsal base                 D1Base        20   2   5    13      gill membranes were deformed due to storage in the Vienna
First dorsal height               D1Height      11   3   8     2      specimen, we excluded this measurement from our data.
Second dorsal base                D2Base        13   2   7    11          Although adult basking sharks can commonly be
Second dorsal height              D2Height      12   3   8     1      observed in boreal to warm temperate marine waters, obser-
Bold numbers refer to the total (N) of juvenile (JU), subadult (SA)   vations of juveniles < 300 cm in situ are rare (Kunzlik 1988;
and adult (AD) specimens used in this study                           Compagno 2002). Further, only few datasets of body pro-
                                                                      portions are available for adults, but even fewer (only three)
                                                                      for juvenile specimens ranging from 217 to 260 cm in total
General notes to morphometrics                                        length (Izawa and Shibata 1993; Lipej et al. 2000; Lipej and
                                                                      Mavrič 2015). Similarly, for adult basking sharks, detailed
We are aware that our dataset of basking sharks, nearly               measurements were rarely reported. This is mostly due to the
completely retrieved from the literature, is a composition of         fact that decomposition is commonly too far progressed in
measurements done by several authors. In the present paper,           the majority of specimens washed ashore dead (e.g., Hernán-
however, we focus on long distances like head and trunk               dez et al. 2010; Fahmi and White 2015) or incidentally cap-
size along with length of the caudal fin. Therefore, because          tured in gill nets (e.g., Soldo et al. 1999; Hernández et al.
of the sheer size of the specimens investigated, we assume            2010; Ali et al. 2012), not permitting detailed morphological
that observer bias will be minimal, and will have no major            assessments. In some instances, too little time is allocated
effects on our results (all measurements provided in the sup-         to the investigation of captured specimens, as fishermen
plementary material as Tables S1–S3).                                 need to process the flesh. Therefore, often only the long
   Measurements and their nomenclature follow the second              large morphological distances, such as total length (TL),
volume of the revised and updated version of the origi-               precaudal length, or head length were taken in these cases
nal FAO Catalogue of sharks of the world, “Sharks of the              (Soldo et al. 1999; Capapé et al. 2003; Kabaskal 2013).
world, volume 2” (Compagno 2002) (Fig. 2; Table 1). Since             As a result, only a limited dataset of body proportions for
these standards were not available to publications prior to           adult (Mathews and Parker 1950; Ali et al. 2012), subadult
1984, some measurements are missing in these studies or               (Bigelow and Schroeder 1948; Springer and Gilbert 1976;
other landmarks were used. Nevertheless, it was possible              Capapé et al. 2003), and juvenile (Izawa and Shibata 1993;

                                                                                                                          13
74 Zoomorphology (2020) 139:71–83
Table 2 Body proportions of Measurement Juveniles Subadults Adults
juvenile, subadult and adult
specimens of Cetorhinus Number of specimens (n = 24) n=4 n=8 n = 16
maximus
Total length (TL) in cm 207–246 (233) 299–490 (380) 541–861 (782)
Individual code 1–4 5–12 13–28
Head measures (%TL)
Head length 27.5–30.4 (28.6 ± 1.6) 25.3–28.3 (26.8 ± 2.1) 18.6–25.5 (22.9 ± 1.7)
Prebranchial length 20.7–24.0 (22.7 ± 1.8) 13.2 (13.2) 12.4–15.6 (13.2 ± 0.9)
Prespiracular length 14.2–16.6 (15.4 ± 1.7) 14.4 (14.4) 9.0–12.2 (10.7 ± 0.8)
Eye length (horizontal) 1.0–1.7 (1.3 ± 0.4) 0.7–1.0 (0.9 ± 0.2) 0.7–0.9 (0.8 ± 0.9)
Preorbital length 7.5–9.9 (8.3 ± 1.4) 5.5–9.4 (7.3 ± 1.6) 4.6–5.6 (5.1 ± 0.3)
Internarial space 2.1–3.4 (2.8 ± 0.9) 2.7–4.3 (3.3 ± 0.9) 1.9–3.3 (2.6 ± 0.7)
Prenarial length 5.7–5.8 (5.8 ± 0.1) 1.8–7.4 (3.8 ± 2.6) 2.6–4.0 (3.3 ± 1.0)
Mouth width 12.0 (12.0) 13.0–15.7 (14.2 ± 1.4) 9.1–13.6 (11.0 ± 2.3)
Preoral length 7.5–8.7 (8.2 ± 0.6) 6.5–7.1 (6.5) 3.6–5.0 (4.5 ± 0.4)
Body measures (%TL)
Precaudal fin length 73.7–78.7 (76.3 ± 2.5) 77.6–78.9 (78.3 ± 0.9) 79.8–85.4 (83.4 ± 2.6)
Preanal fin length 65.5–69.7 (69.4 ± 3.8) 72.1 (72.1) 55.8–70.5 (67.6 ± 4.1)
Presecond dorsal fin length 63.6–68.0 (65.6 ± 2.2) 64.4–73.5 (67.6 ± 4.1) 61.8–68.8 (63.8 ± 2.1)
Pre ventral (pelvic) fin length 51.9–55.9 (54.9 ± 2.6) 55.6–56.6 (56.1 ± 0.7) 39.7–56.2 (54.4 ± 1.4)
Prefirst dorsal fin length 37.1–41.7 (39.7 ± 2.4) 36.3–41.4 (38.5 ± 2.5) 31.1–38.0 (34.9 ± 2.2)
Prepectoral fin length 24.4–29.4 (27.1 ± 2.5) 24.1–27.4 (25.9 ± 2.5) 16.9–26.2 (23.7 ± 1.2)
Fin measures (%TL)
Dorsal caudal fin margin 22.1–28.0 (26.2 ± 2.8) 18.4–23.3 (21.0 ± 1.7) 16.4–21.1 (19.8 ± 1.6)
Upper postcaudal margin 14.0–23.4 (17.8 ± 5.0) 9.2–13.4 (11.6 ± 1.2)
Pre ventral caudal fin margin 14.0 (14.0) 11.6–13.9 (12.8 ± 1.6) 8.2–16.0 (12.6 ± 2.6)
Lower postcaudal margin 8.0–9.6 (8.8 ± 1.1) 8.2–11.1 (9.3 ± 2.2)
Terminal caudal lobe 5.5 (5.5) 2.9–5.9 (3.8 ± 0.9)
First dorsal fin-base length 7.7–8.7 (8.2 ± 0.7) 7.9–10.2 (9.1 ± 0.9) 8.0–12.3 (9.5 ± 1.2)
First dorsal fin height 8.1–10.0 (8.8 ± 1.0) 7.5–10.6 (9.1 ± 1.0) 6.4–12.9 (9.7 ± 4.6)
Second dorsal fin-base length 2.8–3.3 (3.1 ± 0.1) 2.2–3.4 (2.9 ± 0.4) 2.2–4.7 (3.2 ± 0.6)
Second dorsal fin height 2.8–3.1 (2.9 ± 0.2) 2.2–3.4 (2.9 ± 0.4) 4.3 (4.3)
Values are range and, in parentheses, mean and standard deviation. For the literature from which data
where retrieved see “Materials and methods”. Additionally the measurements of a juvenile specimen
(NMW 94393) deposited at the Naturhistorisches Museum in Wien were included. For measurements of all
28 specimens, see Tables S2–S4
Lipej and Mavrič 2015) basking sharks was available for the Statistical analysis
present investigation.
Out of 100 observations of basking sharks in the Adriatic Prior to all analyses, all traits were standardized to rela-
Sea, only 6% were on specimens smaller than 300 cm TL tive values by dividing each trait by the total length of
(Lipej and Mavrič 2015). Indeed, morphological data on the respective specimen (% of TL). Due to the issues out-
very young basking sharks are extremely rare. To date, mor- lined above and the resulting scarcity of measurements,
phological data of only three specimens of a size < 260 cm the sample sizes for some trait/size class combinations
are known (Izawa and Shibata 1993; Lipej et al. 2000; Lipej is very small, ruling out the use of most commonly used
and Mavrič 2015), including the Vienna specimen presented statistical analyses. Nevertheless, to statistically corrobo-
in the current study. rate our conclusions, we performed multiple t tests with
Ontogenetic allometry is the relationship between size Bootstrapping (1000) for all traits with at least three meas-
and shape across different age stages. Generally, two types urements within a size class. We are aware of the problems
(directions) of allometry are discerned: (1) positive allom- associated with small sample sizes, such as poor statis-
etry—the relative size increases; (2) negative allometry—the tical power. However, although under discussion, some
relative size decreases. Contrary to allometry, in isometry researchers support the use of t tests at very low sample
the relative size is maintained (Gould 1966). sizes (e.g., de Winter 2013).
13Zoomorphology (2020) 139:71–83 75
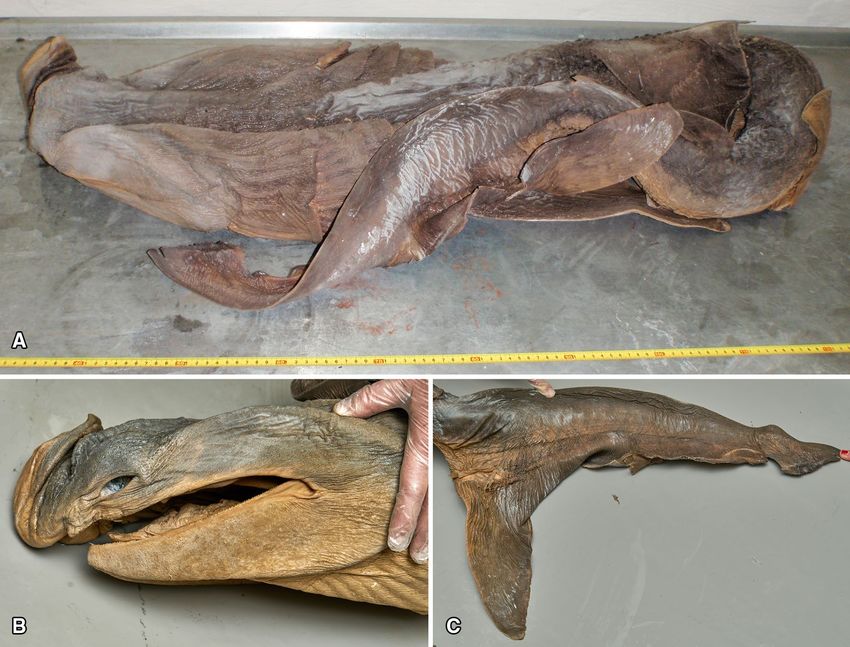
Fig. 1 Cetorhinus maximus (NMW 94393), juvenile female, 207 cm to fit in a cylindrical storage glass container. a Specimen in dorso-
TL. Due to its length, the specimen was bent two times, one time at lateral view. b Head in lateral view (snout upturned due to storage).
the snout and the second time immediately anterior to the pelvic fins c Caudal fin
To reveal possible allometric changes of morphological To visualize whether the age groups can be separated based
traits and their directions (i.e., positive or negative allom- on the body measurements we have conducted a principal
etry) we conducted linear regression analyses for all traits. component analysis (PCA) using the prcomp function imple-
As the regression integrates over all samples within a trait, mented in R (version 3.5.1). We used standardized values (i.e.,
the slope of the regression line and the coefficient of deter- divided by the total length) and replaced missing values with
mination (R2) constitute a valuable addition to the t tests the mean for each trait.
and may provide a more reliable indication of positive or We want to encourage all readers to cautiously interpret the
negative allometry in cases where sample sizes were low here presented statistical results and suggest that the provided
within one or more size classes. We are aware that low sam- p-, R2-, or mean values should best be considered as indicators
ple sizes may cause problems for linear regression analysis, of certain ontogenetic trends that should be assessed in combi-
as the slope may be affected by single values or outliers nation. Nevertheless, we think that the rarity of morphometric
within size classes. Furthermore, ontogenetic changes may data available for this species and available data justifies our
be non-linear. However, we are confident that, even though approach.
the results for some individual traits may not be very inform- Statistical analyses were conducted using SPSS Statistics 23
ative, meaningful and robust conclusion may be drawn from (IBM Corporation, Armonk, NY). Regression analyses were
the synopsis of all traits and analyses. For instance, when conducted using SigmaPlot 12.5 (Systat Software Inc., San
all traits of a body region (e.g., the caudal fin) exhibit the Jose, CA).
same patterns (e.g., a negative slope), we can be confident
that an ontogenetic allometric trend is indeed biological, not
artificial (e.g., negative allometric growth of the caudal fin).
1376 Zoomorphology (2020) 139:71–83
Fig. 2 Morphometric characteristics of Cetorhinus maximus used in this study [following Compagno (2002)]. a Body measures. b Head meas-
ures. c Caudal fin measures
Results and positive allometry for all traits on the lower lobe of
the caudal find and the dorsal fin (Fig. 3). In most traits,
Size and body proportions the mean follows the line of the linear regression well,
however, in some cases deviations reveal a non-linear
Head, abdomen, dorsal fins and caudal fin exhibited rela- course of allometry. Hereby, rapid changes from juveniles
tive proportional changes with increasing TL in 26 meas- to subadults, but only minor changes from subadults to
ured traits (Table 2). Specifically, we observed negative adults, or vice versa, indicate an accelerated or slowed
allometry in all head traits, all but one body trait, as well down development in the respective trait.
as all measurements on the upper lobe of the caudal fin
13Zoomorphology (2020) 139:71–83 77
Fig. 3 Scatterplot of all traits with linear regression (solid line) and represents the smallest known measured individual. All traits are rela-
changes in mean values (grey diamonds and dashed line) for each size tive lengths calculated against the total length (TL). See Table 1 for
class. The star indicates the specimen stored at the NMW, which also abbreviations. Note that y-axes are differently scaled
Body measures length explained more than 70% of the variation. In contrast,
R2 values were low for all ventrally measured head traits
All but one body trait exhibited negative allometry (Fig. 3). (internarial distance, prenarial length, and mouth width).
R2 values were variable, ranging from 0.06 (preventral fin Statistically significant differences between size groups were
length) to over 0.50 (precaudal and predorsal fin 1 length). exclusively found between juveniles and adults in the traits
Significant differences between size groups were found for head, prebranchial, and preorbital length (Tables 2, 3, S2).
precaudal, prepelvic, and predorsal fin 1 length, with juve- Low sample sizes in the subadult size group impeded the
niles having longer relative trait lengths than subadults and calculation of p values, however, in some traits (esp. head,
adults. Significant differences were also found between sub- prebranchial, and eye length) the means suggests an acceler-
adults and adults in predorsal fin 1 length (Tables 2, 3, S1). ated course of allometry, with rapid changes from juveniles
to subadults and only small changes afterwards (Fig. 3).
Head measures
Caudal fin measures
All linear regressions of the head traits had negative slopes,
indicating negative allometry (Fig. 3). Generally, R2 val- The linear regressions showed negative allometry at all traits
ues were high, especially for prebranchial, prespiracular, measured on the upper lobe of the caudal fin, but positive
preorbital, and preoral length, for which the relative trait allometry at all traits on the lower lobe (Fig. 3). R2 values
1378
13
Table 3 Coefficients of the linear regression, mean, standard deviation (SD), sample size (n), and statistical analysis for all traits
Trait Lin. regression JU SA AD p value
2
b[0] b[1] R Mean SD n Mean SD n Mean SD n JU vs AD JU vs SA SA vs AD
Head length 28.5 − 0.72 0.37 28.6 ± 1.6 3 22.3 ± 4.3 2 22.9 ± 1.7 13 0.002 – –
Prebranchial length 23.9 − 1.31 0.72 22.7 ± 1.8 3 13.2 – 1 13.2 ± 0.9 11 0.002 – –
Prespiracular length 16.7 − 0.72 0.73 15.4 ± 1.7 2 14.4 – 1 10.7 ± 0.8 10 – – –
Eye length 1.3 − 0.08 0.46 1.3 ± 0.4 3 0.9 ± 0.2 3 0.8 ± 0.1 4 0.148 0.165 0.37
Preorbital length 9.2 − 0.51 0.70 8.3 ± 1.4 3 7.3 ± 1.6 4 5.1 ± 0.3 13 0.021 0.402 0.091
Internarial distance 3.2 − 0.08 0.05 2.8 ± 0.9 2 3.3 ± 0.9 3 2.6 ± 0.7 3 – – 0.361
Prenarial length 6.7 − 0.61 0.23 5.8 ± 0.1 2 3.8 ± 2.6 4 3.3 ± 1.0 2 – – –
Mouth width 14.5 − 0.42 0.17 12.0 – 1 14.2 ±1.4 3 11.0 ±2.3 3 – – 0.111
Preoral length 9.3 − 0.58 0.92 8.2 ± 0.6 3 6.8 ± 0.4 2 4.4 ± 0.4 11 0.001 – –
Precaudal fin length 73.0 − 1.46 0.71 76.3 ± 2.5 4 78.3 ± 0.9 2 83.4 ± 2.6 4 0.031 – –
Predorsal fin 1 length 42.1 − 0.94 0.59 39.7 ± 2.4 3 38.5 ± 2.5 5 34.6 ± 2.1 14 0.002 0.535 0.011
Predorsal fin 2 length 68.0 − 0.49 0.18 65.6 ± 2.2 3 67.6 ± 4.1 4 63.8 ± 2.1 12 0.215 0.473 0.084
Prepelvic fin length 28.4 − 0.65 0.38 27.1 ± 2.5 3 25.9 ± 2.5 2 23.1 ± 2.2 13 0.031 – –
Preventral fin length 56.3 − 0.38 0.06 54.9 ± 2.6 3 56.1 ± 0.7 2 53.2 ± 4.5 12 0.438 – –
Preanal fin length 72.0 − 0.65 0.11 69.4 ± 3.8 3 72.1 – 1 66.8 ± 5.3 11 0.339 – –
Dorsal caudal fin margin 25.5 − 0.80 0.33 26.2 ± 2.8 4 21.0 ± 1.7 7 19.8 ± 1.6 7 0.017 0.020 0.180
Preventral caudal fin margin 13.0 0.04 0.01 14.0 – 1 12.8 ± 1.6 2 13.4 ± 1.7 5 – – –
Upper postventral caudal fin margin 20.0 − 1.02 0.57 17.8 ± 5.0 3 0 11.6 ± 1.3 11 0.148
Lower postventral caudal fin margin 8.3 0.18 0.20 8.8 ± 1.1 2 0 9.9 ± 0.9 11 –
Terminal caudal fin lobe 6.4 − 0.32 0.40 5.5 – 1 0 3.8 ± 0.9 10 –
Length of base of dorsal fin 1 8.2 0.15 0.12 8.2 ± 0.7 2 9.1 ± 0.9 5 9.5 ± 1.2 13 – – 0.590
Height of dorsal fin 1 6.6 0.69 0.61 8.8 ± 1.0 3 9.1 ± 1.0 8 12.9 – 1 – 0.650 –
Length of base of dorsal fin 2 2.6 0.05 0.06 2.9 ± 0.1 2 2.9 ± 0.4 7 3.2 ± 0.6 11 – – 0.340
Height of dorsal fin 2 2.3 0.18 0.36 2.9 ± 0.2 3 2.9 ± 0.4 8 4.3 – 1 – 0.890 –
b[0]: offset; b[1]: slope; R2: coefficient of determination
Significant differences are denoted in bold font. Hyphens denote trait/size class combinations for which a calculation of the standard deviation or p value was not feasible because of too few
individuals within those groups (see also text for further information)
JU juveniles, SA subadults, AD adults
Zoomorphology (2020) 139:71–83Zoomorphology (2020) 139:71–83 79
were generally high for upper lobe traits, ranging from 0.33
to 0.57, and low for lower lobe traits (< 0.20). Significant
differences were only found for dorsal caudal fin margin,
with juveniles having higher relative lengths than subadults
and adults, which did not differ significantly (Tables 2, 3,
S3). As a consequence, the caudal fin of juvenile basking
sharks is less symmetric than in subadult and adult speci-
mens (Figs. 1c, 4).
Dorsal fin measures
Based on the linear regression, we found positive allometry
in the height and length of both dorsal fins. However, length
of dorsal fin base showed low R2 values and no significant
differences between size classes (Tables 2, 3, S3). In con-
trast, R2 values were high for dorsal fin height, but were
probably affected by the low sample size of adult individuals
(n = 1). No significant differences of dorsal fin height were Fig. 5 Principal component analysis of relative body measurements
found between size classes (Table 3). of basking shark specimens. Ellipses are 90% probability ellipses.
Numbers (individual code) correspond to Table 2 and, in detail, to
Age groups show a clear clustering in the PCA (Fig. 5). Tables S1–S3
Age groups primarily differ along PC1 while PC2 reflects
within-group variation. Younger fish were characterized by
higher values of most traits, such as head length or eye size; environmental constraints during growth. Therefore, allo-
larger fish had a greater precaudal length and lower post- metric growth not only closely matches specific ecological
caudal margin (for a biplot with all factors see Fig. S1). requirements but also allows shift in resource use, e.g., in
Within-group differences concerned measurements such as feeding (e.g., Gisbert 1999; Karachle and Stergiou 2011;
internarial space or mouth width. Variation in relative body and Richardson et al. 2011) and in locomotion (e.g., Mor-
measurements decreases with age. row 1950; Irschick and Hammerschlag 2015; and Higham
et al. 2018).
We observed negative allometry with increasing body
Discussion size for structures important for locomotion (caudal fin) and
for feeding (head). The observed allometric change can be
In the present study, we provide the most extensive compi- used to infer unobserved changes in life history, and may,
lation of morphometric measurements and features of three therefore, indirectly provide critical insight into strategies of
size classes of the basking shark, C. maximus, representing how species adjust to, e.g., different habitats or to different
three ontogenetic stages (juveniles, subadults and adults) to behavior as they grow during ontogeny (LaBarbera 1989;
date. Further, we provide the first morphological evidence Carrier 1996; Gratwicke et al. 2006; Carlisle et al. 2015).
for allometric change in some body regions of C. maximus We found strong negative allometry in the dorsal lobe of
during ontogeny. Contrary to isometry, allometric change the caudal fin. The results from dorsal caudal fin margin,
influences the relative shape of morphological structures this for which all size groups have high sample sizes, indicate
way ensuring that a fish is able to cope with the relevant pronounced changes early in ontogeny, i.e., from juveniles
Fig. 4 Stylized shape of the
caudal fin of a a juvenile and
b an adult basking shark. Note
less heterocercal shape of the
adult type and the relative short-
ening of the dorsal lobe during
ontogeny
1380 Zoomorphology (2020) 139:71–83 to subadults. This indicates a rapid decrease of relative cau- differences in trophic niches, but possibly also of a higher dal fin length with increasing body length, coinciding with predation pressure on juveniles than on adults (Carrier 1996; rapid development to a more symmetric caudal fin, contrary Irschick and Hammerschlag 2015). to head length, which exhibited a continuous change with As body size increases in pelagic sharks, tail beat fre- increasing TL. quency decreases, resulting in reduced swimming speed and Any change in the dimensions of the propulsion system hydrodynamic lift which is compensated for by a change in (tail and caudal fin) will ultimately affect speed, maneu- caudal fin morphology. This phenomenon has been observed verability, and acceleration (Webb 1984; Blake 2004). In in a variety of phylogenetic distant aquatic vertebrates such two large predatory sharks, the tiger shark G. cuvier and as sharks, billfishes or cetaceans but also in fossil groups the white shark C. carcharias, it is widely assumed that the such as placoderms and ichthyosaurs (summarized in Ferrón more heterocercal shape of the caudal fin in juveniles con- et al. 2017). Additionally, in large fast swimming lamniform veys the ability for greater relative swimming speed com- sharks, the compensation of lower buoyancy by increase in pared to adults (Lingham-Soliar 2005; Irschick and Ham- body size can also be reached by an increase in size of the merschlag 2015; Fu et al. 2016). Two potential benefits may, lipid-rich liver in combination with reduction in tissue den- therefore, arise in juveniles. First, escape behavior: negative sities (Gleiss et al. 2017). [As the head of lamniforms (and allometric growth may be an indication of a higher preda- other fast swimming pelagic vertebrates, e.g., scombrids or tion pressure on juveniles than on subadults and adults due dolphins) is conical, it is negligible as a lift generating struc- to differences in body size in large predatory sharks (Carrier ture (Thomson and Simanek 1977)]. In many shark species, 1996; Irschick and Hammerschlag 2015). In this context, the increase of liver volume is subject to positive allometry, the large caudal fin likely enables juvenile basking sharks to and thus increasingly contributing to buoyancy with increas- escape from large predators such as the white shark, or orca. ing size (Iosilevskii and Papastamatiou 2016; Gleiss et al. The large (assumed) size of the newborns (150–180 cm) 2017). Positive allometry of liver size was postulated for the (Kunzlik 1988; Compagno 2002; Sims 2008) makes them basking shark (Gleiss et al. 2017) with adults having livers already less vulnerable to smaller predators. Since com- making up 15–30% of total body volume (Lingham-Soliar mercial fishing vessels have only documented non-pregnant 2005; Sims 2008). Nevertheless, no information on liver vol- females, it is widely assumed that females give birth in deep ume is available for juvenile specimens, and only one meas- waters of remote areas (Fowler 2009; Campana et al. 2008), ure for subadult basking sharks [11.9% in a 375 cm specimen which would explain the rare sighting of juveniles (Kunz- (Kruska 2004)]. From this available literature, it is obvious lik 1988; Sims et al. 1997; Compagno 2002). It is assumed that the huge liver volume of basking sharks (Gleiss et al. that basking sharks segregate by sex or maturity (Campana 2017) can be highly variable (Lingham-Soliar 2005; Sims et al. 2008). The latter is indicated by a later appearance of 2008) and seemingly fluctuating, with specimens caught in young individuals (< 300 cm TL) than larger individuals areas of low plankton density having a reduced liver vol- (> 400 cm TL) during zooplankton blooms in coastal areas ume (Fairfax 1998). This high variability of liver volume (Sims et al. 1997). to total body mass reported for basking sharks supports the Second, energy expenditure: juveniles and adults share view that the liver holds nutritional reserve, and hence, its the same food source, and have similar limitations when volume may potentially strongly fluctuate in adult basking ram feeding (drag). Smaller specimens will have to main- sharks depending on availability of their patchily distributed tain a higher rate of tail beats, which might result in higher food source. The relative caudal fin length decreases rapidly, energetic expenditure (Bainbridge 1958; Webb 1984; Blake already reaching the adult shape with high aspect ratio in 2004). Possibly the more heterocercal fin mitigates some subadult basking sharks. Therefore, the development to a of the expenditure. After all, juveniles need their energy more symmetric caudal fin is possibly not as strongly cor- to grow. An energy-saving swimming mode may, therefore, related to the relative increase of liver mass than in other be of advantage. Nevertheless, this remains speculative and lamniform apex predators. But considering the lack of data needs to be tested. especially of non-adult specimens, the potential contribution The juveniles of predatory sharks prey on agile small of liver mass to hydrodynamic lift in basking sharks must animals (e.g., fish) (Irschick and Hammerschlag 2015; Fu remain speculative at this point. et al. 2016). This was supported by stomach content analysis The shape of the caudal fin of basking sharks is unique on juvenile white sharks, which prey on nearshore pelagic among lamniforms and can be considered “transitional” and benthic fishes (Weng et al. 2007). In contrast, a more between the plesiomorphic heterocercal type (e.g., sand symmetric caudal fin enables adults to cruise steadily for tiger shark or megamouth shark) and a nearly homocercal long distances in search for large prey (e.g., marine mam- type (e.g., short fin mako or lemon shark) (Kim et al. 2013). mals) (Lingham-Soliar 2005; Maia et al. 2012). Thereby, Considering (1) the rapid ontogenetic change of the caudal negative allometric growth may not only be an indication of fin to a fin type suited for sustained swimming, (2) a caudal 13
Zoomorphology (2020) 139:71–83 81
fin type unique among lamniform sharks, (3) a very elon- feeding, and locomotion, respectively, and might, therefore,
gated body cavity which contains the huge liver (Compagno have critical implications for energetic expenditure in these
2002), (4) an elongate, “cigar shaped” body (Kunzlik 1988) large pelagic sharks. As basking sharks start filter feeding
likely not altered in its hydrodynamic efficiency by the huge immediately after birth, changes in the shape of the caudal
liver as it is reported for large, fast swimming lamniform fin, however, are unlikely due to a shift in foraging behav-
sharks (Gleiss et al. 2017), and (5) an obligate ram feeding ior, as known for some large predatory shark species, but is
mode (in contrast, the whale shark and megamouth shark are possibly related to habitat shifts. To verify this assumption,
gulp or suction feeders), the basking shark seemingly occu- however, further studies on basking shark birthing grounds,
pies a rather unique position within the large pelagic marine as well as the early life history, physiology, and behavior
vertebrates from an ecomorphological point of view. Taken of juveniles will be required. Our study demonstrates that
together, these morphological traits have potentially highly while ecomorphological tools may not replace compre-
interesting ramifications for basking shark ecophysiology. hensive in situ studies on living animals, they can provide
It was also assumed that ontogenetic shift in prey and important insight into the life history of large roving animals
habitat of several shark species may reduce competition of that are challenging to study in their natural habitat, such
juveniles with adult conspecifics (Ebert 2002; Carlisle et al. as the basking shark, and may spark new venues for further
2015). This strategy might strongly apply to the basking research.
shark, a species in which juveniles and adults share the same
feeding mode (Kunzlik 1988; Compagno 2002; Sims 2008). Acknowledgements Open access funding provided by University of
Vienna.
Adult basking sharks maintain average cruising speeds
(with mouth closed) of about 1.1 m s−1 (Sims 2000, 2008). Funding No funding.
This cruising speed is on average about 26% faster compared
to large predatory sharks such as the white shark and the Compliance with ethical standards
mako shark Isurus oxyrinchus Rafinesque 1810, which on
average maintain 0.8 m s−1 when cruising, or almost twice as Conflict of interest The authors declare that the research was con-
fast as the blue shark Prionace glauca (Linnaeus 1758) and ducted in the absence of any commercial or financial relationships that
the tiger shark which both on average cruise at a speed of could be constructed as a potential conflict of interest.
0.6 m s−1 (Klimley et al. 2002; Bruce et al. 2006; Ryan et al. Ethical approval All applicable international, national, and/or institu-
2015). Additionally, the relative larger dorsal fins of adult tional guidelines for the care and use of animals were followed. This
specimens, especially the first dorsal fin, may aid against roll article does not contain any studies with human participants performed
during sustained swimming over long distances as has been by any of the authors.
reported for many fish species (e.g., Harris 1936; Lauder
and Drucker 2004; and Lingham-Soliar 2005) and cetaceans Open Access This article is distributed under the terms of the Crea-
(Fish 2004). tive Commons Attribution 4.0 International License (http://creativeco
mmons.org/licenses/by/4.0/), which permits unrestricted use, distribu-
The course of the mean in dorsal caudal fin margin sug- tion, and reproduction in any medium, provided you give appropriate
gests that in basking sharks, the caudal fin changes rapidly credit to the original author(s) and the source, provide a link to the
during early ontogeny (i.e., in the transition from juveniles Creative Commons license, and indicate if changes were made.
to subadults), but only slowly later on in specimens of about
300 cm total length. Interestingly, this happens to be the size
at which basking sharks are commonly observed. Indeed, References
observations of this size class were reported three times
more often compared to sightings of juvenile specimens Ali M, Saad A, Reynaud C, Capapé C (2012) Occurrence of bask-
ing shark, Cetorhinus maximus (Elasmobranchii: Lamniformes:
(Lipej and Mavrič 2015), which might be an indication of Cetorhinidae), off the Syrian coast (Eastern Mediterranean) with
habitat shift occurring at this size. We speculate that new- description of egg case. Acta Ichthyol Piscat 42:335–339. https://
born basking sharks, because they are vulnerable to preda- doi.org/10.3750/AIP2012.42.4.07
tory pressure by large predatory sharks or whales, remain in Bainbridge R (1958) The speed of swimming of fish as related to size
and to the frequency and amplitude of the tail beat. J Exp Biol
deep water or at least offshore for the first year(s) of their 35:109–133
life. However, as no, or only few measurements from sub- Bigelow HB, Schroeder WC (1948) Sharks. In: Tee-Van J, Breder CM,
adults were available for the other traits on the caudal fin, Hildebrand F, Parr AE, Schroeder WC (eds) Fishes of the western
conclusions have to remain speculative. North Atlantic. Mem Seares Found Mar Res 1. Yale University,
New Haven, pp 59–546
This study provides first morphologic evidence that Blake RW (2004) Fish functional design and swimming perfor-
allometric change occurs in different body regions of the mance. J Fish Biol 65:1193–1222. https : //doi.org/10.111
basking shark, C. maximus, during ontogeny. These body 1/j.1095-8649.2004.00568
regions, head and caudal fin, are first and foremost related to
1382 Zoomorphology (2020) 139:71–83
Bruce BD, Stevens JD, Malcolm H (2006) Movements and swimming and adjacent reefs. Eviron Biol Fish 76:191–210. https://doi.
behaviour of white sharks (Carcharodon carcharias) in Austral- org/10.1007/s10641-006-9021-8
ian waters. Mar Biol 150:161–172. https://doi.org/10.1007/s0022 Harris JE (1936) Roles of the fins in the equilibrium of the swimming
7-006-0325-1 fish. I. Wind-tunnel tests on a model of Mustelus canis (Mitchill).
Campana SE, Gibson J, Brazner J, Marks L, Joyce W, Gosselin J-F et al J Exp Biol 13:476–493
(2008). Status of basking sharks in Atlantic Canada. Canadian Hernández S, Vögler R, Bustamente C, Lamilla J (2010) Review of
Science Advisory Secretariat, Research Document 2008/004, vol the occurrence and distribution of the basking shark (Cetorhinus
66 maximus) in Chilean waters. Mar Biodivers Rec 3:ec7. https: //doi.
Capapé C, Hemida F, Bensaci J, Saïdi B, Bradaï MN (2003) Records org/10.1017/S1755267210000540
of basking sharks, Cetorhinus maximus (Gunnerus, 1765) (Chon- Higham TE, Seamone SG, Arnold A, Toews D, Janmohamed Z, Smith
drichthyes: Cetorhinidae) off the Maghrebin shore (Southern SJ, Rogers SM (2018) The ontogenetic scaling of form and func-
Mediterranean): a survey. Ann Ser Hist Nat 13:13–17 tion in the spotted ratfish, Hydrolagus colliei (Chondrichthyes:
Carlisle AB, Goldman KJ, Litvin SY, Madigan DJ, Bigman JS, Chimaeriformes): fins, muscles, and locomotion. J Morphol
Swithenbank AM, Kline TC Jr, Block BA (2015) Stable isotope 279:1408–1418. https://doi.org/10.1002/jmor.20876
analysis of vertebrae reveals ontogenetic changes in habitat in an Iosilevskii G, Papastamatiou YP (2016) Relations between morphol-
endothermic pelagic shark. Proc R Soc B 282:20141446. https:// ogy, buoyancy and energetics of requiem sharks. Roy Soc Open
doi.org/10.1098/rspb.2014.1446 Sci 3(10):160406
Carrier D (1996) Ontogenetic limits on locomotor performance. Phys Irschick DJ, Hammerschlag N (2015) Morphological scaling of body
Zool 69:467–488 form in four shark species differing in ecology and life history.
Casadevall M, Suñer Escriche D (1987) Some data on the capture Biol J Linn Soc (London) 114:126–135
of a specimen of Cetorhinus maximus (Gunner, 1756) (Pisces, Irschick DJ, Fu A, Lauder G, Wilga C, Kuno C-Y, Hammerschlag
Ceterohinidae) at L’Estartit (Torroella de Montgri, Mar Català). N (2017) A comparative morphological analysis of body and
Sci Gerund 13:149–151 (In Catalan with English and Spanish fin shape for eight shark species. Biol J Linn Soc (London)
abstracts) 122:589–604
Compagno LJV (2002) FAO Species Catalogue for Fisheries Purposes Izawa K, Shibata T (1993) A young basking shark, Cetorhinus maxi-
1. Sharks of the World. An annotated and illustrated catalogue mus, from Japan. Jpn J Ichthyol 40:23–245
of sharks known to date. Bullhead, mackerel and carpet sharks Kabaskal H (2013) Rare but present: status of basking shark, Cetorhi-
(Heterodontiformes, Lamniformes and Orectolobiformes), vol 2. nus maximus (Gunnerus, 1765) in Eastern Mediterranean. Ann
FAO Species Catalogue for Fisheries Purposes, Rome Ser Hist Nat 23:127–132
de Winter JCF (2013) Using the Student’s t-test with extremely small Karachle PK, Stergiou KI (2011) Mouth allometry and feeding habits
sample sizes. Practical assessment, research and evaluation 18:1– of some Mediterranean fishes. Acta Ichthyol Piscat 41:265–275.
12. Available online: http://pareon line. net/getvn. asp?v=18&n=10. https://doi.org/10.3750/AIP2011.41.4.02
Accessed 10 Oct 2018 Kim SH, Shimada K, Rigsby CK (2013) Anatomy and evolution of
Ebert DA (2002) Ontogenetic changes in the diet of the sevengill shark heterocercal tail in lamniform sharks. Anat Rec 296(3):433–442
(Notorynchus cepedianus). Mar Freshw Res 53:517–523. https:// Klimley A, Beavers S, Curtis T, Jorgensen S (2002) Movements and
doi.org/10.1071/MF01143 swimming behavior of three species of sharks in La Jolla Canyon,
Fahmi White WT (2015) First record of the basking shark Cetorhinus California. Environ Biol Fish 63:117–135
maximus (Lamniformes: Cetorhinidae) in Indonesia. Mar Biodiv- Kruska DCT (2004) The brain of the basking shark (Cetorhinus maxi-
ers Rec 8:e18. https://doi.org/10.1017/S1755267214001365 mus). Brain Behav Evol 32(6):353–363
Fairfax D (1998) The basking shark in Scotland. Natural History, Fish- Kunzlik PA (1988) The basking shark. Scottish Fish Pam 14:1–21
ery and Conservation. Tuckwell Press LaBarbera M (1989) Analyzing body size as a factor in ecology and
Férron HG, Martínez-Pérez C, Botella H (2017) Ecomorphological evolution. Ann Rev Ecol Syst 20:97–117
inferences in early vertebrates: reconstructing Dunkleosteus ter- Lauder GV, Drucker EG (2004) Morphology and experimental hydro-
relli (Arthrodira, Placodermi) caudal fin from palaeoecological dynamics of fish fin control surfaces. IEEE J Ocean Eng 29:556–
data. PeerJ 5:e4081. https://doi.org/10.7717/peerj.4081 571. https://doi.org/10.1109/JOE.2004.833219
Fish FE (2004) Structure and mechanics of nonpiscine control sur- Lingham-Soliar T (2005) Caudal fin allometry in the white shark
faces. IEEE J Ocean Eng 29:60–621. https://doi.org/10.1109/ Carcharodon carcharias: implications for locomotory perfor-
JOE.2004.8332193 mance and ecology. Naturwissenschaften 92:231–236. https://
Fowler SL (2009) Cetorhinus maximus. IUCN Red List of Threatened doi.org/10.1007/s00114-005-0614-4
Species 2009, e.T4292A10763893. https/ /doi.org/10.2305/IUCN. Lipej L, Mavrič B (2015) Juvenile basking shark Cetorhinus maximus
UK.2005.RLTS.T4292A10763893.en caught in waters off Piran (northern Adriatic). New Med Biodi-
Fu AL, Hammerschlag N, Lauder GV, Wilga CD, Kuo CY, Irschick DJ versity Rec. https://doi.org/10.12681/mms.1440
(2016) Ontogeny of head and caudal fin shape of an apex marine Lipej L, Makovec T, Orlando M (2000) Occurrence of the basking
predator: the tiger shark (Galeocerdo cuvier). J Morphol 277:556– shark, Cetorhinus maximus (Gunnerus, 1765), in the waters off
564. https://doi.org/10.1002/jmor.20515 Piran (Gulf of Trieste, Northern Adriatic). Ann Ser Hist Nat
Gisbert E (1999) Early development and allometric growth patterns 10:211–216
in Siberian sturgeon and their ecological significance. J Fish Biol Maia AMR, Wilga CAD, Lauder GV (2012) Biomechanics of loco-
54:652–852 motion in sharks, rays and chimeras. In: Carrier JC, Musick JA,
Gleiss AC, Potvin J, Goldbogen JA (2017) Physical trade-offs shape Heithaus MR (eds) Biology of sharks and their relatives. CRC,
the evolution of buoyancy control in sharks. Proc R Soc B Boca Raton, pp 125–151. https://doi.org/10.1201/b11867-8
284:20171345. https://doi.org/10.1098/rspb.2017.1345 Mathews LH, Parker HW (1950) Notes on the anatomy and biology
Gould SJ (1966) Allometry and size in ontogeny and physiology. Biol of the basking shark (Cetorhinus maximus (Gunner)). Proc Zool
Rev 4:587–640 Soc (London) 120:535–576
Gratwicke B, Petrocic C, Speight MR (2006) Fish distribution Morrow JE (1950) Allometric growth in the striped marlin, Makaira
and ontogenetic habitat preferences in non-estuarine lagoons mitsukurii, from New Zealand. Pac Sci 6:53–58
13Zoomorphology (2020) 139:71–83 83
Pauly D (2002) Growth and mortality of the basking shark Cetorhinus Soldo M, Peharda M, Onofri V, Glavić N, Tutman P (1999) New record
maximus and their implications for management of whale sharks and some morphological data of basking shark, Cetorhinus maxi-
Rhincodon typus. In: Fowler SL, Reed TM, Dipper FA (eds) Elas- mus (Gunnerus, 1765), in the eastern Adriatic. Ann Ser Hist Nat
mobranch biodiversity, conservation and management. Occ Paper 9:229–232
IUCN spec sure Comm vol 25, pp 129–208 Springer S, Gilbert PW (1976) The basking shark, Cetorhinus maxi-
Reiss KL, Bonnan MF (2010) Ontogenetic scaling of caudal fin shape mus, from Florida and California, with comments on its biology
in Squalus acanthias (Chondrichthyes, Elasmobranchii): a geo- and systematics. Copeia 1976:47–54
metric morphometric analysis with implications for caudal fin Thomson KS, Simanek DE (1977) Body form and locomotion in
functional morphology. Anat Rec 293:1184–1191 sharks. Am Zool 17(2):343–354
Richardson TJ, Potts WM, Santos CV, Sauer WHH (2011) Ontoge- Tomaś ARG, Gomes UL (1989) On the presence of the basking shark,
netic shift and morphological correlates for Diplodus capensis Cetorhinus maximus (Gunnerus, 1765) (Elasmobranchii, Cetorhi-
(Teleostei: Sparidae) in southern Angola. Afr Zool 46:280–287 nidae), in the southeastern and southern Brazil. Boletim do Insti-
Ryan LA, Meeuwig JJ, Hemmi JA, Collin SP, Hart NS (2015) It is just tuto de Pesca 16:111–116 (In Portuguese with English abstract)
size that matters: shark cruising speeds are species-specific. Mar Webb PW (1984) Body form, locomotion and foraging in aquatic ver-
Biol 162:1307–1318. https://doi.org/10.1007/s00227-015-2670-4 tebrates. Am Zool 24(1):107–120
Sims DW (1999) Threshold foraging behavior of basking sharks on Weng KC, O’Sullivan JB, Lowe CG, Winkler CE, Dewar H, Block BA
zooplankton: life on an energetic knife-edge? Proc R Soc Lond B (2007) Movements, behavior and habitat preferences of juvenile
266:1437–1443. https://doi.org/10.1098/rspb.1999.0798 white sharks Carcharodon carcharias in the eastern Pacific. Mar
Sims DW (2000) Filter-feeding and cruising swimming speeds of bask- Ecol Prog Ser 338:211–224. https://doi.org/10.3354/meps338211
ing sharks compared with optimal models: they filter-feed slower
than predicted for their size. J Exp Mar Biol Ecol 249(1):65–76 Publisher’s Note Springer Nature remains neutral with regard to
Sims DW (2008) Sieving a living: a review of the biology, ecology and jurisdictional claims in published maps and institutional affiliations.
conservation status of the plankton-feeding basking shark Cetorhi-
nus maximus. Adv Mar Biol 54:171–220. https: //doi.org/10.1016/
S0065-2881(08)00003-5
Sims DW, Fox AM, Merrett DA (1997) Basking shark occurrence off
south-west England in relation to zooplankton abundance. J Fish
Biol 51(2):436–440
13You can also read