Estimating the size of the Dutch breeding population of Continental Black-tailed Godwits from 2007-2015 using resighting data from spring staging ...
←
→
Page content transcription
If your browser does not render page correctly, please read the page content below
Estimating the size of the Dutch breeding population of
      Continental Black-tailed Godwits from 2007–2015
       using resighting data from spring staging sites
 Rosemarie Kentie1,*, Nathan R. Senner1,2, Jos C.E.W. Hooijmeijer1, Rocío Márquez-
Ferrando3, Jordi Figuerola3, José A. Masero4, Mo A. Verhoeven1, & Theunis Piersma1,5

                                 Kentie R., Senner N.R., Hooijmeijer J.C.E.W., Márquez-Ferrando R., Figuerola
                                 J., Masero J.A., Verhoeven M.A. & Piersma T. 2016. Estimating the size of the
                                 Dutch breeding population of Continental Black-tailed Godwits from 2007–2015
                                 using resighting data from spring staging sites. Ardea 114: 213–225.
                                 doi:10.5253/arde.v104i3.a7

                                 Over the past 50 years, the population of Continental Black-tailed Godwits
                                 Limosa limosa limosa breeding of the East Atlantic Flyway has been in steep
                                 decline. This decline has previously been documented in trend analyses and six
                                 Netherlands-wide count-based population estimates, the last of which was
                                 completed in 1999. We provide an updated population size estimate and
                                 describe inter-annual fluctuations in the population between 2007 and 2015. To
                                 generate these estimates, we integrated a mark-recapture survival analysis with
                                 estimates of the densities of colour-marked individuals at migratory staging sites
                                 with known proportions of Continental and Icelandic L. l. islandica Black-tailed
                                 Godwits within a Bayesian framework. The use of these analytical techniques
                                 means that, in contrast with earlier efforts, our estimates are accompanied with
                                 confidence intervals, allowing us to estimate the population size with known
                                 precision. Using additional information on the breeding destination of 43 godwits
                                 equipped with satellite transmitters at Iberian staging areas, we found that 87%
                                 (75–95% 95% CI) of the nominate subspecies in the East Atlantic Flyway breed
                                 in The Netherlands. We estimated that the number of breeding pairs in The
                                 Netherlands has declined from 47,000 (38,000–56,000) pairs in 2007 to 33,000
                                 (26,000–41,000) in 2015. Despite a temporary increase in 2010 and 2011, the
                                 population declined by an average of 3.7% per year over the entire period from
                                 2007–2015, and by 6.3% from 2011–2015. We conclude that investing in an
                                 intensive demographic programme at a regional scale, when combined with
                                 targeted resightings of marked individuals elsewhere, can yield population esti-
                                 mates at the flyway scale.

                                 Key words: population estimate, survival probability, mark-recapture, Bayesian
                                 framework, trend

                                 1
                                   Conservation Ecology Group, Groningen Institute for Evolutionary Life
                                 Sciences (GELIFES), University of Groningen, P.O. Box 11103, 9700 CC
                                 Groningen, The Netherlands; 2present address: Division of Biological Sciences,
                                 University of Montana, 32 Campus Drive, Missoula, Montana, USA, 59802;
                                 3
                                   Department of Wetland Ecology, Doñana Biological Station (EBD-CSIC), Avda.
                                 Américo Vespucio s/n, 41092 Seville, Spain; 4Conservation Biology Research
                                 Group, Department of Anatomy, Cell Biology and Zoology, Faculty of Sciences,
                                 University of Extremadura, Avenida de Elvas, Badajoz 06071, Spain;
                                 5
                                   NIOZ Royal Netherlands Institute for Sea Research, Department of Coastal
                                 Systems and Utrecht University, P.O. Box 59, 1790 AB Den Burg, Texel, The
                                 Netherlands;
                                 *corresponding author (r.kentie@rug.nl)
214 ARDEA 104(3), 2016
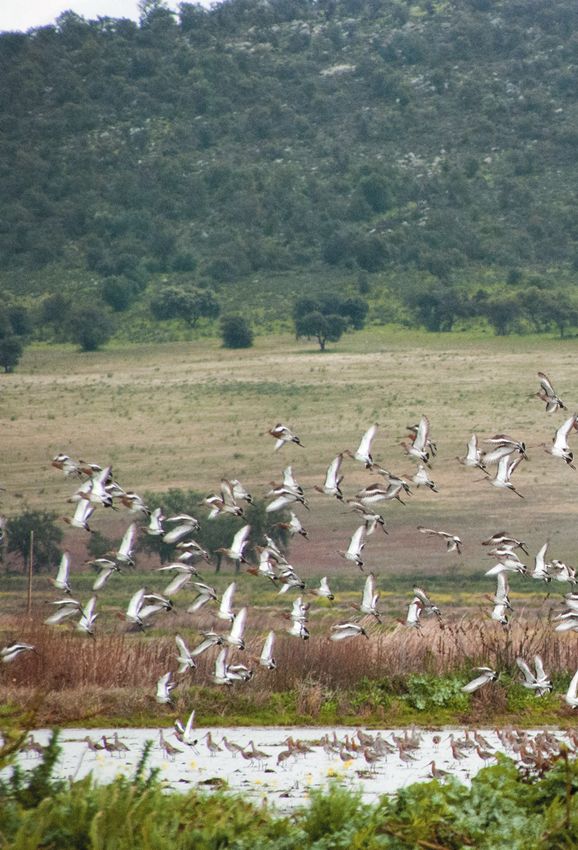
Staging Black-tailed Godwits in Extremadura, Spain, almost ready to depart to their breeding grounds (1 February 2010).
Estimates of population sizes are fundamental to size that does not necessitate complete coverage of a
conservation and management issues, as they indicate species’ range and is grounded on a clear set of assump-
whether a species should be listed as of conservation tions based on the mark-resight framework (Otis et al.
concern (Dawson et al. 2011, Donald & Fuller 1998, 1978). This method involves a four-step process: (1)
IUCN 2016). Estimates of population sizes over multiple marking individuals with unique combinations of
years also help to document trajectories of change, colour rings, (2) collecting data on the survival of these
which can play a role in risk assessments (Keith et al. colour-marked individuals so that the remaining
2015). Yet, estimating the population sizes of wide- numbers of marked individuals at a given time point
spread populations is often an arduous task, and esti- can be estimated, (3) determining the density of those
mates are often imprecise. The most common method colour-marked individuals at sites where they randomly
for estimating wader population sizes is to count con- mix with others from the larger population, and (4)
gregating individuals at as many locations as possible dividing the total number of colour-marked birds by the
during the same period of time each year (e.g. mid- proportion of colour-marked birds observed among all
winter; Underhill & Prys-Jones 1994, Yates & Goss- individuals (Gunnarsson et al. 2005, McClintock &
Custard 1991). This approach has a disadvantage, White 2012, Spaans et al. 2011). Mark-resight models
though, as individuals can be double-counted, flocks have been used to estimate the population size of
can be missed altogether (Rappoldt et al. 1985), and staging or stopover populations (Frederiksen et al.
site-use can be underestimated when turnover is high 2001, Lyons et al. 2015, Matechou et al. 2013), these
(Ganter & Madsen 2001, Loonstra et al. 2016). A com- models are less often used to estimate total population
mon alternative method for counting birds, are ‘atlas- size (but see Gunnarsson et al. 2005, Lourenço et al.
projects’. These projects, however, are often restricted to 2010b, Spaans et al. 2011), or used to estimate popula-
estimating only a limited part of a species’ total popula- tion size over time (but see Ganter & Madsen 2001).
tion size (Donald & Fuller 1998, Szabo et al. 2012). One of the limitations constraining the broader use
There is yet another method to estimate population of this method, especially in long-term studies, is thatKentie et al.: BLACK-TAILED GODWIT POPULATION SIZE IN THE NETHERLANDS 215
the number of marked birds alive at a given moment is generate precise annual estimates of the size of the
not precisely known and must be separately estimated Dutch-breeding populations of continental godwits and
with a mark-recapture survival analysis (White & to assess trends that can be used to guide future godwit-
Burnham 1999), unless the detection probability is related conservation and management activities.
equal to one. We therefore developed a model that esti-
mates the number of marked birds alive at a given
moment in time using a Cormack-Jolly-Seber (CJS) METHODS
model. To estimate the total population size, the CJS
model was integrated with a binomial model for counts Study species and study areas
of marked and unmarked birds. This is best done in a Continental Black-tailed godwits (hereafter: ‘godwits’,
Bayesian framework, which enables the likelihood esti- and ‘Icelandic godwits’ when referring to the Icelandic
mates from both models to be joined, making the final subspecies) are long-distance migrants that spend the
estimates of population size more precise than they nonbreeding season in West Africa and southern Spain
would be if they were analysed separately (Abadi et al. (Hooijmeijer et al. 2013, Márquez-Ferrando et al.
2010, Doak et al. 2005). 2014). During northward migration, large numbers of
We employ this method to generate yearly esti- godwits stage in Extremadura (39°01'N, 5°58'W) and
mates of the total population size of Continental Black- Doñana Wetlands (37°06'N, 6°10'W), Spain, and
tailed Godwits Limosa limosa limosa breeding in The coastal Portugal (38°55'N, 8°55'W), where they feed
Netherlands over the period from 2007–2015. As a efficiently on leftover rice kernels on agricultural fields
result of agricultural intensification, godwit reproduc- (Lourenço et al. 2010a, Lourenço & Piersma 2008,
tive success (Kentie et al. 2013, 2015, Schekkerman et Santiago-Quesada et al. 2009). From early March
al. 2008) and breeding population size have dropped
dramatically over the past 50 years (Gill et al. 2007).
Black-tailed Godwits are now labelled as ‘near-threat-
ened’ by the IUCN (2016), even though the Icelandic
subspecies Limosa limosa islandica is still increasing in
numbers (Gill et al. 2007). The most recent estimate of
the Dutch breeding population was generated from the
1999 Dutch Breeding Bird Atlas (Hustings et al. 2002) –
a new edition is currently being compiled (Schekker-
man et al. 2012) – and that only estimate of the total
continental godwit population size is from 2009
(Lourenço et al. 2010b). Given the rates of decline
previously documented in continental godwits (Gill et
al. 2007), updating these estimates is critical to on-
going conservation efforts.
To estimate the size of the Dutch breeding popula-
tion of Black-tailed Godwits, we used birds marked on
the breeding grounds in our core study area in south-
west Friesland from 2004 onwards in combination with
subsequent resightings of these individuals throughout
The Netherlands to estimate their yearly survival prob-
abilities. To couple these with estimates of the density
of colour-marked individuals at sites with known
proportions of continental and Icelandic godwits
(Lopes et al. 2012), from 2007 onwards we counted
marked and unmarked godwits at staging areas in Spain
and Portugal. Finally, we used data gathered from indi-
vidual godwits tagged with satellite transmitters at the
same Iberian staging areas (e.g. Senner et al. 2015) to
estimate the proportion of these godwits that bred in Black-tailed Godwits staging in Extremadura, Spain, flying up
The Netherlands. Taken together, this allowed us to after foraging in a rice field near Yelbes (9 February 2016).216 ARDEA 104(3), 2016
onwards, godwits arrive on their breeding grounds of godwits with a colour-ring combination from our
(Lourenço et al. 2011), where during the course of colour-marking scheme. If a flock was large, we some-
March and April they establish their territories and lay times made multiple scans of the flock, but from
a clutch of four eggs. different vantage points to minimize the risk of noting
Godwits are faithful to previous breeding sites and individuals more than once.
partners (Kentie et al. 2014). Their chicks are precocial From 2011 onwards, management in and around
and leave the nest within 24 hours after hatching the Giganta rice fields in the Tejo area changed, leaving
(Schekkerman & Boele 2009). After the cessation of the fields inundated with water throughout the godwit
parental care, adult godwits leave The Netherlands staging period (J.A. Alves pers. comm.). These changes
from early June onwards (with unsuccessfully breeding led to greater use of the area by Icelandic godwits. Such
individuals leaving earliest; Hooijmeijer et al. 2013). an influx likely ‘diluted’ the density estimates of
Juveniles prepare for migration slightly later, and often marked continental godwits at the site, because it was
gather in flocks in July and even August (Schekkerman not possible to exclude the Icelandic subspecies during
et al. 2014). Not all young godwits return to the the density measurements. For this reason, in our
breeding grounds in their second calendar year, and analyses we did not incorporate samples from the Tejo
some arrive only after the breeding period, probably as taken after 2011. As individuals with a colour-ring
prospectors (Kentie et al. 2014). However, it is not yet combination containing a lime flag included birds
known whether these prospecting individuals are using marked at the staging sites, and therefore consisted
staging areas during the same time period as do partly of Icelandic godwits, we excluded those as well.
godwits that move on to the breeding grounds for the
entire breeding season. Percentage of staging godwits breeding in The
As part of a long-term demographic study, we Netherlands
marked individual godwits with colour rings in south- In 2013–2015 we fitted satellite transmitters to 60
west Friesland, The Netherlands (52°55'N, 5°5'E; Kentie adult female godwits that were captured in mist nets at
et al. 2014). Additional godwits were marked during nocturnal roosts within Spanish (Extremadura: n = 45)
the breeding season elsewhere in The Netherlands. and Portuguese (Tejo: n = 15) staging sites (see Senner
Adults were captured on the nest and uniquely marked et al. 2015). We deployed solar-powered PTT-100s (9.5
with four plastic colour rings, a coloured flag, and a g) from Microwave Technology Inc. that were attached
numbered metal ring. Pre-fledging chicks captured at with a leg-loop harness made of 2 mm nylon rope; in
greater than 10 days of age were large enough to wear total, the attachment weighed c. 12 g for an average
a colour-ring combination: these comprise 47% of the loading factor of 3.43 ± 0.22% (±SE) of an individual’s
3499 individuals used in the analysis (Table 1). Smaller mass at the time of capture. We specifically targeted
chicks were given an engraved lime flag, but were not large, female godwits, as they were best able to accom-
included in the analysis. See Kentie et al. (2013) for modate the size of the transmitter. The location of each
more details on capture procedures. individual during the breeding period was used to
determine the proportion of godwits staging in Iberia
Density samples that bred in The Netherlands.
Starting in 2007, we monitored rice fields in Extrema-
dura, Spain, and the Tejo and Sado estuaries in Integrated model
Portugal for colour-marked godwits in January and We integrated the models estimating the number of
February of each year (Lourenço et al. 2010b, Masero et marked birds alive with those estimating the density of
al. 2011). From late winter 2010 we also began marked birds during the staging period into one
surveying Doñana National and Natural Park and its Bayesian model. To estimate the number of marked
surrounding area in southern Spain for colour-marked birds alive, we first estimated juvenile and adult
godwits (Márquez-Ferrando et al. 2014). The numbers survival with an age-dependent CJS based on resight-
of godwits occurring here at these times of year are ings at the breeding grounds. Nearly all godwits survive
considerable: approximately 25,000 in Extremadura the period between staging and breeding (Senner et al.
(Masero et al. 2011), 45,000 in Portugal (Lourenço et in prep.), which justifies the use of yearly survival
al. 2010b), and 28,000 in Doñana (Márquez-Ferrando estimated during the breeding period. Because we
et al. 2014). During the surveys we scanned the god- suspected high trap-dependence when including all
wits whose legs were clearly visible. For each scan, we godwits marked in The Netherlands outside of our core
noted the number of godwits scanned and the number godwit study area, we estimated survival only withKentie et al.: BLACK-TAILED GODWIT POPULATION SIZE IN THE NETHERLANDS 217
birds marked in our core study area in southwest used to estimate the total population size using the
Friesland, but included resightings of those individuals equation Nt ~ Kt / pbandt , where Nt is the total popula-
from across The Netherlands. Godwits equipped with tion size at time t, Kt is the number of marked birds
satellite transmitters were excluded from this analysis alive at time t, and pbandt is the proportion of marked
because their survival rate may be lower than that of birds seen at time t. We used the number of colour-
colour-marked individuals (Hooijmeijer et al. 2014, marked godwits per year, including godwits marked in
Senner et al. in prep.). The Netherlands outside our core study area, and
We first tested our mark-resighting data for multiplied these by our yearly survival rates to estimate
Goodness-of-Fit in U-CARE (Choquet et al. 2009). the marked population in year t. Because not all second
Because we already included age structure within our calendar year godwits may use the staging areas at the
model, we only tested for capture-heterogeneity times we took our density samples, we corrected for the
(test2.ct; Pradel et al. 2005), which was significant occurrence of young marked birds. To do so, we
(c29 = 17.8, P = 0.04). We therefore included indi- included within the Bayesian framework a binomial
vidual random effects for resighting probability p in our model which estimated the proportion of second
CJS model. We allowed p to vary between years and calendar year birds resighted at the staging sites. Of
included an additive age effect with two age classes, chicks marked before 2015, we resighted 26 individuals
because not all godwits return in their second calendar between 2009 and 2016 which were in their second
year (Kentie et al. 2014). For apparent survival (j), we calendar year, and 42 which were in their third
also included two age classes in the model and treated calendar year. We corrected for the mortality between
year as a random effect separately for each age class. second and third calendar year birds, by using the
By using year as a random effect, we were able to use mean adult survival estimated by the model. Because of
the survival estimate of the final year of the study (Kéry the necessity to correct for mortality with age, we
& Schaub 2012). We believe that our estimate abstained from using older age classes. Last, we esti-
approaches true survival for the following reasons: mated the population size of Dutch-breeding godwits
godwits are highly site-faithful (Kentie et al. 2014, van by integrating the proportion of godwits with satellite
den Brink et al. 2008), before and after breeding they tags that bred in The Netherlands, and corrected for the
forage and roost within or near our study area, and we proportion of Icelandic godwits (6.5%, n = 278; Lopes
used resightings from across The Netherlands. et al. 2012), both included as binomial models, and
Next, we used a binomial model to estimate a assumed that the proportion of second calendar year
yearly proportion of marked individuals in flocks at godwits passing through the staging areas were
each of the staging areas. This proportion was then breeding birds.
We ran JAGS (Plummer 2003) in the R statistical
platform (v. 3.2.3; R Core Team 2014) with the R2jags
Table 1. Number of marked Continental Black-tailed Godwits package (Su & Yajima 2015) to perform Markov Chain
with our colour ring scheme (excluding those with a lime flag Monte Carlo (MCMC) simulations for parameters esti-
colour), and number marked in southwest Friesland. mation. We used uninformative priors for all parame-
ters. We ran three parallel chains of 50,000 iterations
Number ringed with Number ringed in
our scheme southwest Friesland
with a burn-in of 10,000 and kept every 6th observa-
tion. We checked the R-hat for convergence of the
Year n adults n young n adults n young
model (in all but one cases < 1.01, with the random
2004 66 28 66 24 part of year dependent survival equalling 1.05).
2005 57 13 57 9 Estimations are presented as the posterior means with a
2006 104 55 46 22 95% credibility interval.
2007 143 102 124 46
2008 131 112 115 68
2009 218 124 134 38 RESULTS
2010 201 147 117 53
2011 119 189 65 41 From 2004–2015 we colour-marked 3499 godwits, of
2012 233 181 181 58 which we used 1891 godwits marked in southwest
2013 350 322 267 106 Friesland to estimate yearly adult and juvenile survival
2014 241 363 162 92 probabilities (Table 1). Adult survival was high (0.94,
0.85–1.00 95% CI) in the first year of the study, and the218 ARDEA 104(3), 2016
mean adult survival over the whole period was 0.85
1.0 (0.84–0.87; Figure 1). Juvenile survival probability
ranged between 0.30 in 2014 and 0.54 in 2010 with
0.8
apparent survival probability
relatively large credibility intervals (Figure 1), and the
mean juvenile survival was 0.34 (0.33–0.45). The
0.6 random year effect of juvenile survival was SD = 0.47
(0.09–1.00), and the random year effect of adult
0.4
survival was SD = 2.71 (1.71–4.31). The averaged
mean posterior resighting probability was 0.82
0.2
(0.80–0.85) for adults and 0.30 (0.21–0.39) for second
adult calendar year birds (Table S1). The individual resighting
juvenile random effect was SD = 1.34 (1.12–1.56). For all
0.0
2004 2006 2008 2010 2012 2014 parameter estimates see the Supplementary Material.
year Of the 60 godwits fitted with satellite transmitters
Figure 1. Apparent survival probability of adult and juvenile at the Iberian staging sites, 13 transmitters or godwits
Black-tailed Godwits obtained from the CJS in the Bayesian died before migration or did not migrate further, and
model. Posterior means and 95% credibility intervals are shown. 39 females established breeding territories in The
Netherlands. Moreover, two individuals appeared to be
Icelandic godwits. Excluding these two, 87% (75–95%)
200
of the tagged birds were Dutch breeding birds.
In total, we checked 420,206 godwits for colour-
population size (x 1000)
rings at Spanish and Portuguese staging sites (Table 2).
150
The density of colour-ringed godwits increased from
1/500 godwits in 2007 to 1/77 godwits in 2015. The
fraction of godwits in their second calendar year
100
passing through the staging sites in January and
February was 0.53 (0.36–0.74). The estimated popula-
tion size of godwits, including Icelandic godwits using
50 the Iberian rice fields, increased from 115,305
2007 2009 2011 2013 2015
(98,304–134,265) individuals in 2007 to 164,010
year (128,479–209,253) in 2011, before decreasing to
81,793 (66,973–98,309) in 2015 (Figure 2). The
Figure 2. Population size of Black-tailed Godwits Limosa limosa
limosa of the East-Atlantic Flyway based on colour ring densities annual growth rate from 2007–2015 was 3.7%, with
on the staging sites. These estimates include godwits from de the fastest decline occurring from 2011–2015 at 6.3%
Icelandic subspecies Limosa limosa islandica using Iberian rice per year. The Dutch breeding population in 2015 was
fields, which we assume to be 6.5% of the population size. estimated at 33,140 (26,031–41,303) breeding pairs.
Table 2. Number of Continental Black-tailed Godwits checked DISCUSSION
for colour rings at the staging sites in Spain and Portugal.
We estimated the total population size of Continental
Year Total birds checked
Black-tailed Godwits in the East-Atlantic Flyway, by
2007 136,623 estimating survival probabilities of colour-marked indi-
2008 65,222 viduals and then using the density of surviving colour-
2009 70,196 marked individuals observed at staging areas in Spain
2010 11,030 and Portugal. We could correct for the fraction of the
2011 16,395 islandica subspecies, which are staging on the Iberian
2012 17,914 rice fields and fish ponds, within the model. Although
2013 24,952 we found that 87% of continental godwits staging in
2014 67,638 Iberia breed in The Netherlands and that adult survival
2015 10,236 was relatively high from 2007–2015, during the course
of our study, the Dutch-breeding population declinedKentie et al.: BLACK-TAILED GODWIT POPULATION SIZE IN THE NETHERLANDS 219
140
they found resembled the proportion of Icelandic
godwits in rice fields estimated on the basis of ring
120 resightings (10%; Alves et al. 2010, 7.7%; Masero et al.
number of breeding pairs (x 1000)
2011). Two of the godwits we fitted with satellite trans-
100 mitters appeared to be Icelandic godwits (4.3%, 1.2–
14.2% CI), however, we targeted continental godwits
80 thus this proportion will be too low. However, if the
peak in godwit numbers in 2011 was only caused by an
60 increase in the proportion of Icelandic godwits at
40
Iberian staging sites, their proportion should have been
estimation
30% or higher. This we consider unlikely.
atlas count
20
The increase did correspond with high reproductive
trend-interpolation
this study success in at least part of the population’s breeding
0
1960 1970 1980 1990 2000 2010
range in 2010 (Kentie 2015). Nevertheless, if the popu-
year
lation increase was explained entirely by an increase in
godwit reproduction, godwit pairs would have been
Figure 3. Number of breeding pairs of Continental Black-tailed required to produce on average 0.61 chicks per year
Godwits in The Netherlands, based on estimations, atlas counts,
that survived to become breeders per year in 2009 and
interpolations, and this study (references: Bekhuis et al. 1987,
Bijlsma et al. 2001, Hustings et al. 2002, Mulder 1972, Osieck & 2010. Previous studies have found that godwit nest
Hustings 1994, Teixeira 1979, Teunissen et al. 2005, Teunissen success averages c. 50% (Kentie et al. 2015), with a
et al. 2012, van Dijk et al. 2005). When available, minimum and maximum of 69% on herb-rich meadows in 2008
maximum estimation or 95% CI are plotted. The lines are fitted (Kentie 2015), meaning that in an average year 30% of
with a local polynomial regression fitting (LOESS) in R, and
hatched chicks would have had to survive to the next
represent the mean and the 95% CI of the point estimates of the
number of breeding pairs. year, or 22% in a year with high nest survival. The
highest first-year survival, from nestling to second
calendar year bird, in our research area was 24%
by 3.7% per year, and this decline accelerated from (Kentie 2015), which occurred in herb-rich meadows in
2011–2015 to a rate of 6.3% per year. In total, we esti- 2010. However, in the grassland monocultures, where
mated that nearly 33,000 pairs of godwits currently the majority of godwits breed in The Netherlands, the
breed in The Netherlands, which is less than one third highest first-year survival was 14%. After 2011, the
of the number of pairs that bred there in the 1970s decline in godwit numbers happened so rapidly that
(Figure 3). In combination with the already steady only complete reproductive failures would make this
declines that have occurred over the past four decades, possible. We therefore conclude that a combination of
these recent, rapid declines suggest that drastic meas- changes in the proportion of Icelandic godwits and
ures are necessary to stop the disappearance of one of variation in continental godwit reproductive success is
the most iconic meadow bird species breeding in The likely to explain the temporary increase, and note that
Netherlands. the confidence intervals for the population estimates
One of the findings in our study is that in the midst between 2010 and 2012 were rather large.
of a steady population decline, the size of the breeding We estimate that there were 33,000 breeding pairs
population actually increased from 2009 to 2011, in The Netherlands in 2015. This estimate was based
before again declining from 2011–2015. The causes of on two other estimates. First, with information gath-
this increase could potentially result from two separate ered from godwits equipped with satellite tags at
processes. On the one hand, the increase might have Iberian staging sites, we estimated that 87% of the
been caused by an increasing proportion of Icelandic continental population breeds in The Netherlands. This
godwits using Iberian rice fields, as the Icelandic percentage falls within the range of previous findings,
godwit population has steadily grown over the past which were derived from comparisons of country-wide
three decades (Gill et al. 2007). We assumed a constant counts (Table 3). Second, we estimated that adult
proportion of Icelandic godwits of 6.5% at Iberian survival was around 85% throughout much of our
staging sites based on a DNA study of godwits caught in study, which corresponds closely with previous esti-
the rice fields of Extremadura between 2005 and 2008 mates from other Dutch study areas (Roodbergen et al.
(Lopes et al. 2012). That study found no increase in the 2008). Despite the close correspondence of these
proportion of Icelandic godwits, and the percentage underlying estimates with those from other published220 ARDEA 104(3), 2016
Table 3. Percentage of the East Atlantic Flyway Continental Flyway population — they breed nowhere else in such
Black-tailed Godwits breeding in The Netherlands. To define the large numbers (Piersma 1986, Thorup 2006) and are
flyway population, we included godwits breeding in Belgium, declining just as rapidly in most other countries in
United Kingdom, Germany, France, Spain, Italy, Luxembourg,
Austria, Sweden and The Netherlands. which they still breed (Gill et al. 2007, Thorup 2006).
Furthermore, previous work has identified low levels of
Year Percentage Source reproductive success to be the single most important
factor driving the decline (Schekkerman et al. 2008,
1970 91% Mulder (1972) Kentie et al. 2013, Roodbergen et al. 2012), which
1985 91% Piersma (1986) shows that factors operating in The Netherlands are
1990 90% Hötker et al. (1991) largely responsible for the declines that have occurred
1995 85% Beintema et al. (1995) thus far. Although enormous amounts of money and
2000 84% Thorup (2006) effort have been expended to conserve continental
2015 87% this study godwits (Kleijn et al. 2010), our findings make clear
that these have been ineffective or insufficient.
Initiatives leading to drastically improved management
studies, as well as the increased precision of our statis- are thus necessary to preserve one of the most iconic
tical estimates in relation to previous efforts, the upper species of the Dutch countryside before it becomes rele-
and lower 95% CI of our estimate ranged from 26,000 gated to a few small corners of its former range.
to 41,000, indicating that our estimates still include
some uncertainty.
More generally, with the Bayesian mark-resighting ACKNOWLEDGEMENTS
methodology presented here, we were able to estimate
We thank the godwit field crews of 2004–2015 for their invalu-
the numbers of Black-tailed Godwits using staging sites able assistance in the field, both in The Netherlands and abroad.
in Iberia with relatively tight confidence limits in most Land management organisations (It Fryske Gea and Staatsbos-
years. The benefit of this method is that the total fly- beheer) and private landowners organized in the Weidevogel-
way population can be estimated without the necessity collectief Súdwestkust generously gave permission to access
of surveying individuals across the entire breeding their properties. Miguel Medialdea (Veta la Palma fish farm),
José M. Abad-Gómez, Helena Silva Pinto (Reserva Natural do
range of Continental godwits. For populations that are Estuário do Tejo), Rui Alves (Companhia das Lezerias, S.A.),
not easily counted across breeding areas, but congre- Teresa Catry, Luisa Mendes, Alfonso Rocha and Jose Alves
gate at wintering or staging sites, such as many wader helped with logistics, tagging, and access to the staging sites.
species, this method may thus have considerable We thank Niko Groen, Pedro Lourenço, Dirk Tanger, Allert
advantages (Spaans et al. 2011). Moreover, when oper- Bijleveld, René Faber, Wim Tijsen, Bob Loos, Haije Valkema,
Gjerryt Hoekstra, Egbert van der Velde and Alice McBride for
ating a demographic monitoring programme, this
their additional density samples at the staging sites, and many
method makes it possible to track the population size more birdwatchers for colour-ring sightings across the flyway.
on a yearly basis with relatively low additional effort, We thank Eldar Rakhimberdiev and Tamar Lok for discussions
especially when compared with such intensive under- on the Bayesian model. Ruth Howison provided help by cura-
takings as breeding bird atlases. Nonetheless, there are ting and summarizing the data on tagged godwits. Tómas
Gunnarsson, Hans Schekkerman and Adriaan Dokter provided
potential drawbacks: for instance, our estimates of the
helpful feedback that greatly improved the first submitted
Continental Black-tailed Godwit population would version. This study was funded mainly by the former
have been more precise if continental and Icelandic Netherlands Ministry of Agriculture, Nature Management and
godwits did not mix in Iberia, or if we had temporal Food Safety, now subsumed in the Ministry of Economic Affairs,
estimates of the mixture of continental and Icelandic by the Province of Fryslân, and by the Spinoza Premium Award
godwits for the whole study period. 2014 from The Netherlands Organization for Scientific Research
(NWO) to TP, with some additional funding by the Prins
Bernard Cultuurfonds, the Van der Hucht Beukelaar Stichting,
Conclusion BirdLife Netherlands and WWF-Netherlands through Global
With a breeding population of 33,000 pairs in 2015, the Flyway Network and the Chair in Flyway Ecology, FP7-Regpot
Dutch godwit population has plummeted by nearly project ECOGENES (Grant No. 264125), the NWO-TOP grant
75% since the first nation-wide estimate of 120,000 ‘Shorebirds in space’ (854.11.004) awarded to TP, ExpeER
Ecosystem Research, ‘ICTS-RBD’ to the ESFRI LifeWatch,
pairs in 1967 (Mulder 1972, Figure 3). In spite of this,
MINECO, and European Union Structural Funds (AIC-A2011-
the agricultural grasslands of The Netherlands remain 0706). This work was done under license numbers 4339E and
the single most important stronghold for breeding 6350A following the Dutch Animal Welfare Act Articles 9 and
Continental Black-tailed Godwits in the East Atlantic 11.Kentie et al.: BLACK-TAILED GODWIT POPULATION SIZE IN THE NETHERLANDS 221
REFERENCES Hustings F., Vergeer J.-W. & Eekelder P. 2002. Atlas van de
Nederlandse broedvogels 1998–2000: verspreiding, aantal-
Abadi F., Gimenez O., Arlettaz R. & Schaub M. 2010. An assess- len, verandering. SOVON Vogelonderzoek Nederland, Beek-
ment of integrated population models: bias, accuracy, and Ubbergen.
violation of the assumption of independence. Ecology 91: IUCN 2016. The IUCN Red List of Threathened Species. Version
7–14. 2016-1. www.iucnredlist.org (accessed 30/6/2016)
Alves J.A., Lourenço P.M., Piersma T., Sutherland W.J. & Gill J.A. Keith D., Akçakaya H.R., Butchart S.H.M., Collen B., Dulvy N.K.,
2010. Population overlap and habitat segregation in Holmes E.E., Hutchings J.A., Keinath D., Schwartz M.K.,
wintering Black-tailed Godwits Limosa limosa. Bird Study Shelton A.O. & Waples R.S. 2015. Temporal correlations in
57: 381-391. population trends: Conservation implications from time-
Beintema A.J., Moedt O. & Ellinger D. 1995. Ecologische atlas series analysis of diverse animal taxa. Biol. Conserv. 192:
van de Nederlandse weidevogels. Schuyt & Co, Haarlem. 247–257.
Bekhuis J., Bijlsma R., van Dijk A., Hustings F., Lensink R. & Kentie R. 2015. Spatial demography of Black-tailed Godwits.
Saris F. 1987. Atlas van de Nederlandse vogels. SOVON, Metapopulation dynamics in a fragmented agricultural
Arnhem, The Netherlands. landscape. PhD-thesis, University of Groningen, Groningen.
Bijlsma R.G., Hustings F. & Camphuysen C.J. 2001. Algemene Kentie R., Hooijmeijer J.C.E.W., Trimbos K.B., Groen N.M. &
en schaarse vogels van Nederland (Avifauna van Nederland Piersma T. 2013. Intensified agricultural use of grasslands
2). GMB Uitgeverij/KNNV Uitgeverij , Haarlem/Utrecht. reduces growth and survival of precocial shorebird chicks. J.
Choquet R., Lebreton J.-D., Gimenez O., Reboulet A.-M. & Appl. Ecol. 50: 243–251.
Pradel R. 2009. U-CARE: Utilities for performing goodness Kentie R., Both C., Hooijmeijer J.C.E.W. & Piersma T. 2014. Age-
of fit tests and manipulating CApture–REcapture data. dependent dispersal and habitat choice in Black-tailed
Ecography 32: 1071–1074. Godwits (Limosa l. limosa) across a mosaic of traditional
Dawson T.P., Jackson S.T., House J.I., Prentice I.C. & Mace G.M. and modern grassland habitats. J. Avian Biol. 45: 396–405.
2011. Beyond predictions: Biodiversity conservation in a Kentie R., Both C., Hooijmeijer J.C.E.W. & Piersma T. 2015.
changing climate. Science 332: 53–58. Management of modern agricultural landscapes increases
Doak D.F., Gross K., Morris W.F. 2005. Understanding and nest predation rates in Black-tailed Godwits (Limosa limosa
predicting the effects of sparse data on demographic limosa). Ibis 157: 614–625.
analyses. Ecology 86: 1154–1163. Kéry M. & Schaub M. 2012. Bayesian population analysis using
Donald P.F. & Fuller R.J. 1998. Ornithological atlas data: A WinBUGS: a hierarchical perspective, Academic Press.
review of uses and limitations. Bird Study 45: 129–145. Kleijn D., Schekkerman H., Dimmers W.J., van Kats R.J.M.,
Frederiksen M., Fox A.D., Madsen J. & Colhoun K. 2001. Melman D. & Teunissen W.A. 2010. Adverse effects of agri-
Estimating the total number of birds using a staging site. J. cultural intensification and climate change on breeding
Wildl. Manage. 65: 282–289. habitat quality of Black-tailed Godwits Limosa l. limosa in
Ganter B. & Madsen J. 2001. An examination of methods to esti- the Netherlands. Ibis 152: 475–486.
mate population size in wintering geese. Bird Study 48: Loonstra A.H.J., Piersma T. & Reneerkens J. 2016. Staging dura-
90–101. tion and passage population size of Sanderlings in the
Gill J.A., Langston R.H.W., Alves J.A., Atkinson P.W., Bocher P., western Dutch Wadden Sea. Ardea 104: 49–61.
Cidraes Vieira N., Crockford N.J., Gélinaud G., Groen N., Lopes R.J., Alves J.A., Gill J.A., Gunnarsson T.G., Hooijmeijer
Gunnarsson T.G., Hayhow B., Hooijmeijer J.C.E.W., Kentie J.C.E.W., Lourenço P.M., Masero J.A., Piersma T., Potts P.M.,
R., Kleijn D., Lourenço P.M., Masero J.A., Meunier F., Potts Rabaçal B., Reis S., Sánchez-Guzman J.M., Santiago-
P.M., Roodbergen M., Schekkerman H., Schroeder J., Quesada F. & Villegas A. 2012. Do different subspecies of
Wymenga E. & Piersma T. 2007. Contrasting trends in two Black-tailed Godwit Limosa limosa overlap in Iberian
Black-tailed Godwit populations: a review of causes and wintering and staging areas? Validation with genetic
recommendations. Wader Study Group Bull. 114: 43–50. markers. J. Ornithol. 154: 35–40.
Gunnarsson T.G., Gill J.A., Potts P.M., Atkinson P.W., Croger R.E., Lourenço P.M. & Piersma T. 2008. Stopover ecology of Black-
Gélinead G., Gardarsson A. & Sutherland W.J. 2005. tailed Godwits (Limosa limosa limosa) in Portuguese rice
Estimating population size in Black-tailed Godwits Limosa fields: a guide on where to feed in winter. Bird Study 55:
limosa islandica by colour-marking. Bird Study 52: 153–158. 194–202.
Hooijmeijer J.C.E.W., Senner N.R., Tibbitts T.L., Gill R.E., Jr., Lourenço P.M., Mandema F.S., Hooijmeijer J.C.E.W., Granadeiro
Douglas D.C., Bruinzeel L.W., Wymenga E. & Piersma T. J.P. & Piersma T. 2010a. Site selection and resource deple-
2013. Post-breeding migration of Dutch-breeding Black- tion in Black-tailed Godwits Limosa l. limosa eating rice
tailed Godwits: Timing, routes, use of stopovers, and during northward migration. J. Anim. Ecol. 79: 522–8.
nonbreeding destinations. Ardea 101: 141–152. Lourenço P.M., Kentie R., Schroeder J., Alves J.A., Groen N.M.,
Hooijmeijer J.C.E.W., Gill R.E. Jr, Mulcahy D.M., Tibbitts T.L., Hooijmeijer J.C.E.W. & Piersma T. 2010b. Phenology,
Kentie R., Gerritsen G.J., Bruinzeel L.W., Tijssen D.C., stopover dynamics and population size of migrating Black-
Harwood C.M. & Piersma T. 2014. Abdominally implanted tailed Godwits Limosa limosa limosa in Portuguese rice plan-
satellite transmitters affect reproduction and survival rather tations. Ardea 98: 35–42.
than migration of large shorebirds. J. Ornithol. 155: Lourenço P.M., Kentie R., Schroeder J., Groen N.M., Hooijmeijer
447–457. J.C.E.W. & Piersma T. 2011. Repeatable timing of northward
Hötker H., Davidson N.C. & Fleet M. 1991. Waders breeding on departure, arrival and breeding in Black-tailed Godwits Limosa
wet grasslands. Wader Study Group Bull. 61, suppl. l. limosa, but no domino effects. J. Ornithol. 152: 1023–1032.222 ARDEA 104(3), 2016
Lyons J.E., Kendall W.L., Royle J.A., Converse S.J., Andres B.A. Schekkerman H. & Boele A. 2009. Foraging in precocial chicks
& Buchanan J.B. 2015. Population size and stopover dura- of the black-tailed godwit Limosa limosa: Vulnerability to
tion estimation using mark-resight data and Bayesian weather and prey size. J. Avian Biol. 40: 369–379.
analysis of a superpopulation model. Biometrics 72: Schekkerman H., Teunissen W. & Oosterveld E. 2008. The effect
262–271. of mosaic management on the demography of Black-tailed
Márquez-Ferrando R., Figuerola J., Hooijmeijer J.C.E.W. & Godwit Limosa limosa on farmland. J. Appl. Ecol. 45:
Piersma T. 2014. Recently created man-made habitats in 1067–1075.
Doñana provide alternative wintering space for the threat- Schekkerman H., Van Turnhout C., van Kleunen A., van Diek H.
ened Continental European Black-tailed Godwit population. & Altenburg J. 2012. Naar een nieuwe vogelatlas; achter-
Biol. Conserv. 171: 127–135. gronden van de veldwerkopzet. Limosa 85: 133.
Masero J.A., Santiago-Quesada F., Sánchez-Guzmán J.M., Schekkerman H., Gerritsen G.J. & Hooijmeijer J.C.E.W. 2014.
Villegas A., Abad-Gómez J.M., Lopes R.J., Encarnação V., Jonge grutto's in Nederland in 2014: een aantalsschatting
Corbacho C. & Morán R. 2011. Long lengths of stay, large op basis van kleurringdichtheden. Sovon Vogelonderzoek
numbers, and trends of the Black-tailed Godwit Limosa Nederland, Nijmegen.
limosa in rice fields during spring migration. Bird Conserv. Senner N.R., Verhoeven M.A., Abad-Gómez J.M., Gutiérrez J.S.,
Int. 21: 12–24. Hooijmeijer J.C.E.W., Kentie R., Masero J.A., Tibbitts T.L. &
Matechou E., Morgan B.J.T., Pledger S., Collazo J.A. & Lyons Piersma T. 2015. When Siberia came to the Netherlands: the
J.E. 2013. Integrated analysis of capture–recapture– response of Continental Black-tailed Godwits to a rare
resighting data and counts of unmarked birds at stop-over spring weather event. J. Anim. Ecol. 84: 1164–1176.
sites. J. Agric. Biol. Environ. Stat. 18: 120–135. Spaans B., van Kooten L., Cremer J., Leyrer J. & Piersma T.
McClintock B.T. & White G.C. 2012. From NOREMARK to 2011. Densities of individually marked migrants away from
MARK: Software for estimating demographic parameters the marking site to estimate population sizes: a test with
using mark–resight methodology. J. Ornithol. 152: three wader populations. Bird Study 58: 130–140.
641–650. Su Y.-S. & Yajima M. 2015. R2jags: Using R to Run 'JAGS'. R
Mulder T. 1972. De Grutto (Limosa limosa (L.)) in Nederland: package v. 0.5-6. http://CRAN.r-project.org/package=
Aantallen, verspreiding, terreinkeuze, trek en overwin- R2jags
tering. Bureau van de K.N.N.V., Hoogwoud, The Nether- Szabo J.K., Fuller R.A. & Possingham H.P. 2012. A comparison
lands. of estimates of relative abundance from a weakly structured
Osieck E. & Hustings F. 1994. Rode lijst van bedreigde soorten mass-participation bird atlas survey and a robustly designed
en blauwe lijst van belangrijke soorten in Nederland. monitoring scheme. Ibis 154: 468–479.
Technisch rapport 12, Vogelbescherming Nederland, Zeist. Teixeira R.M. 1979. Atlas van de Nederlandse broedvogels.
Otis D.L., Burnham K.P., White G.C. & Anderson D.R. 1978. Vereniging tot Behoud van Natuurmonumenten in Neder-
Statistical inference from capture data on closed animal land, ‘s-Gravenland.
populations. Wildlife Monogr. 62: 3–135. Teunissen W., Altenburg W. & Sierdsema H. 2005. Toelichting op
Piersma T. 1986. Breeding waders in Europe. Wader Study de gruttokaart van Nederland 2004. SOVON Vogelonder-
Group Bull. 48, Suppl.: 1–116. zoek Nederland, Beek-Ubbergen. Altenburg & Wymenga
Plummer M. 2003. JAGS: A program for analysis of Bayesian ecologisch onderzoek bv, Veenwouden, SOVON-onder-
graphical models using gibbs sampling. Proceedings of the zoeksrapport 2005/04, A&W-rapport 668.
3rd International Workshop on Distributed Statistical Teunissen W.A., Schotman A.G.M., Bruinzeel L.W., ten Holt H.,
Computing (DSC 2003). Vienna, Austria. Oosterveld E.O., Sierdsema H., Wymenga E. & Melman
Pradel R., Gimenez O. & Lebreton J.D. 2005. Principles and T.C.P. 2012. Op naar kerngebieden voor weidevogels in
interest of GOF tests for multistate capture-recapture Nederland. Werkdocument met randvoorwaarden en
models. Anim. Biodivers. Conserv. 28: 189–204. handreikeningen. Alterra, Wageningen, Alterra-rapport
R Core Team 2014. R: A language and environment for statis- 2344; Sovon Vogelonderzoek Nederland, Nijmegen, Sovon-
tical computing. R Foundation for Statistical Computing, rapport 2012/21; Altenburg & Wymenga ecologisch onder-
Vienna, Austria. www.R-project.org zoek, Feanwâlden, A&W-rapport 1799.
Rappoldt C., Kersten M. & Smit C. 1985. Errors in large-scale Thorup O. 2006. Breeding waders in Europe 2000. International
shorebird counts. Ardea 73: 13–24. Wader Studies 14. International Wader Study Group, UK.
Roodbergen M., Klok C. & Schekkerman H. 2008. The ongoing Underhill L.G. & Prys-Jones R.P. 1994. Index numbers for water-
decline of the breeding population of Black-tailed Godwits bird populations. 1. Review and methodology. J. Appl. Ecol.
Limosa l. limosa in The Netherlands is not explained by 31: 463–480.
changes in adult survival. Ardea 96: 207–218. van den Brink V., Schroeder J., Both C., Lourenço P.M.,
Roodbergen M., van der Werf B. & Hötker H. 2012. Revealing Hooijmeijer J.C.E.W. & Piersma T. 2008. Space use by
the contributions of reproduction and survival to the Black-tailed Godwits Limosa limosa limosa during settle-
Europe-wide decline in meadow birds: review and meta- ment at a previous or a new nest location. Bird Study 55:
analysis. J. Ornithol. 153: 53–74. 188–193.
Santiago-Quesada F., Masero J.A., Albano N., Villegas A. & van Dijk A.J., Dijksen L., Hustings F., Koffijberg K., Schoppers J.,
Sánchez-Guzmán J.M. 2009. Sex differences in digestive Teunissen W., van Turnhout C., van der Weide M.J.T.,
traits in sexually size-dimorphic birds: insights from an Zoetebier D. & Plate C.L. 2005. Broedvogels in Nederland in
assimilation efficiency experiment on Black-tailed Godwit. 2003. SOVON-monitoringsrapport 2005/01. SOVON Vogel-
Comp. Biochem. Physiol. A 152: 565–568. onderzoek Nederland, Beek-Ubbergen.Kentie et al.: BLACK-TAILED GODWIT POPULATION SIZE IN THE NETHERLANDS 223
White G.C. & Burnham K.P. 1999. Program MARK: survival esti- tijdens de voorjaarstrek elk jaar de fractie Grutto’s met kleur-
mation from populations of marked animals. Bird Study 46: ringen geschat. We hebben daarbij gecorrigeerd voor het
S120–S139. percentage IJslandse Grutto’s Limosa l. islandica (waarvan de
Yates M.G. & Goss-Custard J.D. 1991. A comparison between aantallen toenemen) dat gebruikmaakt van dezelfde pleister-
high water and low water counts of shorebirds on the Wash, plaatsen. Door deze getallen te combineren kon een populatie-
east England. Bird Study 38: 179–187. schatting worden gemaakt en kon tevens de nauwkeurigheid
van die schatting worden aangegeven met betrouwbaarheidsin-
tervallen. Met behulp van Grutto’s die op de pleisterplaatsen
werden uitgerust met satellietzenders, kwamen we erachter dat
SAMENVATTING 87% (75–95%) van de West-Europese populatie in Nederland
broedt. Deze nieuwe schatting laat bovendien zien dat het
Hoewel we weten dat het aantal Grutto’s Limosa limosa limosa aantal broedparen in Nederland vanaf 1967 met 75% is afge-
in West-Europa de laatste 50 jaar hard achteruit is gegaan, nomen en dat de snelheid van de afname in de periode
stamt de laatste Nederlandse populatieschatting nog uit 1999. 2011–2015 sneller ging dan in de vier jaar daarvoor. We laten
In dit artikel presenteren we nieuwe populatieschattingen voor met deze analyse zien dat met behulp van een intensief regio-
de gehele continentale gruttopopulatie van West-Europa en naal ring- en monitoringprogramma in combinatie met het
voor de Nederlandse broedpopulatie afzonderlijk. Deze schat- verzamelen van terugmeldingen van geringde vogels elders,
tingen laten zien dat de Nederlandse populatie tussen 2007 en betrouwbare schattingen kunnen worden gemaakt van popula-
2015 met 3,7% per jaar is afgenomen van 47.000 (95%- ties op de schaal van een hele trekroute. Aangezien eerder
betrouwbaarheidsinterval: 38.000–56.000) tot 33.000 (26.000 onderzoek aantoonde dat het lage broedsucces de oorzaak van
– 41.000) broedparen in 2015. Om tot deze schatting te komen, de achteruitgang is, heeft Nederland als het belangrijkste broed-
hebben we gegevens afkomstig van Grutto’s met kleuringen en gebied voor West-Europese Grutto’s de grootste verantwoorde-
zendertjes geïntegreerd in één analyse in een Bayesiaans lijkheid binnen Europa voor het in stand houden van deze popu-
statistisch model. Allereerst hebben we voor 2007 tot en met latie.
2015 door middel van een mark-recapture overlevingsanalyse
het aantal nog in leven zijnde Grutto’s met kleurringen geschat. Corresponding editor: Adriaan Dokter
Daarna hebben we op pleisterplaatsen in Spanje en Portugal Received 24 August 2016; accepted 28 December 2016224 ARDEA 104(3), 2016 SUPPLEMENTARY MATERIAL Table S1. Parameter estimates (mean, standard deviation (SD), credibility interval (2.5% CI and 97.5% CI) and R-hat) from the Bayesian population model. Parameter* posterior mean SD 2.5% CI 97.5% CI R-hat phi adult 2004–2005 0.939 0.038 0.854 0.997 1.001 phi adult 2005–2006 0.865 0.038 0.786 0.936 1.001 phi adult 2006–2007 0.871 0.037 0.797 0.940 1.001 phi adult 2007–2008 0.834 0.032 0.770 0.894 1.001 phi adult 2008–2009 0.826 0.029 0.767 0.883 1.001 phi adult 2009–2010 0.830 0.025 0.780 0.878 1.001 phi adult 2010–2011 0.847 0.023 0.800 0.890 1.001 phi adult 2011–2012 0.848 0.022 0.803 0.890 1.001 phi adult 2012–2013 0.869 0.018 0.833 0.903 1.001 phi adult 2013–2014 0.831 0.016 0.798 0.862 1.001 phi adult 2014–2015 0.828 0.036 0.764 0.904 1.004 phi juv 2004–2005 0.355 0.076 0.205 0.505 1.002 phi juv 2005–2006 0.370 0.095 0.181 0.565 1.001 phi juv 2006–2007 0.421 0.083 0.268 0.602 1.001 phi juv 2007–2008 0.330 0.068 0.199 0.461 1.003 phi juv 2008–2009 0.379 0.058 0.268 0.496 1.001 phi juv 2009–2010 0.427 0.071 0.296 0.578 1.002 phi juv 2010–2011 0.543 0.084 0.391 0.714 1.002 phi juv 2011–2012 0.323 0.069 0.188 0.454 1.001 phi juv 2012–2013 0.440 0.062 0.327 0.568 1.001 phi juv 2013–2014 0.383 0.048 0.29 0.479 1.002 phi juv 2014–2015 0.298 0.085 0.144 0.461 1.006 p adult 2005 0.901 0.038 0.813 0.960 1.001 p adult 2006 0.858 0.039 0.772 0.923 1.001 p adult 2007 0.816 0.040 0.730 0.887 1.001 p adult 2008 0.789 0.035 0.715 0.853 1.001 p adult 2009 0.717 0.035 0.646 0.782 1.001 p adult 2010 0.795 0.027 0.739 0.844 1.001 p adult 2011 0.691 0.030 0.630 0.749 1.001 p adult 2012 0.732 0.028 0.676 0.785 1.001 p adult 2013 0.871 0.017 0.836 0.903 1.001 p adult 2014 0.907 0.014 0.878 0.932 1.002 p adult 2015 0.957 0.029 0.891 1.000 1.005 p 2nd calendar year 2005 0.411 0.110 0.215 0.638 1.001 p 2nd calendar year 2006 0.311 0.081 0.172 0.485 1.001 p 2nd calendar year 2007 0.248 0.064 0.141 0.388 1.001 p 2nd calendar year 2008 0.215 0.051 0.128 0.327 1.001 p 2nd calendar year 2009 0.156 0.037 0.093 0.237 1.001 p 2nd calendar year 2010 0.219 0.047 0.137 0.320 1.001 p 2nd calendar year 2011 0.140 0.032 0.086 0.209 1.001 p 2nd calendar year 2012 0.165 0.038 0.101 0.247 1.001 p 2nd calendar year 2013 0.327 0.058 0.221 0.449 1.001 p 2nd calendar year 2014 0.412 0.065 0.290 0.540 1.002 p 2nd calendar year 2015 0.648 0.179 0.348 0.997 1.005 prop marked birds 2007 0.002 0.000 0.002 0.002 1.001 prop marked birds 2008 0.003 0.000 0.003 0.003 1.001 prop marked birds 2009 0.003 0.000 0.003 0.004 1.001 prop marked birds 2010 0.004 0.001 0.003 0.005 1.001
Kentie et al.: BLACK-TAILED GODWIT POPULATION SIZE IN THE NETHERLANDS                                    225

Table S1. Continued

Parameter*                                             posterior mean               SD                 2.5% CI                97.5% CI   R-hat

prop marked birds 2011                                       0.004                0.001                 0.003                   0.005    1.001
prop marked birds 2012                                       0.005                0.001                 0.004                   0.007    1.001
prop marked birds 2013                                       0.009                0.001                 0.007                   0.010    1.001
prop marked birds 2014                                       0.011                0.000                 0.010                   0.012    1.001
prop marked birds 2015                                       0.016                0.001                 0.013                   0.018    1.001
prop marked birds 2016                                       0.013                0.001                 0.011                   0.016    1.001
prop 2nd calendar year birds                                 0.533                0.097                 0.361                   0.742    1.001
prop Icelandic Godwits                                       0.065                0.015                 0.039                   0.096    1.001
prop Dutch Godwits                                           0.866                0.050                 0.753                   0.948    1.001
total population 2007                                       115305                 9162                 98304                  134265    1.001
total population 2008                                       109806                 9467                 92480                  129539    1.001
total population 2009                                       118629                 9336                101376                  138187    1.001
total population 2010                                       151309                24363                110442                  205736    1.001
total population 2011                                       164010                20735                128479                  209253    1.001
total population 2012                                       141498                15179                114424                  174234    1.001
total population 2013                                       109621                8356                 94275                   127185    1.001
total population 2014                                       106690                5167                 96944                   117249    1.001
total population 2015                                       81793                 8251                 66973                   99309     1.003
breeding pair Netherlands 2007                               46717                4650                 37922                   56103     1.001
breeding pair Netherlands 2008                               44490                4685                 35800                    54168    1.001
breeding pair Netherlands 2009                               48066                4785                 39026                    57679    1.001
breeding pair Netherlands 2010                               61304                10546                 43431                   84692    1.001
breeding pair Netherlands 2011                               66451                9320                  50376                   86506    1.001
breeding pair Netherlands 2012                               57332                 7067                 44572                   72306    1.001
breeding pair Netherlands 2013                               44415                 4319                 36264                   53188    1.001
breeding pair Netherlands 2014                               43228                 3352                 36461                   49724    1.001
breeding pair Netherlands 2015                               33140                 3894                 26031                   41303    1.002
mean p adults                                                0.821                0.013                 0.795                   0.847    1.001
mean p 2nd calendar year                                     0.296                0.047                 0.208                   0.392    1.002
mean phi adults                                              0.854                0.008                 0.838                   0.869    1.001
mean phi juv                                                 0.388                0.029                 0.333                   0.448    1.003
random effect phi year adults                                2.706                0.659                 1.705                   4.312    1.001
random effect phi year juv                                   0.468                0.231                 0.089                   1.002    1.045
random effect p individual                                   1.335                0.112                 1.122                   1.560    1.002
Deviance                                                   9183.043              142.312              8896.685                9449.126   1.003
*
p is resighting probability, phi is apparent survival probability, prop is short for proportion, juv is short for juvenile.
You can also read