Investigation of Confined Turbulent Jet Flames Using kHz-Rate Diagnostics - DLR
←
→
Page content transcription
If your browser does not render page correctly, please read the page content below
AIAA 2016-0185
AIAA SciTech
4-8 January 2016, San Diego, California, USA
54th AIAA Aerospace Sciences Meeting
Investigation of Confined Turbulent Jet Flames Using
kHz-Rate Diagnostics
Zhiyao Yin∗ , Isaac Boxx† , Michael Stöhr‡ , Oliver Lammel§ and Wolfgang Meier¶
German Aerospace Center (DLR), Stuttgart, Germany
An atmospheric, single-jet combustor with rectangular confinement was previously de-
veloped based on the FLOXr concepta . In this study, premixed, preheated H2 -air and
CH4 -air turbulent jet flames were stabilized in this combustor. Self-sustained jet oscilla-
tion was observed in both non-reacting and reacting cases. A 3-D and periodic jet flapping
is identified via proper orthogonal decomposition (POD) of various 2-D views of the flow
Downloaded by Zhiyao Yin on April 6, 2016 | http://arc.aiaa.org | DOI: 10.2514/6.2016-0185
field, measured by particle imaging velocimetry (PIV). The frequency of the oscillations
and couplings between different Eigenmodes are determined based on results from PIV
at 5 kHz repetition rate. The influence of jet flapping on combustion stability is examined
in detail using simultaneous PIV/OH chemiluminescence imaging and PIV/planar laser-
induced fluorescence of OH radicals (OH PLIF) at 5 kHz repetition rate. The up/down
and expand/contract motions of the lateral recirculation zone (LRZ) due to jet flapping is
found to modify the flame shape and flame lift-off height. Such variations are traced to
the transformation of low-speed regions in the junction of the back flow and the jet. These
regions contain counter flows and vortices with relatively long flow residence time and can
therefore enhance the mixing between recirculated hot burned gas and fresh fuel-air mix-
tures. In some cases, the jet flapping is also found to cause temporary local extinction of
the flame, due to reduced entrainment of burned gas. However, the flame is able to recover
as the jet flaps away from combustor chamber and reopens the back flow channel.
I. Introduction
Laminar and turbulent jets under confinement or impingement geometries are known to be prone to self-
sustained oscillations.1–3 Considerable studies have been dedicated to the characterization of such phenomena
due to their presence in a broad range of industries: wind instrument,4 ramjet combustor,5 fluidic oscillator,6
to name a few. The common understanding is that, the oscillations are triggered by obstructed shear layers,
and are sustained by a feedback loop between initial disturbances and the impinging points. Such feedback
loop is most commonly hydrodynamic through the back flow (e.g., recirculation), as found in jet experiencing
sudden expansion7, 8 and jet issuing into a cavity.3, 9, 10 It could also be of acoustic nature, which may
coexist with the hydrodyamic mechanism.1 Through parametric studies, oscillations occurred in confined
jets have been found to scale with jet velocity and impingement length (e.g., nozzle diameter and confinement
dimensions).3, 10 They often possess a Strouhal number (St) in the range of St∼0.001-0.01, much smaller
than the instabilities generated within shear layers (St∼1),7 suggesting the involvement of the jet as a whole.
Advances in particle imaging velocimetry (PIV) in the past decade have allowed topological analysis of
jet oscillations in two- and even three-dimensions. In the case of flapping planar jets under rectangular
confinement,3, 8, 11, 12 a recirculation zone can be found on each side of the jet. As the jet flaps with respect
to the plane of symmetry, the two recirculation zones move conversely up or down. At the same time,
cross-flow between the nozzle and confinement (e.g., chamber walls) oscillates in response, completing the
feedback loop. Through proper orthogonal decomposition (POD) of the 2-D velocity field,12 the spatial mode
∗ Postdoc, Institute of Combustion Technology, Stuttgart, Germany. AIAA Associate Member
† Staff Scientist, Institute of Combustion Technology, Stuttgart, Germany. AIAA Senior Member
‡ Staff Scientist, Institute of Combustion Technology, Stuttgart, Germany.
§ Staff Scientist, Institute of Combustion Technology, Stuttgart, Germany.
¶ Head of Laser Diagnostics Division, Institute of Combustion Technology, Stuttgart, Germany. AIAA Member
a FLOXr is a registered trademark of WS Wärmeprozesstechnik GmbH, Renningen, Germany
1 of 19
American Institute of Aeronautics and Astronautics
Copyright © 2016 by Zhiyao Yin. Published by the American Institute of Aeronautics and Astronautics, Inc., with permission.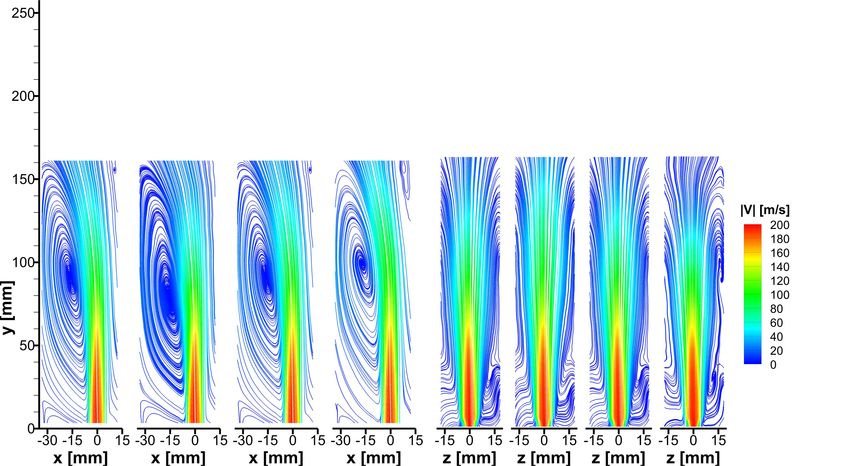
responsible for the jet flapping has been identified to contain large structures distributed pseudo-periodically
                                                                                             alongside the jet. Such observation was consistent with previous analysis based on hot wire measurements.2
                                                                                             In the case of an axisymmetric round jet expanding into a concentric cylindrical chamber,7, 13, 14 jet precessing
                                                                                             (defined as rotation of the entire jet with respect to the nozzle axis) has been found to induce a swirling flow
                                                                                             in the confinement. With tomographic PIV,15 it has been shown that asymmetric entrainment induced by
                                                                                             a constantly reattaching jet is the cause for the azimuthal pressure gradient, which leads to jet precession.
                                                                                             Such dynamic oscillations in confined jets are known to enhance large scale mixing of the jet while also
                                                                                             sustaining high turbulent intensity in the far field.8 In reacting flows, jet precession has been found to
                                                                                             increase flame volume without increasing flame length.16 The reduced global flame strain results in an
                                                                                             increase of soot production and hence enhanced radiative heat transfer, eventually leading to a decrease in
                                                                                             flame temperature and NOx production.
                                                                                                 A similar type of jet flapping has been reported in our previous work,17 in a confined, single-nozzle gas
                                                                                             turbine model combustor, designed18 based on the FLOXr concept. FLOXr combustion, also termed as
                                                                                             flameless,19 volume or mild combustion,20 is regarded as a viable alternative to swirl-stabilized flames due
                                                                                             to its highly resistance to thermoacoustics and flame flashback,21 while also attaining high fuel flexibility.22
                                                                                             FLOXr combustors generally consist of circularly arranged nozzles discharging high momentum jets of
                                                                                             reactants into a combustion chamber, consequently generating strong recirculation of the flow and intense
                                                                                             mixing of reactants and products. In recent years at our institute, significant effort has been devoted to
Downloaded by Zhiyao Yin on April 6, 2016 | http://arc.aiaa.org | DOI: 10.2514/6.2016-0185

                                                                                             evaluating combustion performance and understanding flame stabilization mechanisms in various FLOXr
                                                                                             combustors, both experimentally18, 22 and numerically.23, 24 This work focuses on characterizing turbulent jet
                                                                                             oscillations and their influences on combustion stability in the single-nozzle combustor. One major emphasis
                                                                                             is to time-resolve the jet flapping motion and flame responses using kHz-rate, simultaneous PIV and OH
                                                                                             chemiluminescence imaging or planar laser-induced fluorescence of OH radical (OH PLIF).

                                                                                                                                        II.    Experimental
                                                                                             A.   Single-nozzle jet-stabilized model combustor
                                                                                             The single-nozzle model combustor shown schematically in Fig. 1 was developed in our previous work.18
                                                                                             Preheated and premixed gas mixture was delivered through a straight stainless steel tube (ID=10 mm,
                                                                                             L=400 mm) into the combustor chamber. The nozzle had a chamfered tip and rose 20 mm from the base
                                                                                             plate. The chamber consisted of three identical sections. Each was 200-mm tall and featured a rectangular
                                                                                             cross section with an inner dimension of 50×40 mm. The jet nozzle was offset from the geometric center of
                                                                                             the combustor chamber, creating an asymmetry in the front view (Fig. 1(b)). The off-center positioning of
                                                                                             the jet was designed to imitate the situation around a single nozzle in an actual FLOXr combustor, where
                                                                                             a ring of nozzles were placed near the chamber wall, leading to the formation of a large inner recirculation
                                                                                             zone.22 The whole combustor was mounted on a three-axis translation stage and could be positioned with
                                                                                             regard to the laser diagnostics setup. The coordinates used in the following discussions are also defined in
                                                                                             Fig. 1.
                                                                                                 For this study, the combustor was operated with a various air flow at a preheating temperature of 300 ◦C
                                                                                             and at 1 bar. Non-preheated methane or hydrogen was added into the main air through a static mixer to
                                                                                             achieve various equivalence ratios. The average jet exit velocity was maintained at either 120 m/s or 150 m/s.

                                                                                             B.   Low-speed diagnostics
                                                                                             A commercial particle image velocimetry (PIV) system (LaVision Flowmaster) was used to obtain a global
                                                                                             view of the velocity fields in different sections of the combustor chamber. A small portion of the main air
                                                                                             (non-preheated) was seeded with titanium dioxide (TiO2 ) particles (d=1 µm) and injected into the static
                                                                                             mixer. The second harmonic output of a dual-cavity Nd:YAG laser (with pulse energy of 2×120 mJ) was used
                                                                                             to illuminate the particles (with a pulse separation of 5 µs to 11 µs). The laser beam was expanded into a sheet
                                                                                             of 200-mm tall and 1-mm thick and was aligned through the center of the jet nozzle ((x-y or y-z plane, see
                                                                                             Fig. 1)). Mie scattering signal from the particles was collected into a CCD camera (1376×1040 pixels) coupled
                                                                                             with a f=50 mm lenses (f/4), a narrow bandpass filter (532±5 nm) and a mechanical shutter (to suppress flame
                                                                                             emission). Velocity vectors were calculated using a multipass adaptive window cross correlation algorithm
                                                                                             with a final window size of 16×16 pixels (corresponding to a 2.2 × 2.2 mm2 spatial resolution). Based on
                                                                                             the ±0.1 pixel uncertainty of the cross correlation peak-finding algorithm, the uncertainty of the velocity

                                                                                                                                                   2 of 19

                                                                                                                             American Institute of Aeronautics and Astronautics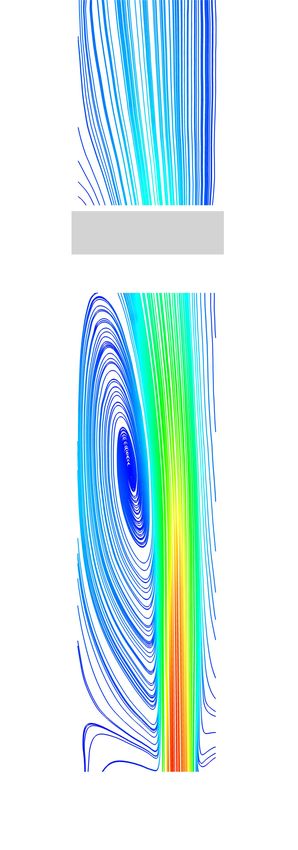
Figure 1: Combustor geometry:
(a) Combustor chamber (d)
(b) Front view,
(c) Side view, and
(d) Top view of the bottom section
z
Side
x
Front
m
50 40
200
Downloaded by Zhiyao Yin on April 6, 2016 | http://arc.aiaa.org | DOI: 10.2514/6.2016-0185
35 20
b
y y
20 x z
(a) (b) (c)
∗
measurements was estimated to be ±2.3 m/s. Separately, OH chemiluminescence from the flame was imaged
using a combination of a CCD camera, an image relay optics device (IRO), a Cerco UV lens (f=45 mm, f/1.8)
and a bandpass filter centered at 310 nm.
C. High-speed diagnostics
As mentioned in Section I, confined jets are known to experience self-excited, self-sustained oscillations,
usually leading to a fluctuation of the recirulation zones. Since the recirulation zones play critical roles in
flame stabilization in this single-jet combustor, it is important to verify the existence of such instability. For
that, kHz-rate laser diagnostics systems at DLR were employed.
Three-component velocity fields were measured using a stereoscopic PIV system at a repetition rate of 5
kHz. The stereo-PIV system was based on a dual-cavity Nd:YAG laser (Edgewave IS-6IIDE, 2.6 mJ/pulse
at 532 nm) and a pair of CMOS cameras (LaVision HSS8) with f=200 mm lenses (f/5.6). Pulse timing
separation for the PIV system was set to 10 µs, resulting in an estimated uncertainty of ±0.2 m/s. Due to
the limitation of laser energy, the laser sheet height was set to about 30 mm. A final field of view (FOV)
of approximately 27×25 mm2 was chosen to achieve a higher spatial resolution (0.5×0.5 mm2 , with 16×16
pixels interrogation window) than the low speed measurements described above (the relative size of FOV is
shown in Fig.2(c) as the dashed box).
Simultaneously with highspeed PIV, either OH∗ chemiluminescence imaging or planar OH Laser-Induced
Fluorescence (PLIF) was performed. For OH∗ imaging, signal was collected via a Cerco UV lens (f=45 mm,
f/1.8) coupled with a 310-nm bandpass filter into an intensified CMOS camera (LaVision HSS6 with HS-
IRO). For OH PLIF, a frequency-doubled dye laser (Sirah Credo) was pumped by the 532 nm output of an
Nd:YAG laser (Edgewave IS-8IIE) to produce ∼100 µJ/pulse at ∼282 nm. The laser was tuned to the peak
of Q1 (7) line in the OH A-X (1,0) band, which is insensitive to temperature in the range of T=1200-2000 K
(with only 10% change in lower state population). The OH PLIF excitation pulse was temporally interlaced
between the two PIV pulses. Fluorescence signal was collected with the same camera system used for OH
3 of 19
American Institute of Aeronautics and Astronautics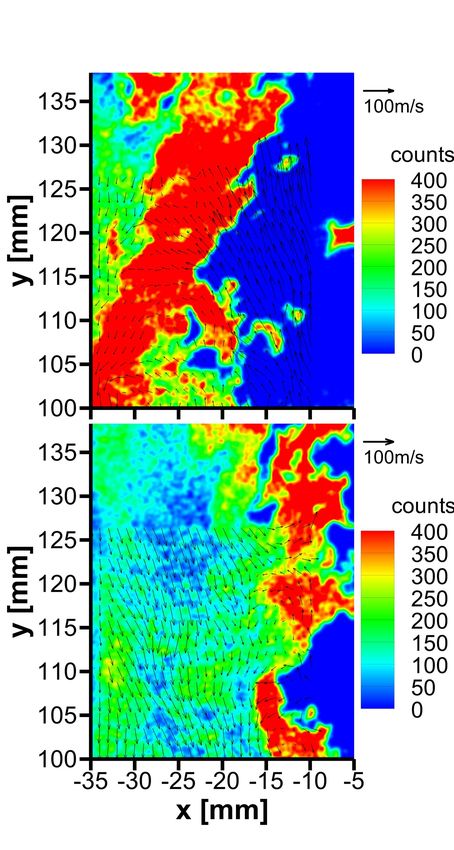
Figure 2: Measured average fields:
                                                                                               (a)&(b) Streamlines color-coded by velocity
                                                                                               magnitude in non-reacting and reacting flows
                                                                                                                                                               SRZ
                                                                                               respectively
                                                                                               (c) OH chemiluminescence

                                                                                                                                                       LRZ
Downloaded by Zhiyao Yin on April 6, 2016 | http://arc.aiaa.org | DOI: 10.2514/6.2016-0185

                                                                                                                                                      CRZ

                                                                                                                                                              (a)                  (b)              (c)
                                                                                             chemilunimescence imaging, with a FOV of about 40×40 mm2 to overlap with that of the PIV. For both
                                                                                             PIV and PLIF, the laser sheets were aligned through the center of the nozzle (x-y plane, see Fig. 1).

                                                                                                                       III.    Average flow fields and flame shapes
                                                                                                 Figure 2 shows the average flow field and OH∗ emission measured at the operating condition from the
                                                                                             front view (refer to Fig. 1). Since the flame occupied mainly the bottom section (denoted as ‘b’ in Fig.1)
                                                                                             and part of the middle section (denoted as ‘c’ in Fig.1), the results have been cropped accordingly. Note
                                                                                             that the flow field of the bottom and middle sections were obtained from two separate measurements. A
                                                                                             good consistency between them is however obviously demonstrated. As reported in our previous work,17, 18
                                                                                             the most characteristic feature of this combustor is the lateral recirculation zone (LRZ) in the bottom
                                                                                             section between the main jet and the chamber wall. This is evident from both the non-reacting (Fig. 2(a))
                                                                                             and reacting (Fig. 2(b)) cases. Two other recirculation zones can also be identified in Fig. 2(a): a corner
                                                                                             recirculation zone (CRZ) under the LRZ and a secondary recirculation zone (SRZ) on the opposite side of the
                                                                                             jet. The flow fields exhibit similar structures in both non-reacting and reacting cases, except for an overall
                                                                                             higher velocity and the disappearance of the SRZ in the reacting case (Fig. 2(b)). With a measured average
                                                                                             temperature of 1000–1600 K18 in the reacting case, the LRZ is responsible for entraining large amount of
                                                                                             burned gas to mix with the cold jet. Comparing Fig. 2(b) and (c), it is clear that the flame is lifted and
                                                                                             stabilized at about midway of the bottom section. This location coincides with the core of the LRZ. In
                                                                                             addition, the flame appears strongly asymmetric with respect to the nozzle axis, with a bias towards the
                                                                                             LRZ.
                                                                                                 Figure 3 shows the influence of equivalence ratio and H2 addition on the structure and lift-off height of the
                                                                                             CH4 -air flames. For all the cases, air flow rate was adjusted such that the same jet exit velocity of vjet =120
                                                                                             m/s was maintained. It is clear from Fig. 3(a) that equivalence ratio has a small effect on flame lift-off height.
                                                                                             However, flame appears to contract with increasing equivalence ratio. On the other hand, Figure 3(b) shows
                                                                                             that with increasing H2 mole fraction in the fuel, flame contracts, becomes more symmetric along the nozzle
                                                                                             center line, and also moves upstream towards the nozzle.
                                                                                                 Flame dynamics can be inferred from frequency analysis of OH chemiluminescence intensities from a
                                                                                             sequence of images. Figure 4 shows power spectral density (PSD) of integrated OH chemiluminescence (i.e.,
                                                                                             sum of intensity counts) from a set of 5000 images taken at 5 kHz. The integration area covered the entire
                                                                                             first section of the combustor (height above jet exit from 0 to 175 mm, see Fig. 3). As shown in Fig. 4(a),

                                                                                                                                                    4 of 19

                                                                                                                              American Institute of Aeronautics and Astronautics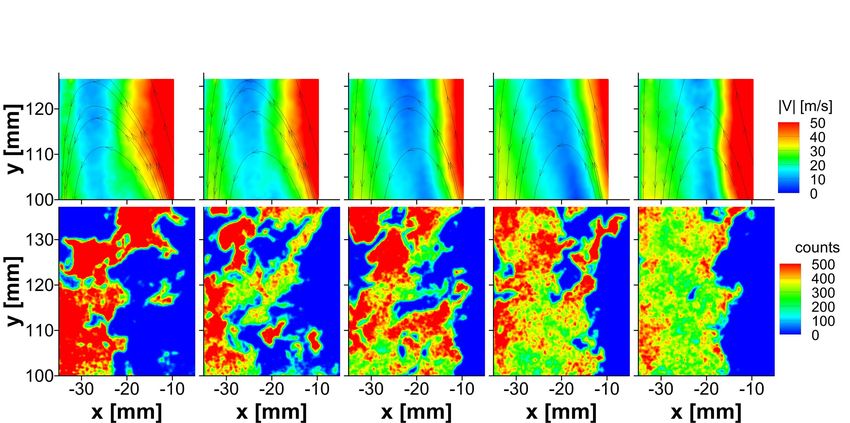
Downloaded by Zhiyao Yin on April 6, 2016 | http://arc.aiaa.org | DOI: 10.2514/6.2016-0185

                                                                                                                                                 (a)

                                                                                                                                                 (b)

                                                                                             Figure 3: (a) Average OH chemiluminescence from CH4 -air flames at T0 =300 ◦C and vjet =120 m/s with
                                                                                             various equivalence ratio. (b) Average OH chemiluminescence from CH4 -air flames at φ=0.80, T0 =300 ◦C
                                                                                             and vjet =120 m/s with different amount of H2 addition.

                                                                                                                                                5 of 19

                                                                                                                          American Institute of Aeronautics and Astronautics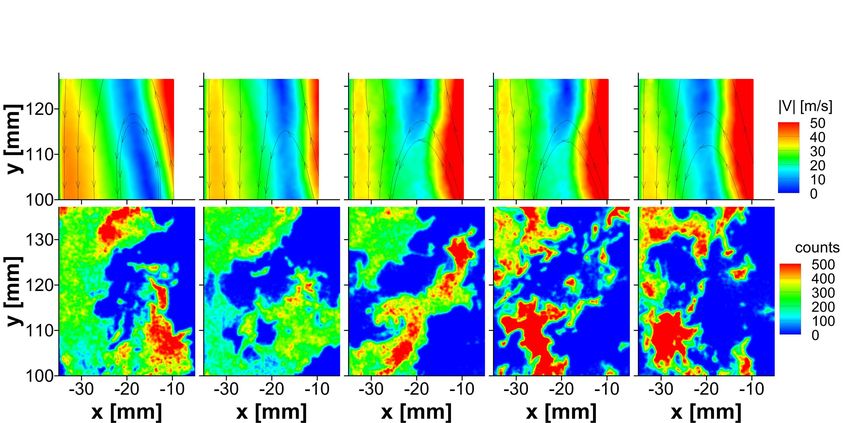
(a)                                                        (b)

                                                                                             Figure 4: (a) PSD of integrated OH chemiluminescence from a CH4 -air flame at T0 =300 ◦C and vjet =120
                                                                                             m/s. (b) PSD of integrated OH chemiluminescence from CH4 /H2 -air flames at φ=0.80, T0 =300 ◦C and
Downloaded by Zhiyao Yin on April 6, 2016 | http://arc.aiaa.org | DOI: 10.2514/6.2016-0185

                                                                                             vjet =120 m/s

                                                                                             a strong fluctuation with a low frequency (300 Hz) starts to appear. From
                                                                                             Fig. 4(b), with increasing H2 addition, the instabilities seem to diminish first at f>300 Hz and then at f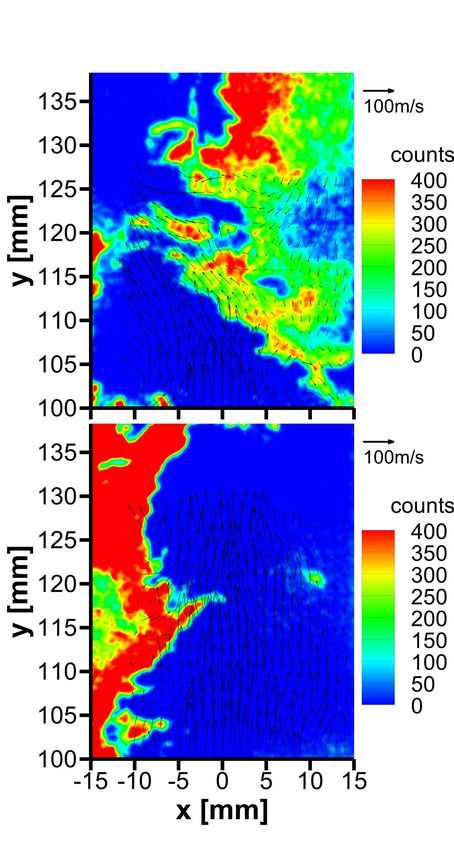
The phase dependent flow field ~u(ψ) modeled by considering a single Eigenmode can be written as:
p
~u(ψ) ≈ h~ui + λi · sin ψ · ~ei , (1)
where h~ui is the average flow field, ψ is the phase angle, λi is the Eigenvalue of the Eigenmod ~ei and can be
expressed by the temporal coefficient aji of Mode i from each snap shot j:
N
1 X 2
λi = · a , (2)
N j=1 ji
where N is total number of snap shots used for POD.
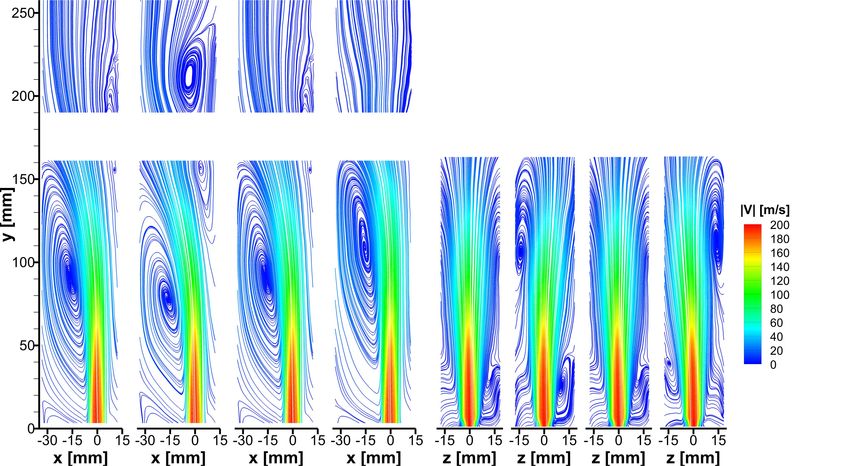
Figure 7 shows the phase-dependent non-reacting flow fields, modeled based on the front lateral mode
shown in Fig. 2(a), by using Eq. 1. Note that, per definition, the flow field at ψ = 0◦ and 180◦ recovers to
the average flow field h~ui. In the first half cycle, the jet flaps leftwards, pushing the LRZ downwards. In the
meantime, the SRZ, which is barely visible in the averaged flow field (ψ = 0◦ ), increases in size and reaches its
maximum at ψ = 90◦ . Then the jet flaps rightwards, back to the original position. This rightward flapping
continues into the second half of cycle, until the jet is almost “straightened up” at ψ = 270◦ , accompanied
by the upward motion of the LRZ and the disappearance of the SRZ. In a similar fashion, the oscillation in
the side view can also be modeled, as shown in Fig. 7. From the side view, the jet can also be seen flapping
Downloaded by Zhiyao Yin on April 6, 2016 | http://arc.aiaa.org | DOI: 10.2514/6.2016-0185
towards each wall, resulting in upward/downward motion of the recirulation zones on each side of the jet.
This is more resemblance to the flapping motions observed in the symmetric planar jets.12 These results
suggest that the flapping motion could be observable in any cut-through plane with regard to the nozzle axis
(y-axis).
The same modeling method was also conducted by employing the axial modes for both the front and
side views. Although this mode is relatively weak and could be coupled with other modes, the aim is to
reveal the flow pattern controlled by the axial mode. The results are shown in Fig. 8. The middle section
exhibited little variance at different phases and was therefore not included in the plot. It seems the axial
mode is associated with a fluctuation causing the far field of the jet to go through an increasing/decreasing
cycle. This is evident from the expansion/contraction of the green region in the streamlines in Fig. 8. The
core area of the jet (red), however, does not seem to be affected, suggesting that this axial fluctuation is not
a pulsating motion along the nozzle axis. Considering the concurring jet flapping in the combustor chamber,
this axial fluctuation could be explained as the manifestation of the jet moving in and out of the observation
plane (i.e., the cut-through plane of the laser sheet). In this sense, the lateral mode in the side view (Fig. 7)
can be considered as essentially inducing the axial mode in the front view (Fig. 8). Therefore, the coupling
between the in-plane and out-of-plane motion can be derived by comparing the lateral and axial modes in
the same view, as detailed in the following section.
C. Mode coupling
As shown in,27 two Eigenmodes (representing the real and complex parts) are needed to describe a trav-
eling wave. The flapping motion in a confined planar jet (a 2-D flow) was also shown to be controlled by
two Eigenmodes with similar energy contributions but a phase shift of their temporal coefficients in the
frequency domain.12 As already mentioned in Section A, the third and fourth Eigenmodes were found to
have similar spatial structures as the lateral and axial modes. To shed light on the complex asymmetric and
three dimensional jet motion in the combustor, the temporal behaviors of various spatial modes and their
interactions need to examined. This is done by time-resolving the flapping motion using the kHz diagnostic
system described in Section II.
Figure 9(a) shows the lateral modes obtained from decomposing a set of 3750 shots of velocity fields
obtained at 5 kHz, plotted on the same color scale as 5. Even though the FOV is much smaller, the spatial
Eigenmodes and their energy contributions correspond well to those taken with the low-speed system (Fig. 5
and Fig. 6). The companion lateral mode, denoted by a prime sign, exhibit a more convoluted flow field with
much lower velocity magnitude. The correlation between the two modes is much clearer from their temporal
coefficients (a in Eq.2). As shown in Fig. 9(b), the weaker mode (a0Lateral ) lags behind the primary mode
(aLateral ) by roughly 1/4 of a cycle, as expected between a mode pair. The similarity between the mode
pair can also be found in the power spectral density (PSD) of the temporal coefficients, plotted in Fig. 9(c)
the strongest peak can be found at the same frequency. The same observations were made regarding the two
axial modes, the results therefore are omitted here.
7 of 19
American Institute of Aeronautics and Astronautics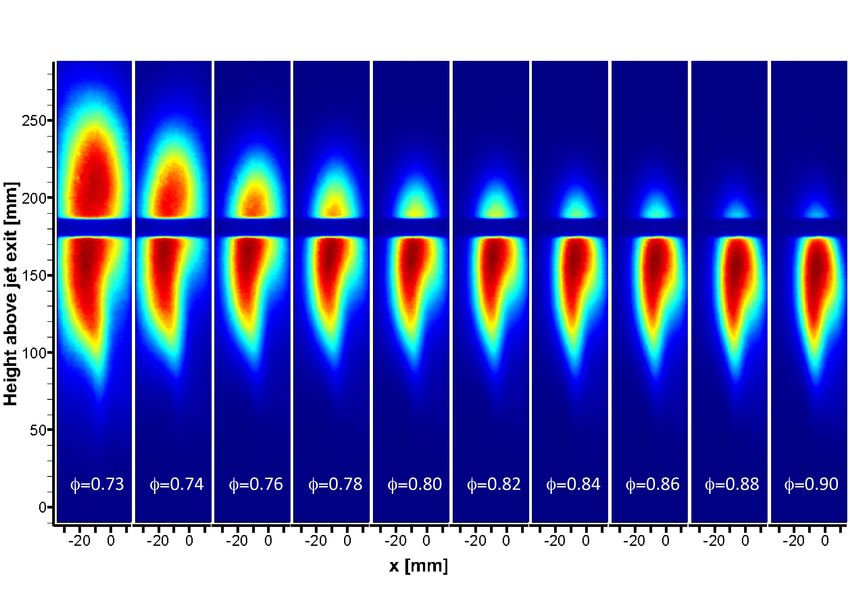
In addition to the coupling between the mode pairs, coupling between the lateral and the axial modes
                                                                                             was also identified. From their temporal coefficients plotted in Fig.8 10(a) (aaxial smoothed with a δt=0.01 s
                                                                                             window to remove high frequency noise), the axial mode appears to have doubled the time period as the
                                                                                             lateral mode. This is confirmed from PSD of their temporal coefficients given in Fig.8 10(b). The axial mode
                                                                                             peaks at 19.9 Hz, exactly half of the strongest peak found in the lateral mode. Furthermore, the peaks and
                                                                                             valleys in the axial mode (correspond to phase angle of 90◦ and 270◦ seem to always coincide with the peaks
                                                                                             in the lateral mode. A Lissajous plot of their temporal coefficients shows that the temporal coefficients
                                                                                             do not scatter randomly in the phase portrait but rather appear to be bounded within a semi-parabolic
                                                                                             trajectory. It seems when the jet swings one cycle in and out of the measurement plane (axial mode), it
                                                                                             flaps left and right (in-plane) two complete cycles (lateral mode).
                                                                                                 These results can be used to reconstruct the 3-D jet flapping motion inside the combustor, as illustrated
                                                                                             schematically in Fig. 10(d). A likely projection of the jet flapping motion from the top view is represented
                                                                                             by the red dashed line with regard to the jet nozzle. Based on Fig. 10(a), the corresponding phase angles
                                                                                             at various jet locations are also marked out with respect to the front and the side views of the combustor
                                                                                             chamber (refer to Fig. 1(d)). As the jet moves along the red dashed line, it completes two cycles of jet
                                                                                             flapping from the perspective of the front view. While from the side view, it only flaps one cycle.
                                                                                                 It should be emphasized that the simple jet flapping track illustrated in Fig. 10(d) is only an idealized
                                                                                             case. It is presented to demonstrate the 3-D nature of the jet oscillation inside the combustor chamber.
Downloaded by Zhiyao Yin on April 6, 2016 | http://arc.aiaa.org | DOI: 10.2514/6.2016-0185

                                                                                             As is obvious from the pseudo-sinusoidal behavior of the temporal coefficients in Fig. 10(b) and the rather
                                                                                             noisy phase portrait in Fig. 10(d), the exact location of the jet at different flapping cycles can follow various
                                                                                             tracks, which is also not necessarily symmetric to the nozzle axis within the same cycle.

                                                                                             D.   Influence of reaction on the flow field instability
                                                                                             Since the jet oscillation is associated with density (pressure) imbalances around the jet, combustion reactions
                                                                                             may exert influences on the flow field and its instability. In the reacting case, small differences can be
                                                                                             observed in the average flow field shown in Fig. 2 (see Section B). POD Eigenmodes exhibit identical spatial
                                                                                             distributions for both cases, with the same ordering of energy contributions. In the reacting case, the SRZ
                                                                                             appears in phase modeling of the flow field using the lateral mode and increases in size until phase 90◦ .
                                                                                             Similar mode coupling between the lateral and axial modes also exists in the reacting case, but appears
                                                                                             mirrored (i.e., with a 180◦ phase shift) from the non-reacting case, as shown in Fig. 11. Most notable
                                                                                             difference in the reacting case is the appearance of multiple peaks in the PSD of the temporal coefficients,
                                                                                             as plotted in Fig. 11(b). These peaks are also much weaker than in the non-reacting case.
                                                                                                 It is clear that in the reacting flow, the jet oscillation becomes less coherent and more chaotic. This
                                                                                             kind of coexistence of various frequencies has been previously documented.1 In the current study, the multi-
                                                                                             frequency feature could stem from a feedback between the jet oscillation and combustion reactions (and heat
                                                                                             release). The former one may alter flame structure and flame lift-off height, which may then trigger a change
                                                                                             in local heat release, leading to a shift of the density balance in the chamber and subsequently affecting the
                                                                                             jet flapping. After a close look at the time-resolved experimental results, these different peaks can all be
                                                                                             related to the same general motion of jet flapping (as modeled in Fig. 7), but at different pace (cycle).

                                                                                                               V.     Flow oscillation induced combustion instabilities
                                                                                                 This section focuses on the influences of the jet flapping on combustion stability. The results from 5 kHz
                                                                                             measurements were grouped and averaged based on phase angles extracted from the temporal coefficients of
                                                                                             the lateral mode of the flow field, such as the one shown in Fig. 9(b). A zero-crossing detection algorithm was
                                                                                             used to assign 0◦ or 180◦ to corresponding frames, assuming a sinusoidal behavior of the temporal coefficients
                                                                                             (to match the phase angles used in Section B). Then the phase angles were extrapolated accordingly for
                                                                                             frames in between of zero crossings. A low pass filter was introduced in the zero-crossing algorithm to discard
                                                                                             frames that fall into fluctuations larger than 100 Hz. An entire cycle was then divided into eight groups,
                                                                                             each spanning a range of 45◦ . This information was then used for phase averaging.

                                                                                             A.   Influence on flame shape
                                                                                             From measurements of simultaneous PIV and OH chemiluminescence imaging at 5 kHz. The OH∗ images
                                                                                             were phase averaged using the method described above, based on the temporal coefficients obtained from

                                                                                                                                                   8 of 19

                                                                                                                             American Institute of Aeronautics and Astronautics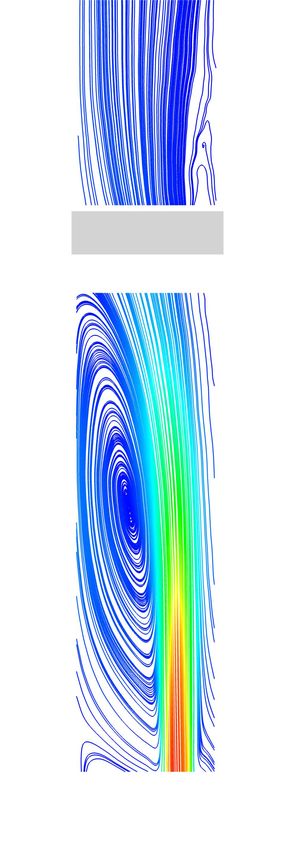
POD of simultaneously measured velocity field.
Figure 12(a) shows the phase-averaged OH∗ emission at the four phase angles corresponding to the jet
flapping shown in Fig. 7. Only part of the bottom section of the combustor was imaged to focus on the root
of the flame. The contour line at signal counts of 20 was also drawn (black line) to qualitatively illustrate
the boundary of the flame. As expected, the flame shape at 0◦ and 180◦ resembles that in the average OH
chemiluminescence shown in Fig. 2. As the jet flaps leftwards (i.e., the LRZ) to reach phase 90◦ , the flame
extends along the right wall further upstream, likely due to the increase of SRZ shown in Fig. 7, which may
bring more burned gas upstream along the right wall. Also, the flame lift-off height reduces slightly and
becomes more attached to the left wall. This coincides with the left- and downward motion of the LRZ,
shown in Fig. 7. On the contrary, during the second half of the cycle, as the jet straightens up, the flame
becomes more detached from the left wall and the flame lift-off height also increases slightly. Again, this
corresponds well to the right- and upward motion of the LRZ. Further more, due to the disappearance of
the SRZ, the flame near the right wall recedes downstream.
In fact, the flame root is more dynamic than the phase averaged images give credit to. This is demon-
strated in Fig. 12(b), in which representative instantaneous OH chemiluminescence images from each phase
group are shown. The flame shape varies notably from their corresponding phase average. This is likely a
result of the multi-frequency jet flapping in the reacting flow discussed in Section D. The jet flapping inten-
siveness (pace and tilt degree) can vary from cycle to cycle. Therefore, its influence on the flame structure
Downloaded by Zhiyao Yin on April 6, 2016 | http://arc.aiaa.org | DOI: 10.2514/6.2016-0185
can vary even in the same phase group. Since the phase averaging lumps all lower frequencies together, it
likely subdued the extreme variations in certain cases. A phase averaging inclusive of only a small frequency
range would result in more pronounced variances from phase to phase. Nevertheless, Fig. 12 demonstrates
that the movement of the LRZ occurred due to jet flapping modifies the flame structure quite notably.
B. Influence on reaction zones
Flow-flame interactions were further examined at a finer scale with simultaneous PIV and OH PLIF mea-
surements at 5 kHz. Figure 13(a) overlaps the phase averaged velocity field (mono-color streamlines) with
OH distribution (color maps). The OH signal was not corrected for laser absorption or fluorescence trapping.
However, these effects are considered rather minor in this lean and low-temperature flame (with a measured
average temperature of up to 1700 to 1800 K18 ). The plot at each phase is stitched together from separate
measurements, although good convergence can be observed at the boundaries of the FOVs (at x=−10 mm).
From top to bottom of Fig. 13(a), the jet is seen to swing left and right, accompanied by a movement
of the LRZ and appearance/disappearance of SRZ, same as observed in the low-order modeling of the flow
field shown in Fig. 7. Such resemblance also lends support to the legitimacy of the low-order modeling in
Section B. This is accompanied by the shifting of the OH boundary (zero intensity counts of OH signal).
Comparing to the phases of 0◦ and 180◦ , OH signal concentrates more towards the left wall at 90◦ , while
more near the boundary at 270◦ . Near the right wall, OH intensity increases as the SRZ appears, matching
the trend shown in OH chemiluminescence seen in Fig. 12.
Fig. 13(b) presents a different perspective of the same phenomena. The velocity magnitude is used to
illustrate the low velocity region (dark blue) in the field. The motion of the LRZ is clearly marked by the
expansion (90◦ ) and shrinkage (270◦ ) of the low velocity region in the given FOV, together with a reduction
(90◦ ) and increase (270◦ ) of the back flow near the left wall. The boundary of the OH distribution shown in
Fig. 13(a) is outlined qualitatively (with a contour line of counts=200) on top of the velocity field. It is clear
that the flame boundary transforms with the low velocity region. This indicates that the recirculation zones
(LRZ and SRZ) not only entrain hot burned gas upstream, but also create low velocity regions that allow
relatively long residence time for better mixing of the burned gas and the fresh air-fuel mixtures, and hence
sustain the flame. The observation in Fig. 12 can then be explained. As the jet oscillates, it influences the
size and location of the LRZ and therefore destabilizes the flame, causing the flame lift-off height to shift
downwards (90◦ ) and upwards (270◦ ). Note that, this also explains the asymmetry seen in the flame shape
in general. The bias mentioned in describing Fig. 2 is a direct result of the low-speed regions in the LRZ,
hence the spatial coincidence of the flame root and the core of LRZ.
A detailed view at the influence of jet flapping on the OH distribution is provided in Fig. 14. Instantaneous
velocity fields and OH signal distributions, selected from two extreme phase groups (90◦ and 270◦ ), are
overlapped to illustrate the flow-flame interactions in the LRZ and SRZ. Note that Fig. 14(a) and (b) are
from two different set of measurements. The regions containing low intensity OH (green-blue) are mostly
accompanied by back flow (refer to vector directions), suggesting that they are mainly recirculated burned
9 of 19
American Institute of Aeronautics and Astronautics
gas. On the other hand, the regions of distinctively high OH signal (red) likely come from superequalibrium
OH and can be treated as a qualitatively marker of the reaction zones. As can be seen, the reaction zones
always distribute along the junctions of the high-velocity jet and the back flow, where opposing flow or
vortices can be identified. These regions also shift along side the jet flapping motion, as evident from
Fig. 14(a) (from top to bottom row). Additionally, at phase angle of 90◦ , the reaction zones appear wider
spread, likely a result of longer flow residence time (i.e., better mixing of burned and unburned gas) in the
LRZ, as shown in Fig. 13. The opposite can be seen in the case at phase angle of 270◦ , due to the increase
of the back flow and thinning of low velocity region. It should be pointed out that the region of high OH
intensity (red) do not correlate directly to the actual thickness of the reaction zone.
The influence of the SRZ is shown in Fig. 14(b). As the SRZ forms when the jet flaps leftwards (90◦ ),
an additional pathway for burned gas entrainment is created opposite to the main flame stabilization region
(i.e., LRZ). Regions with low flow velocity give rise to increased reactivity, as is evident from the spots
of high intensity OH signal. Such pathway is completely closed when the jet flaps to the upright position
(270◦ ).
C. Local flame extinction
From the results shown above, it is tentative to draw a conclusion that the leftwards jet motion may benefit
Downloaded by Zhiyao Yin on April 6, 2016 | http://arc.aiaa.org | DOI: 10.2514/6.2016-0185
flame stabilization by creating large regions with low flow velocity. However, it should be noticed that the
leftward jet flapping essentially reduces the entrainment of the burned gas upstream. One can imagine some
extreme scenarios where the impingement of the jet on the combustor wall would cause blockage of the
backflow. A such scenario is the SRZ. Flame distinguishes in the region when the jet flaps rightwards, as
shown in Fig. 14(b). For the LRZ, it was also observed that in certain cases the jet could temporarily reduce
the entrainment of the burned gas as it flaps leftwards, resulting in local flame extinction. An example
is provided in Fig. 15. A sequence of instantaneous velocity fields and OH distributions is shown with an
arbitrary time zero and their corresponding phase angles labeled above each frame (all from the group of
phase 90◦ ). The velocity fields were low-order reconstructions by using the first 5 POD modes (total energy
contribution
√ about 25%). This is done analogous to Eq. 1, but with the actual temporal coefficients replacing
the λi · sin ψ term and additional Eigenmodes ~ei (i = 1 : 4). This is to smooth out small flow structures
and focus only on the jet flapping. As can be seen, when the jet moves leftwards, the low speed region
retreats downstream, together with a slow down of the back flow. The partial blockage of the back flow
causes the continuous flame to first break into two parts, and results eventually in significant fragmentation
of the flame in the FOV.
However, the flame is able to recover quickly in the FOV following the rightward swinging of the jet, as
depicted by a later sequence of frames in Fig. 16. This sequence happens approximately 3 ms after those
in Fig. 15 and belongs to the next phase group of 135◦ . From Fig. 16, the reentry of burned gas into the
FOV enables a lot of high reactive regions (red). This could be attributed to rather abundant unburned gas
retained in this region after the temporary local extinctions. Over time, these red regions dissipate until
a continuous flame is reestablished in the FOV. Such unstable behavior could account for the sometimes
volatile changes in the flame root, as described in Fig. 12(b).
VI. Conclusions
This paper presented experimental studies of confined, premixed, preheated turbulent flames, generated in
a single-nozzle jet-stabilized gas turbine model combustor. The focus was placed upon the characterization
of self-sustained flow field oscillations in the combustor, and their influence on combustion stability in a
methane-air flame at φ=0.71,a preheating temperature of 300 ◦C, and a jet exit velocity at 150 m/s.
Various views of the flow field inside the combustor measured with both low-speed and kHz particle
imaging velocimetry (PIV) displayed a pronounced recirculation zone on one side of the jet, due to the
off-center placement of the nozzle. Analyses based on proper orthogonal decomposition (POD) of the flow
fields associated four strongest Eigenmodes to a 3-D jet flapping motion. The jet flapping was also seen
accompanied by an up/down, contract/expand motion of the recirculation zones. Combustion reactions
have in general small influences on the average flow field and the jet flapping. However, the POD temporal
coefficients exhibit multiple peaks in the frequency domain, compared to rather monophonic behavior in the
non-reacting case. These different peaks were seen all related to the same general motion of jet flapping, but
10 of 19
American Institute of Aeronautics and Astronauticsat various paces.
From simultaneous PIV and OH chemiluminescence imaging at 5 kHz, both phase averaged and single-
shot OH∗ distributions show a notable variance of flame shape and flame lift-off height. During one flapping
cycle, the flame changed from extending upstream along the walls, to being lifted-off further. Further
examination of such behavior was carried out with simultaneous PIV and planar laser-induced fluorescence
of OH radicals(OH PLIF). A correlation was found between regions of high OH intensity and low-speed flow
(due to recirculation), the latter was viewed as providing relatively long residence time and beneficial for
enhanced mixing of entrained burned gas and fresh gas mixtures. The low-speed regions shifted with the
motion of the recirculation zones during the jet flapping cycle, causing the changes in the flame shape and
its lift-off height.
From instantaneous OH distributions selected from the two extreme phase groups (90◦ and 270◦ ), the
reaction zones (or regions with high reactivity) were seen distributed between the junction of back flow (hot
burned gas) and the unburned jet, where vortices and regions of counter flows (sources of low-speed flow)
could be identified. The spread of the reaction zones also seemed to expand and contract following similar
motions of the recirulation zones, consistent with the phase averaged results. A potential flame-destabilizing
pattern was found in a sequence of instantaneous highspeed images of OH and velocity field. It was seen
that jet flapping towards the confinement resulted in a temporary and partial blockage of the entrainment of
burned gas into the LRZ, leading to local flame extinction. However, the flame was able to quickly recover,
Downloaded by Zhiyao Yin on April 6, 2016 | http://arc.aiaa.org | DOI: 10.2514/6.2016-0185
due to the increase of back flow as the jet flaps away from the chamber wall.
Acknowledgments
Zhiyao Yin acknowledges the financial support within the Helmholtz Postdoc Programme (Grant PD-
112).
References
1 A. Maurel, P. Ern, B. Zielinska, and J. Wesfreid, “Experimental study of self-sustained oscillations in a confined jet,”
Physical Review E, vol. 54, no. 4, p. 3643, 1996.
2 S. V. Gordeyev and F. O. Thomas, “Coherent structure in the turbulent planar jet. part 1. extraction of proper orthogonal
decomposition eigenmodes and their self-similarity,” Journal of Fluid Mechanics, vol. 414, pp. 145–194, 2000.
3 N. Lawson and M. Davidson, “Self-sustained oscillation of a submerged jet in a thin rectangular cavity,” Journal of fluids
and structures, vol. 15, no. 1, pp. 59–81, 2001.
4 M.-P. Verge, B. Fabre, W. Mahu, A. Hirschberg, R. Van Hassel, A. Wijnands, J. De Vries, and C. Hogendoorn, “Jet
formation and jet velocity fluctuations in a flue organ pipe,” The Journal of the Acoustical Society of America, vol. 95, no. 2,
pp. 1119–1132, 1994.
5 K. H. Yu, A. Trouv, and J. W. Daily, “Low-frequency pressure oscillations in a model ramjet combustor,” Journal of
Fluid Mechanics, vol. 232, pp. 47–72, 11 1991.
6 T. Shakouchi, “A new fluidic oscillator, flowmeter, without control port and feedback loop,” Journal of Dynamic Systems,
Measurement, and Control, vol. 111, no. 3, pp. 535–539, 1989.
7 G. Nathan, S. Hill, and R. Luxton, “An axisymmetric ‘fluidic’ nozzle to generate jet precession,” Journal of Fluid
Mechanics, vol. 370, pp. 347–380, 1998.
8 J. Mi, G. Nathan, and R. Luxton, “Mixing characteristics of a flapping jet from a self-exciting nozzle,” Flow, turbulence
and combustion, vol. 67, no. 1, pp. 1–23, 2001.
9 R. Schwarze, J. Klostermann, and C. Brücker, “Experimental and numerical investigations of a turbulent round jet into
a cavity,” International Journal of Heat and Fluid Flow, vol. 29, no. 6, pp. 1688–1698, 2008.
10 A. Mataoui and R. Schiestel, “Unsteady phenomena of an oscillating turbulent jet flow inside a cavity: Effect of aspect
ratio,” Journal of Fluids and Structures, vol. 25, no. 1, pp. 60–79, 2009.
11 B. Kong, M. Olsen, R. Fox, and J. Hill, “Population, characteristics and kinematics of vortices in a confined rectangular
jet with a co-flow,” Experiments in fluids, vol. 50, no. 6, pp. 1473–1493, 2011.
12 O. Semeraro, G. Bellani, and F. Lundell, “Analysis of time-resolved piv measurements of a confined turbulent jet using
pod and koopman modes,” Experiments in fluids, vol. 53, no. 5, pp. 1203–1220, 2012.
13 J. Mi and G. Nathan, “Self-excited jet-precession strouhal number and its influence on downstream mixing field,” Journal
of fluids and structures, vol. 19, no. 6, pp. 851–862, 2004.
14 J. Mi, G. Nathan, and C. Wong, “The influence of inlet flow condition on the frequency of self-excited jet precession,”
Journal of fluids and structures, vol. 22, no. 1, pp. 129–133, 2006.
15 G. Cafiero, G. Ceglia, S. Discetti, S. Ianiro, T. Astarita, and G. Cardone, “The three-dimensional swirling flow past a
sudden expansion,” in PIV13; 10th International Symposium on Particle Image Velocimetry, Delft, The Netherlands, July 1-3,
2013, Delft University of Technology, Faculty of Mechanical, Maritime and Materials Engineering, and Faculty of Aerospace
Engineering, 2013.
11 of 19
American Institute of Aeronautics and Astronautics16 G. Nathan, J. Mi, Z. Alwahabi, G. Newbold, and D. Nobes, “Impacts of a jet’s exit flow pattern on mixing and combustion
performance,” Progress in Energy and Combustion Science, vol. 32, no. 5 - 6, pp. 496 – 538, 2006.
17 Z. Yin, P. Nau, I. Boxx, and W. Meier, “Characterization of a single-nozzle FLOXr model combustor using khz laser
diagnostics,” in Proc. ASME Turbo Expo 2015, Power for Land, Sea and Air, June 15-19, Montreal, Canada, American Society
of Mechanical Engineers, 2015.
18 O. Lammel, M. Stöhr, P. Kutne, C. Dem, W. Meier, and M. Aigner, “Experimental analysis of confined jet flames by
laser measurement techniques,” Journal of Engineering for Gas Turbines and Power, vol. 134, no. 4, p. 041506, 2012.
19 J. Wünning and J. Wünning, “Flameless oxidation to reduce thermal no-formation,” Progress in energy and combustion
science, vol. 23, no. 1, pp. 81–94, 1997.
20 A. Cavaliere and M. de Joannon, “Mild combustion,” Progress in Energy and Combustion science, vol. 30, no. 4, pp. 329–
366, 2004.
21 R. Lückerath, W. Meier, and M. Aigner, “FLOXr combustion at high pressure with different fuel compositions,” Journal
of Engineering for Gas Turbines and Power, vol. 130, no. 1, p. 011505, 2008.
22 O. Lammel, H. Schütz, G. Schmitz, R. Lückerath, M. Stöhr, B. Noll, M. Aigner, M. Hase, and W. Krebs, “FLOXr
combustion at high power density and high flame temperatures,” Journal of Engineering for Gas Turbines and Power, vol. 132,
no. 12, p. 121503, 2010.
23 H. Schütz, R. Lückerath, B. Noll, and M. Aigner, “Complex chemistry simulation of FLOXr : Flameless oxidation
combustion,” International Journal of Energy for a Clean Environment, vol. 8, no. 3, 2007.
24 H. Schütz, R. Lückerath, T. Kretschmer, B. Noll, and M. Aigner, “Analysis of the pollutant formation in the FLOXr
combustion,” Journal of Engineering for Gas Turbines and Power, vol. 130, no. 1, p. 011503, 2008.
25 G. Berkooz, P. Holmes, and J. L. Lumley, “The proper orthogonal decomposition in the analysis of turbulent flows,”
Downloaded by Zhiyao Yin on April 6, 2016 | http://arc.aiaa.org | DOI: 10.2514/6.2016-0185
Annual review of fluid mechanics, vol. 25, no. 1, pp. 539–575, 1993.
26 M. Stöhr, R. Sadanandan, and W. Meier, “Phase-resolved characterization of vortex-flame interaction in a turbulent swirl
flame,” Experiments in Fluids, vol. 51, no. 4, pp. 1153–1167, 2011.
27 D. Rempfer and H. F. Fasel, “Evolution of three-dimensional coherent structures in a flat-plate boundary layer,” Journal
of Fluid Mechanics, vol. 260, pp. 351–375, 2 1994.
12 of 19
American Institute of Aeronautics and AstronauticsFigure 5: POD spa-
tial modes of the non-
reacting flow field:
(a) Front lateral mode
(b) Front axial mode
(c) Side lateral mode
(d) Side axial mode
Downloaded by Zhiyao Yin on April 6, 2016 | http://arc.aiaa.org | DOI: 10.2514/6.2016-0185
(a) (b) (c) (d)
Lateral Figure 6: Energy fraction of POD Eigenmodes
0.16
Energy fraction
Front, b
0.12 Front, m
Axial
Side
0.08
0.04
0.00
1 10 100
Modes
13 of 19
American Institute of Aeronautics and Astronautics0◦ 90◦ 180◦ 270◦
0◦ 90◦ 180◦ 270◦
Downloaded by Zhiyao Yin on April 6, 2016 | http://arc.aiaa.org | DOI: 10.2514/6.2016-0185
Figure 7: Low-order modeling of phase-dependent flow fields based on the lateral modes
0◦ 90◦ 180◦ 270◦ 0◦ 90◦ 180◦ 270◦
Figure 8: Low-order modeling of phase-dependent flow fields based on the axial modes
14 of 19
American Institute of Aeronautics and AstronauticsFigure 9: (a) POD spa-
(b) 4 aLateral
tial modes of the non-
reacting flow field in the
3 a,Lateral
2
front view and (b)&(c) fre-
a √λ
1
quency analysis of their
temporal coefficients, data 0
taken at 5 kHz -1
-2
(a) -3
0.10 0.12 0.14 0.16 0.18 0.20
Time [s]
(c) 20
39.8 Hz
16
Power [a.u.]
12 aLateral
8 a,Lateral
Downloaded by Zhiyao Yin on April 6, 2016 | http://arc.aiaa.org | DOI: 10.2514/6.2016-0185
4
0
50 100 150 200 250 300
f [Hz]
Figure 10: Coupling of (a) (c) 5
the temporal coefficients
between the lateral and ax- 4 aLateral 4
o
3
90
ial modes of the front view 3 aAxial
aAxial √λAxial
in the non-reacting flow 2 90o 2
1
a √λ
1
0
-1
0
-2
270o
270
o -1
-3 -2
0.30 0.32 0.34 0.36 0.38 0.40
-3
Time [s] -3 -2 -1 0 1 2 3
aLateral √λLateral
(b)
(d)
20 Chamber
39.8 Hz
16 Jet flapping track
(Lateral) 270o 0o/180o 90o
Power [a.u.]
12 aLateral
8 aAxial
19.9 Hz
4
nozzle
0
50 100 150 200 250 300
f [Hz] 90o 0o/180o 270o (Axial)
15 of 19
American Institute of Aeronautics and AstronauticsFigure 11: Coupling of 4 (b)
the temporal coefficients (a)
between the lateral and ax- 3
ial modes of the front view 2 12
aAxial √λAxial
in the reacting flow 1
0 8
Power [a.u.]
aLateral
-1
aAxial
-2 4
-3
-4 0
-3 -2 -1 0 1 2 3 50 100 150 200 250 300
Downloaded by Zhiyao Yin on April 6, 2016 | http://arc.aiaa.org | DOI: 10.2514/6.2016-0185
aLateral √λLateral f [Hz]
(a) 0◦ 90◦ 180◦ 270◦
Figure 12: OH chemilu-
minescence images at dif-
ferent phase angles: (a)
phase averaged based on
the temporal coefficients of
the lateral mode (b) rep-
resentative instantaneous
shots from different phase
(b) groups
16 of 19
American Institute of Aeronautics and AstronauticsFigure 13: Phase averaged
OH chemiluminescence based
on the temporal coefficients of
the lateral mode
Downloaded by Zhiyao Yin on April 6, 2016 | http://arc.aiaa.org | DOI: 10.2514/6.2016-0185
(a) (b)
17 of 19
American Institute of Aeronautics and Astronautics90◦
Downloaded by Zhiyao Yin on April 6, 2016 | http://arc.aiaa.org | DOI: 10.2514/6.2016-0185
270◦
(a) field and OH distribution chosen
Figure 14: Instantaneous velocity (b)from two extreme phase groups.
0 ms (96◦ ) 0.2 ms (98◦ ) 0.4 ms (100◦ ) 0.6 ms (102◦ ) 0.8 ms (104◦ )
Figure 15: Instantaneous velocity fields and OH distributions in LRZ depicting flame fragmentation
18 of 19
American Institute of Aeronautics and AstronauticsDownloaded by Zhiyao Yin on April 6, 2016 | http://arc.aiaa.org | DOI: 10.2514/6.2016-0185
3.6 ms (136◦ ) 3.8 ms (138◦ ) 4.0 ms (140◦ ) 4.2 ms (142◦ ) 4.4 ms (144◦ )
Figure 16: Instantaneous velocity fields and OH distributions in LRZ depicting flame recovery after tem-
porary local extinction
19 of 19
American Institute of Aeronautics and AstronauticsYou can also read