Mixed Signals Toronto Transit in a North American Context - Fares - Networks - Budgets - Governance - CodeRedTO
←
→
Page content transcription
If your browser does not render page correctly, please read the page content below
Mixed Signals
Toronto Transit in a North American Context

      Fares – Networks – Budgets – Governance

                       2018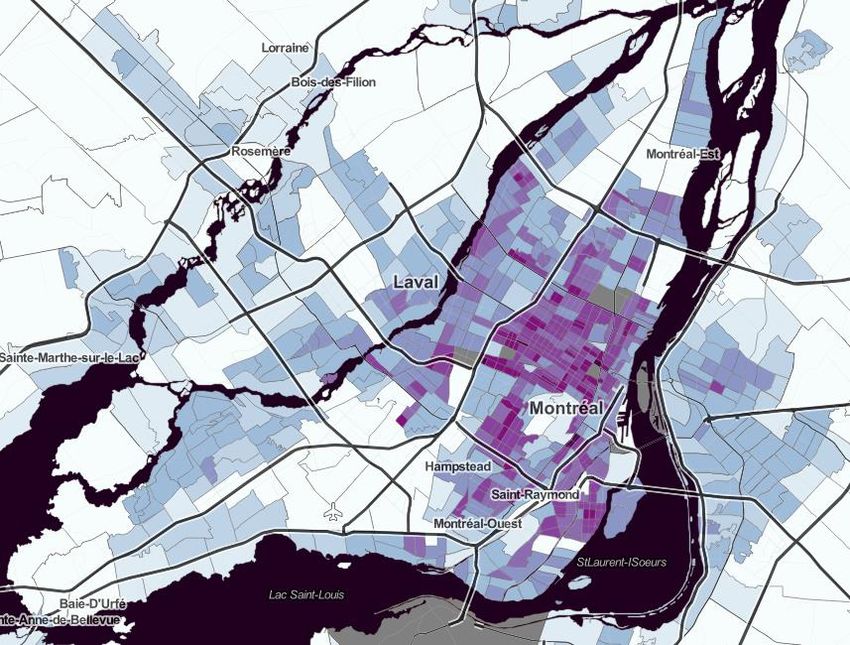
Mixed Signals 2018

About CodeRedTO                                                   Report Authors & Contributors

CodeRedTO is a consciously non-partisan, volunteer-run, local     Cameron MacLeod is a CodeRedTO cofounder and Executive
and regional transit advocate. We promote more and better         Director, and has explored transit systems in 25 cities worldwide,
transit options for more residents; using all available           in ten countries and on three continents. So far. By day he runs a
                                                                  nationwide technical team at a Canadian customer intelligence
technologies where appropriate; creating better information for   software company.
better decision-making; completion of efficient and approved
plans; and support increased, predictable funding for public      Patricia Wood is Professor of Geography and co-founder of the
transit expansion and operation.                                  City Institute at York University. She has particular interests in
                                                                  democratic practices and people’s mobility. She is also an urban
CodeRedTO is funded through personal donations and grants         affairs columnist for Spacing.ca.
from non-profit agencies and foundations, and directed by an
                                                                  Matthew Whittier is a graduate of Queen's University in
advisory board with no financial interest in any transportation
                                                                  Mechanical Engineering, who has worked in renewable energy
projects or agencies.                                             and whose interest in urban planning and transportation
CodeRedTO was founded in 2011.                                    brought him into this project.
                                                                  Benjamin Wert works in arts administration, and has a keen
                                                                  interest in municipal affairs. His favourite transit experiences
        info@CodeRedTO.com                                        include riding every L line in Chicago from end to end, going
                                                                  across Toronto’s Price Edward Viaduct at twilight, and using the
                                                                  Roosevelt Island tramway.

        @CodeRedTO
                                                                  Acknowledgements
                                                                  This report would not exist without the efforts of dedicated TTC,
        CodeRedTO
                                                                  City of Toronto, and Metrolinx employees, and transit-involved
                                                                  teams across North America bringing safe and reliable public
                                                                  transit to residents each day, under (as this report shows)
                                                                  significantly challenging variations in funding, network
                                                                  resilience, and governmental accountability.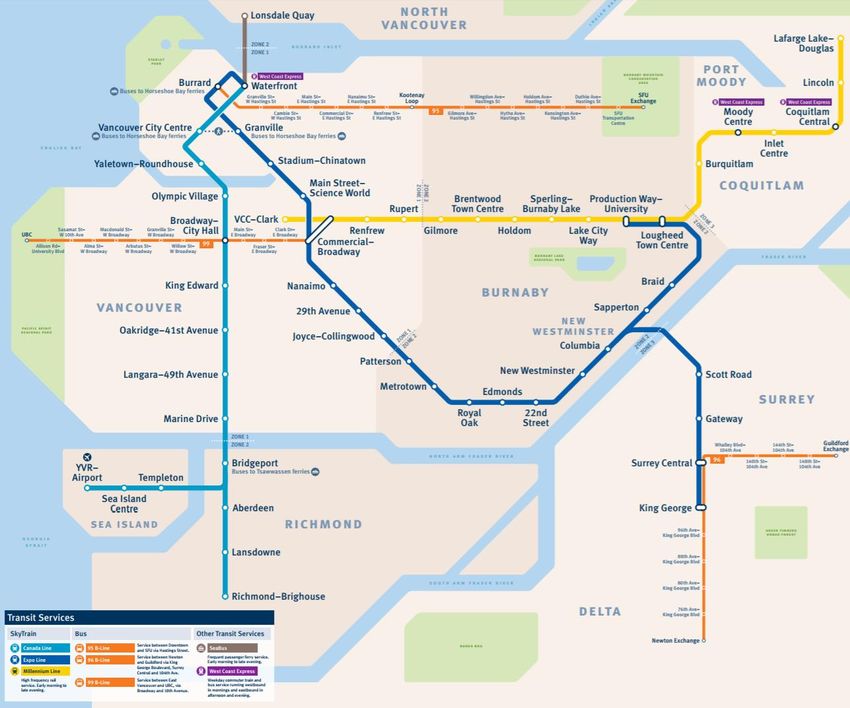
Mixed Signals 2018

                                        Executive Summary
This report compares Toronto to similar local and               Toronto has…
commuter rail transit systems in several cities in Canada
                                                                •   2nd-Highest public transit ridership level in NA
and the United States, examining specifics of fares, funding,
                                                                •   2nd-Highest public transit commuter mode share in NA
network coverage, and governance. The goal of the
                                                                •   Strong suburban coverage and service levels
comparisons is to see what Toronto is doing well and how it
could do better.                                                Toronto needs…

Transit networks are highly complex and dynamic systems.        •   An improved funding model to address low subsidy
While there is no perfect or universal model, there is              level and lack of dedicated revenue streams
always something to learn from how other cities build and       •   A less-politicized, more resilient governance structure
manage transit. This report finds that Toronto is lagging       •   More complexity in its rapid transit network
behind other comparator cities in key ways, while               •   Less reliance on tunneled infrastructure in the current
outperforming in others. Any changes to Toronto’s regional          limited funding environment
transit network structures must be considered on the basis      •   A more accessible monthly pass
of both transparency and local accountability.                  CodeRedTO recommends these immediate investments:
Transit systems in Asia and Europe have impressive              •   Add new, predictable, sustainable revenue
achievements, but they emerge from different political and      •   Add prioritized surface transit lanes on both
geographical environments. Similarly, New York City’s               inner core and suburban avenues
subway comes from an entirely different time period and         •   Reduce overall cost and early commitment
starting point. Comparing Toronto’s transit with other              requirements for monthly passes
systems in Canada and the United States shows us what is
                                                                CodeRedTO recommends these longer-term goals:
realistic in the North American context.
                                                                •   Create new city-centred but regionally-collaborative
Given our unique and vulnerable position in terms of                governance structures
funding structures, network design, and expansion choices,      •   Implement regional fare integration which builds on
this report finds specific investment goals desirable to            the city’s successful no-zone flat fare structure
protect the future of public transit in Toronto. ◼              •   Implement regional network integration only where it
                                                                    can build increased ridership and mode share

                                                                                                                              1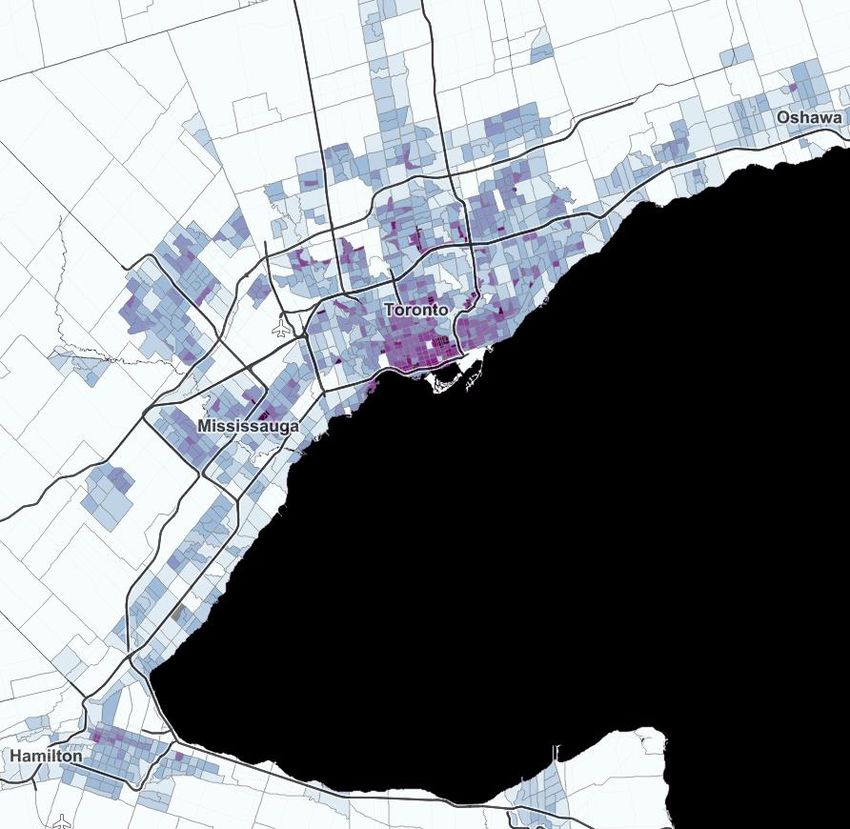
Mixed Signals 2018
Comparator City Selection
Regardless of criteria, any selection of cities While a comparison to New York City’s iconic By contrast, Calgary’s network consists of a
will have faults and negative effects on the and extensive subway system is seemingly single transit mode, and features no regional
comparison itself. In this report, an attempt unavoidable in Toronto media and at City commuter rail nor a modern fare card.
was made to provide a reasonable breadth of Council, it is inappropriate for this report. This Cities such as Philadelphia, San Diego, and
comparisons across city and urban area area has an urban area population of over Dallas have relevant network structures for the
populations, transit network complexity and three times that of the GTA, and a heavy rail curious transit policy researcher, but were not
modes, and relevance to Toronto. network which is multiple decades older. included in this report.
Rail in Rail in Non- Multi-Mode Fare
City Urban Heavy Regional Rail, Bus,
Exclusive Exclusive and Card
Pop. Area Rail Rail Service Parking, and…
ROW ROW Multi-Line System
New York City MTA 8.6m 20.3m ◼ ◼ ◼ ◼
Los Angeles Metro 4.1m 13.3m ◼ ◼ ◼ ◼ ◼ ◼
Toronto TTC 2.8m 7.2m ◼ ◼ ◼ ◼ ◼ ◼
Chicago CTA 2.7m 9.5m ◼ ◼ ◼ ◼
Houston Metro 2.2m 6.8m ◼ ◼ ◼
Montreal STM 1.8m 4.1m ◼ ◼ ◼ ◼ On-call / Taxibus
Philadelphia SEPTA 1.6m 6.1m ◼ ◼ ◼ ◼ ◼
San Diego MTS 1.4m 3.1m ◼ ◼ ◼ ◼
Dallas DART 1.3m 7.4m ◼ ◼ ◼ ◼ On-call / Taxibus
Calgary Transit 1.2m 1.4m ◼ ◼
Washington DC Metro 0.7m 6.1m ◼ ◼ ◼ ◼ ◼ ◼
Boston MBTA 0.7m 4.7m ◼ ◼ ◼ ◼ ◼ ◼ Ferries
Vancouver Translink 0.6m 2.5m ◼ ◼ ◼ ◼ Ferries
2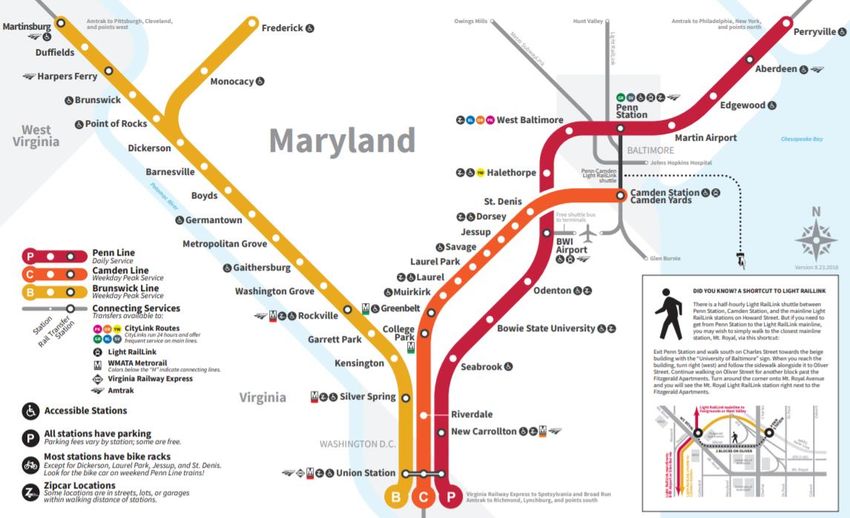
Mixed Signals 2018

Fare Structures
There is no perfect or universal structure for public transit fares.              Commonalities                               Differences
Costs, passes, structures, and even whether to charge at all vary
                                                                                • TTC fares have risen far above        • TTC the only agency examined
widely around the world, but within North America we find similar
                                                                                  the rate of inflation over the          with an annual pass option,
fares, structures, and a remarkable continent-wide conclusion that
                                                                                  last twenty years                       disproportionately benefiting
public transit agencies shall charge for their service.
                                                                                • A single fare zone for the core         higher-income riders
The mobility options provided to residents are part of a city’s                   urban area, often across              • TTC the only agency examined
democratic practice. As we examine the costs to riders, we should                 multiple modes                          required to cover over two-
be thinking about how to more efficiently provide more service, to              • No fare capping option for the          thirds of its operating
more residents, and recognize the diversity of needs and payment                  core urban transit system               expenses from the farebox
capacity. It is also key to create a sustainable model to ensure long-
term mobility within our cities. ◼
                                                                                • Little regional fare integration

Our report found Toronto’s transit fares and goals      what contradictory role for transit riders, as they    urban area with expensive core housing, this can
contrast with other cities in key ways.                 are designed to provide a discount for higher-         be a form of travel subsidy from short-trip riders
                                                        volume use, but are usually only available to those    to long-trip riders.
Toronto’s principal transportation provider, the        with sufficient disposable income to pre-pay for
TTC, has broadly-typical public transit fares, with a   the pass in expectation of benefiting later.           A remarkable commonality across nearly every
cash fare of $3.25 Canadian, close to or matching                                                              city studied is the magnitude of fare increases: in
Montreal, Boston, Chicago, and comparable to            One technology tool available with electronic fare     every city outside Los Angeles, transit fares rose
both Vancouver and Washington, D.C.                     cards is fare capping, which automatically reduces     faster than inflation over the last twenty years,
                                                        or eliminates the incremental cost to the rider        sometimes dramatically. The TTC’s adult cash fare
All comparator city fares sit within the $1.60-         once a certain threshold has been reached. GO          rose 29% faster than inflation from 1998-2018.
$3.25 CAD range for the single zone or the core         Transit provides this in lieu of monthly passes, via
zone, and up to around $7.80 CAD at peak for the        the PRESTO card also being adopted by the TTC.         The most alarming discovery in CodeRedTO’s
distance-based and zone-based systems. The              However, fare capping remains rare even as             research has been that while all public transit
regional commuter rail systems typically have           electronic fare cards proliferate, due to perceived    agencies worldwide contribute to operating
separate fare systems, rarely integrated with the       fare revenue risk. Some systems “split the             expenses via the farebox, the TTC relies on fares
core local agency, with exclusively distance-based      difference,” such as Houston Metro’s requirement       for two-thirds of its base operating budget, a
fares.                                                  of a custom card in order to gain access to            level not seen in any other city in North America.
                                                        capping.
Toronto’s daily and weekly pass cost levels                                                                    When combined with inadequate and insecure
approach the median among the cities reviewed.          Common to nearly all the reviewed cities is a          funding, the vulnerability of the TTC is particularly
But what sets it apart are its continentally-unique     single flat fare, an international best practice for   acute.
annual adult Metropass, and a significantly more        transit access which provides dramatically
costly monthly pass. All passes perform a some-         different travel distances for the same fare. In an

                                                                                                                                                                       3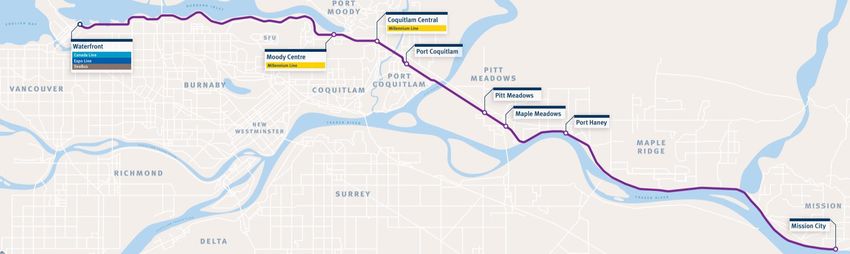
Mixed Signals 2018

                                            Toronto (TTC)

                 $3.25 cash
                 $3.00 fare card / token
                                                                   Fares vs Inflation 1998-2018

                                                                                                            +87.50%
Transfer Rules   Free transfers up to two hours in any
                 direction with fare card.

Fare Zones       Single zone, single fare

Separate         GO commuter rail
Regional Fares   Zone fares $4.77-$18.50, monthly cap                                                        +48.12%

Daily Pass       $12.50 (3.85x cash fare)
                                                                                                             +45.24%
Weekly Pass      $43.75 (13.5x cash fare)

Monthly Pass     $146.25 (45x cash fare)

Annual Pass      $1,608.00 (41.23x cash fare, monthly)

                                                         1998      2002    2006         2010        2014         2018
20-year Fare Δ   +87.50% ($1.75 cash in 1998)
                                                                TTC Fare   Canada Inflation      Ontario Inflation

                                                                                                                        4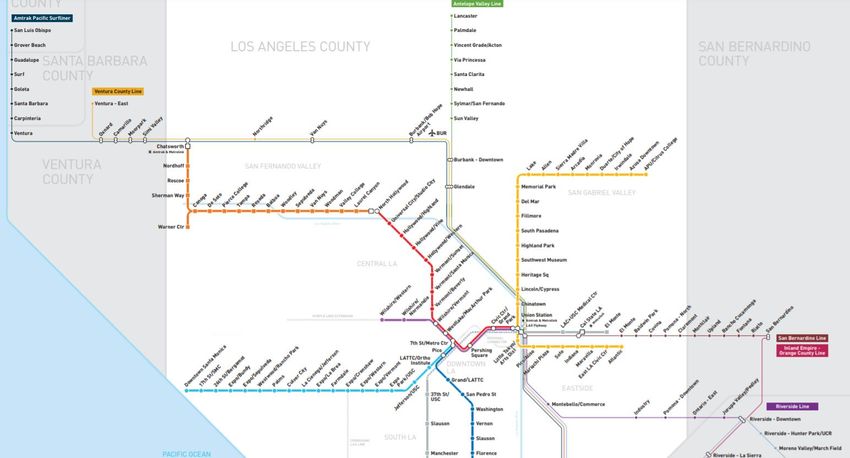
Mixed Signals 2018

                                            Boston (MBTA)

                 $2.75 cash
                 $2.25 fare card
                                                                   Fares vs Inflation 1998-2018
                                                                                                           +223.53%
Transfer Rules   Rail to rail: free
                 First transfer to other modes:
                 discounted within first two hours only

Fare Zones       Single zone, fare varies by mode

Separate         MBTA Commuter Rail
Regional Fares   Zone fares $2.25-$12.50

Daily Pass       $12.00 (4.4x cash fare)
                                                                                                             +59.97%
Weekly Pass      $21.25 (7.7x cash fare)

Monthly Pass     $84.50 (30.7x cash fare)                                                                    +54.09%

Annual Pass      n/a
                                                          1998     2002      2006        2010       2014             2018
20-year Fare Δ   +223.53% ($0.85 cash in 1998)
                                                                 MBTA Fare     USA Inflation      Boston Inflation

                                                                                                                            5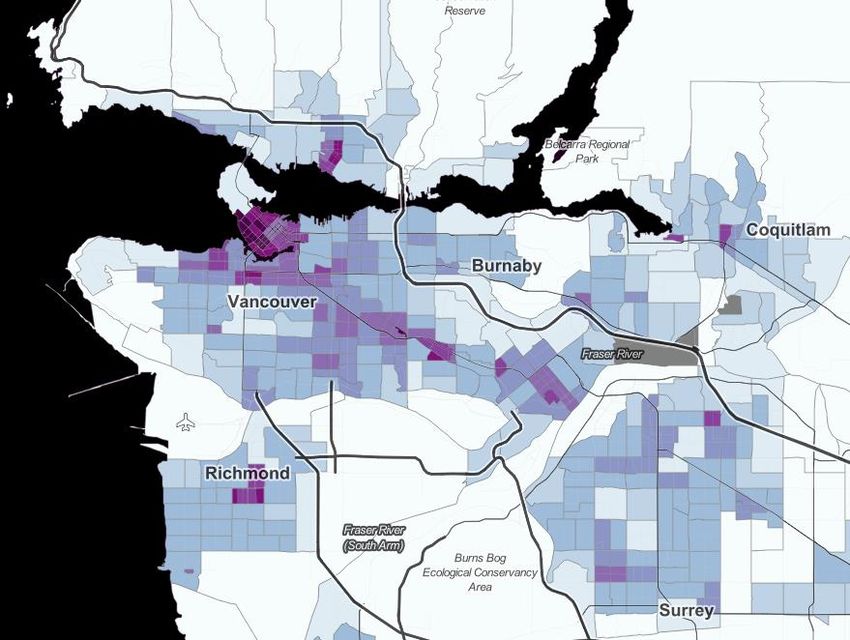
Mixed Signals 2018

                                           Chicago (CTA)

                 $3.00 cash
                 $2.50 fare card
                                                                          Fares vs Inflation 1998-2018

Transfer Rules   $0.25 for train or up to $0.30 for bus, for                                                   +66.67%
                 up to 2 additional rides within 2 hours.
                 Only available using fare card.

Fare Zones       Single zone, fare varies by mode. Airport                                               +54.09%
                 service +$5.00

Separate         Metra Commuter Rail
Regional Fares   Zone fares, $4-$8.25                                                                           +44.57%

Daily Pass       $10.00 (3.3x cash fare)

Weekly Pass      $33.00 (11x cash fare)

Monthly Pass     $105.00 (35x cash fare)

Annual Pass      n/a
                                                               1998       2002    2006       2010      2014         2018
20-year Fare Δ   +66.67% ($1.50 cash in 1998)                         CTA Fare    USA Inflation      Chicago Inflation

                                                                                                                           6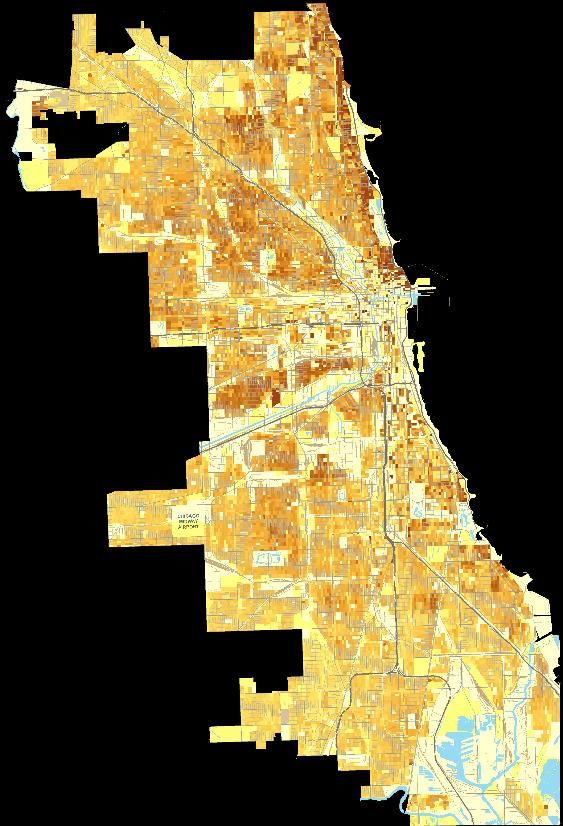
Mixed Signals 2018

                                          Houston (Metro)

                 $1.25 cash or fare card
                                                                       Fares vs Inflation 1998-2018
                                                                                                             +150.00%

Transfer Rules   Free transfers up to three hours in any
                 direction with fare card.

Fare Zones       Single zone, single fare

Separate         Express Park & Ride bus service
Regional Fares   Zone fares $2.00-$4.50

Daily Pass       $3.00 (2.4x cash fare)                                                                       +54.91%

Monthly Pass     n/a
                                                                                                              +54.09%
Weekly Pass      n/a

Annual Pass      n/a
                                                           1998       2002     2006        2010       2014        2018
20-year Fare Δ   +150.00% ($0.50 cash in 1998)
                                                                  Metro Fare    USA Inflation       Houston Inflation

                                                                                                                         7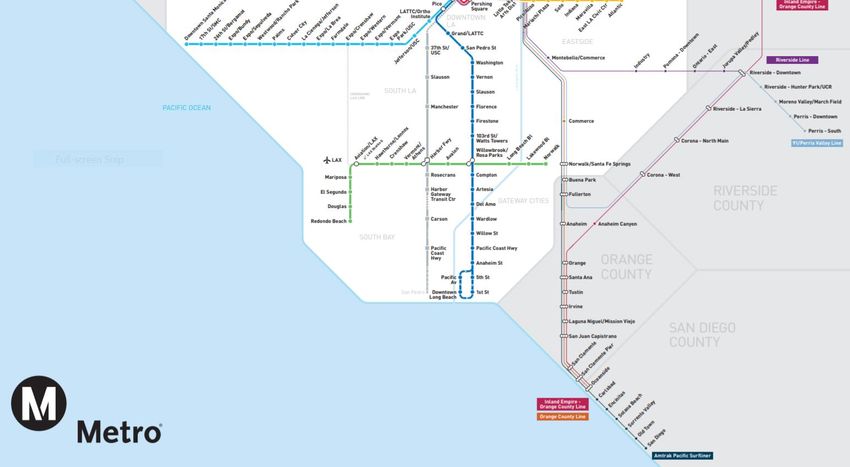
Mixed Signals 2018

                                    Los Angeles (Metro)

                 $1.75 cash or fare card
                                                                    Fares vs Inflation 1998-2018
                                                                                                                 +63.60%
Transfer Rules   $0.50 for transfer to a non-Metro bus
                 within 2 hours

Fare Zones       Single zone, single fare
                                                                                                                 +54.09%
Separate         Metrolink Commuter Rail
Regional Fares   Zone fares $2.75-$27.50                                                                         +29.63%

Daily Pass       $7.00 (4x cash fare)

Weekly Pass      $25.00 (14.3x cash fare)

Monthly Pass     $100.00 (57.1x cash fare)

Annual Pass      n/a
                                                         1998       2002          2006         2010      2014         2018
20-year Fare Δ   +63.60% ($1.35 cash in 1998)
                                                                L.A. Metro Fare          USA Inflation    L.A. Inflation

                                                                                                                             8
Mixed Signals 2018
Montreal (STM)
$3.25 cash or fare card
Fares vs Inflation 1998-2018
Transfer Rules Single continuous trip (multi-vehicle)
+75.68%
Fare Zones Single zone, single fare
Separate EXO commuter bus and rail
Regional Fares Zone fares $4.75-$9.75
+45.24%
Daily Pass $10.00 (3.1x cash fare)
Weekly Pass $26.25 (8.1x cash fare) +39.63%
Monthly Pass $85.00 (26.2x cash fare)
Annual Pass n/a
1998 2002 2006 2010 2014 2018
20-year Fare Δ +75.68% ($1.85 cash in 1998)
STM Fare Canada Inflation Quebec Inflation
9Mixed Signals 2018
Vancouver (Translink)
$2.95-$5.70 cash (3 zones)
$2.30-$4.40 fare card
Fares vs Inflation 1998-2018
+96.67%
Transfer Rules Free transfers for 90 minutes
Fare Zones 3 zones, airport exit +$5.00
Separate West Coast Express Commuter Rail
Regional Fares Zone fares $6.25-$12.45
+45.24%
Daily Pass $10.25 (5.4x 1-zone cash fare)
Weekly Pass n/a
+36.08%
Monthly Pass $95.00 (32.2x 1-zone cash fare)
Annual Pass n/a
1998 2002 2006 2010 2014 2018
20-year Fare Δ +96.67% ($1.50 cash in 1998)
Translink Fare Canada Inflation BC Inflation
10Mixed Signals 2018
Washington, D.C. (WMATA)
$2.25-$6.00 cash or fare card (distance-
based, in peak hours)
Fares vs Inflation 1998-2018
+104.55%
Transfer Rules Train: one single ride, no transfer
Bus: free transfers up to two hours
$0.50 discount if combining modes
Fare Zones Combination of distance and zone
Separate MARC and VRE Commuter Rail +60.01%
Regional Fares Zone fares $3.40-$13.00
Daily Pass $14.75 (6.6x 1-zone cash fare)
+54.09%
Weekly Pass $60.00 (26.7x 1-zone cash fare)
Monthly Pass n/a
Annual Pass n/a
1998 2002 2006 2010 2014 2018
20-year Fare Δ +104.55% ($1.10 cash in 1998) Base Fare USA Inflation Wash. DC Inflation
11Mixed Signals 2018
Base Cash Fare vs Inflation 1998-2018
Boston MBTA, +223.53%
Houston Metro, +150.00%
Wash. D.C. Metro, +104.55%
Vancouver Translink, +96.67%
Toronto TTC, +87.50%
Montreal STM, +75.68%
Chicago CTA, +66.67%
USA Inflation, +54.09%
Canada Inflation, +45.24%
L.A. Metro, +29.63%
1998 2018
12Mixed Signals 2018
Pass Multipliers
Number of Cash Fares to Match Pass Cost
Daily Weekly Monthly
(where available) (where available)
Vancouver Translink 5.4 32.2
Montreal STM 3.1 8.1 26.2
Toronto TTC 3.9 13.5 45.0
Houston Metro 2.4
Chicago CTA 3.3 11.0 35.0
L.A. Metro 4.0 14.3 57.1
Boston MBTA 4.4 7.7 30.7
Wash. D.C. Metro 6.6 26.7
13Mixed Signals 2018
Network Design
There is no perfect or universal structure for the public transit Commonalities Differences
network. But there are commonalities among many cities, and
lessons to be learned. Network mobility and resilience is a key
• Strong ridership and mode • 2nd-highest proportion of
factor in increased commuter mode share, and as we design our
share similar to other tunneled transit increases
networks, we should be thinking about how to address unserved
Canadian cities costs and construction time
needs, how to create an adaptable travel grid, and how to benefit • Multi-decade history brings • Lower number of lines
most from network effects. These are all essential characteristics of expansion goals into conflict reduces coverage and
a strong transit network. with modern standards network benefits
• Nearly all cities have regional • Choosing extensions over new
Political decisions affecting the efficiency of the network have
commuter rail in addition to lines means small issues
ripple effects which impact riders across the network, changing
urban core service create large interruptions
commuter mode share, non-peak ridership decisions, and system
revenue. ◼
A strong transit network serves a diversity of regional coverage, and has built ridership It is notable that some of the busiest public
destinations and a diversity of riders. There are exceeding most other cities, especially along its transit routes are found in suburban areas of
many aspects to the development of a network higher-capacity Lakeshore lines. Toronto (such as along Finch Avenue). This
with good connectivity. Simply put, the network demonstrates that it is possible to build strong
must connect to places people want to go. Toronto’s local rail network is less complex, with transit ridership in areas with lower density that
less coverage than many cities. Downtown core the city core.
All cities in the study have multiple-mode local streetcar lines improve the network greatly, but
transit, and all offer regional rail except Houston. at low resilience due to mixed-traffic street Toronto also has the highest rate of transit use, as
Every agency examined has responsibility for design. When contrasted with every other city in a proportion of commuters, of all metro areas in
some private vehicle parking lots, alongside the the study, it is clear Toronto’s heavy reliance on the study. This success is driven by transit use in
expected bus and rail services, while a few add two very long rail lines is unusual. More and into Toronto. Local transit use in cities outside
on-call services, ferries, and even bike share. complexity allows for greater network Toronto remains quite low. While it has a much
connectivity and adaptability. The Eglinton lower ridership that Toronto local transit,
It is popular to contrast Toronto’s subway network Crosstown LRT line will strengthen Toronto’s suburban use of regional rail is strong along the
with New York, Paris, Chicago, or Boston, but network considerably. lakeshore.
Toronto started building its rail network decades
later. Toronto’s early investments have given Toronto’s local transit has the highest ridership Good network infrastructure lays the foundation
Toronto a good foundation, but it is disingenuous of all systems in the study. Unlike many other for strong ridership, but service frequency and
to contrast these cities without noting that the cities, the most common mode of transit is the reliability are more significant for building and
New York City subway was essentially complete bus, whose network connects well to the subway retaining ridership in each corridor.
before Toronto even started. system. Indeed, Toronto’s subway is only busy
because of busy feeder buses, given low density
Toronto’s GO Train network provides wide near most stations.
14Mixed Signals 2018
Terminology
Terms Description
Heavy Rail (Subway, Metro) High-capacity electric railway operating in an exclusive right-of-way, often but not always
tunneled or elevated.
Example: the TTC subway is Heavy Rail, under North American terminology.
Exclusive ROW Light/Intermediate Rail Intermediate-capacity electric railway operating in an exclusive right-of-way.
Example: the TTC “Scarborough RT” is intermediate capacity, and once in operation the
Eglinton Crosstown will be over 50% exclusive right-of-way.
Semi-exclusive ROW Light Rail Intermediate-capacity electric railway operating in a mixture of rights-of-way, including
tunneled, elevated, and at-grade.
Example: the TTC 501 Queen streetcar at High Park operates in exclusive sections which are
broken up by mixed-traffic intersections.
Non-exclusive ROW (Streetcar, Tram) Intermediate-capacity electric railway operating in a mixed-traffic environment, subject to
blockage by non-transit vehicles.
Example: the TTC 504 King streetcar shares its lane with passenger cars for almost its entire
route, despite being Toronto’s single busiest surface transit line.
Regional Rail Higher-speed heavy rail operating in an exclusive right-of-way at greater distances, often
connecting disparate cities.
Example: Metrolinx GO Transit
Unlinked Trips A single boarding of a single vehicle
Example: bus> subway > bus = 3 unlinked trips
Linked Trips A series of boardings required to complete a single continuous journey
Example: bus > subway > bus = 1 linked trip
15Mixed Signals 2018
Toronto
Mode Length Stations/Stops
Heavy Rail 72.6 km 70
(Subway, Metro) (79.2 in late 2020’s) (71 in late 2020’s)
Exclusive ROW Light 6.4 km 6
& Intermediate Rail (16.4 in ~2022) (19 in ~2022)
Semi-exclusive ROW 23.2 km 68
Light Rail (43.2 in ~2022) (98 in ~2022)
Non-exclusive ROW 83 km ~300
(Streetcar, Tram)
Regional Rail 452 km 66
(non-TTC)
Construction Note: Lines 5 & 6 scheduled to begin service in
2021-22. Line 3 to close in late 2020’s,
as new subway extension with one stop
opens, serving busiest Line 3 stop.
Unlinked TTC Heavy Rail: 877,300
Trips Per Day TTC Intermediate: 37,800
(APTA 2017) TTC Streetcars: 287,800
TTC Bus: 1,406,800
GO Rail: 204,200
Wheel-Trans: 13,800
TTC Ridership (2017) 856,953,100 (unlinked trips, APTA)
535,000,000 (linked rides, TTC)
16Mixed Signals 2018
Boston
Mode Length Stations Construction Note: Green Line light rail extension in progress
Heavy Rail 68.1 km 62 Unlinked Heavy Rail: 321,000
(Subway, Metro) Trips Per Day Light Rail: 204,000
(APTA 2017) Bus: 233,100
Exclusive ROW Light 37 km 66 Commuter Rail: 123,100
& Intermediate Rail (43.9 in ~2022) (73 in ~2022) ParaTransit: 6,400
Regional Rail 641 km 137 Ridership (2017, APTA) 387,629,600 (unlinked trips)
17Mixed Signals 2018
Chicago
Mode Length Stations
Heavy Rail (Subway, Metro) 169 km 146
Regional Rail (non-CTA) 785 km 242
Unlinked CTA Heavy Rail: 729,200
Trips Per Day CTA Bus: 805,500
(APTA 2017) Metra Commuter Rail: 285,400
PACE ParaTransit: 17,600
CTA Ridership (2017, APTA) 479,435,200 (unlinked trips)
Commuter Rail
18Mixed Signals 2018
Houston
Mode Length Stations/Stops
Semi-exclusive ROW 36.5 km 39
Light Rail
Unlinked Light Rail: 61,100
Trips Per Day Bus: 222,800
(APTA 2017) ParaTransit: 6,400
Ridership (2017, APTA) 88,799,300 (unlinked trips)
19Mixed Signals 2018
Los Angeles
Mode Length Stations/
Stops
Heavy Rail 31.6 km 22
(Subway, Metro)
Exclusive ROW Light 31.3 km 14
& Intermediate Rail
Semi-exclusive ROW 110.1 km 68
Light Rail (123.8 in (76 in
~2019) ~2019)
Regional Rail 859 km 61
(non-Metro)
Construction Note: New Crenshaw/LAX Light
Rail line on west side of city,
scheduled to open in 2019.
Unlinked Subway: 138,500
Trips Per Day Light Rail: 219,900
(APTA 2017) Bus: 896,400
Commuter Rail: 37,800
ParaTransit: 10,800
Metro Ridership 397,489,400 (unlinked trips)
(2017, APTA)
20Mixed Signals 2018
Montreal
Mode Length Stations
Heavy Rail (Subway, Metro) 69.2 km 68
Regional Rail (non-STM) 256.4 km 62
Construction Note Réseau express métropolitain (REM) light
rail lines in the centre, north, and west of
city, scheduled to begin service in 2021.
Unlinked Trips Per Day Subway: 1,298,400
(APTA 2017) Bus: 917,000
Commuter Rail: 84,900
ParaTransit: 13,900
Ridership (2017, APTA) 643,087,600 (unlinked trips)
Commuter Rail
21Mixed Signals 2018
Vancouver
Commuter Rail
Mode Length Stations
Exclusive ROW Light & 79.6 km 53
Intermediate Rail
Regional Rail 69 km 8
Unlinked SkyTrain: 472,100
Trips Per Day Bus: 789,400
(APTA 2017) Ferry: 16,700
Commuter Rail: 9,300
Ridership (2017, APTA) 406,842,500 (unlinked trips)
22Mixed Signals 2018
Washington, D.C.
Commuter Rail (MARC & VRE)
Mode Length Stations
Heavy Rail (Subway, Metro) 189.7 km 94
Unlinked Trips Per Day Subway: 760,200
Semi-exclusive ROW Light Rail 3.9 km 9
(APTA 2017) Light Rail: 3,700
Regional Rail 446 km 61 Bus: 374,600
Commuter Rail: (est) 77,000
Construction Note: Silver Line 18.5 km northwest ParaTransit: (est) 8,000
expansion to Dulles airport,
scheduled to begin service in 2020. Ridership (2017, APTA) 346,342,000 (unlinked trips)
23Mixed Signals 2018
Line Names, Colours, Lengths, and Stations
Toronto (TTC) – 144 stns Boston (MBTA) – 128 Chicago (CTA) – 146 Houston METRORail – 39
Line 1 - 39.6 km Green - 36.4 km Blue - 44.5 km Red – 12.0 km
Line 2 - 27.5 km Red – 33.0 km Red - 35.5 km Purple - 10.6 km
Line 3 - 6.4 km Orange – 18.0 km Green - 32.5 km Green - 5.3 km
Line 4 - 5.5 km Blue - 9.5 km Orange - 20.0 km
Brown - 18.2 km
The station count beside each Pink - 17.0 km
city’s name includes all
exclusive and semi-exclusive Yellow - 8.0 km
right-of-way (ROW) stations
and stops, but excludes purely Purple - 6.4 km
mixed-traffic stops.
Los Angeles Metro – 104 Montreal (STM) – 68 Vancouver (Translink) – 53 Washington, D.C. – 103
Gold - 50.1 km Orange – 30.0 km Expo – 35.0 km Red – 51.3 km
Blue - 35.5 km Green - 22.1 km Millennium - 25.3 km Blue - 48.8 km
Green - 31.3 km Blue - 9.7 km Canada - 19.5 km Silver - 47.6 km
Expo - 24.5 km Yellow - 4.3 km Orange - 42.5 km
Red - 23.6 km Green - 37.1 km
Purple – 8.0 km Yellow - 24.3 km
24Mixed Signals 2018
Urban Core Rail Network Growth
London
Boston
Chicago
Paris
New York City
Toronto
Montreal
Stations Built Per Ten-Year Period
Washington, D.C.
101 (Paris 1900-1910) Vancouver
41 (New York City 1930-1940) Los Angeles
1 (Toronto 1990-2000) Houston
1850 1860 1870 1880 1890 1900 1910 1920 1930 1940 1950 1960 1970 1980 1990 2000 2010 2020
25Mixed Signals 2018
Proportion of Urban Core Rail Underground
km
200
46% 22% 11% 27% 11% 77% 100% 0%
180
160
140
120
100
80
60
40
20
0
Washington, Los Angeles Chicago Boston Vancouver Toronto Montreal Houston
D.C.
Underground Aboveground
26Mixed Signals 2018
Public Transit Commuter Mode Share
Toronto CMA
(Mississauga-Brampton-Markham- 24.3%
Vaughan-Richmond Hill-Oakville-Ajax)
Montreal CMA
(Laval-Longueuil-Terrebonne- 22.3%
Saint-Jean-sur-Richelieu-Brossard-…
Vancouver CMA
(Surrey-Burnaby-Richmond-Coquitlam- 20.4%
Langley-Delta-North Vancouver)
Washington-Arlington-Alexandria 14.4%
Boston-Cambridge-Newton 13.6%
Chicago-Naperville-Elgin 12.0%
Los Angeles-Long Beach-Anaheim 5.1%
Houston-The Woodlands-Sugarland 2.2%
27Mixed Signals 2018
Average Weekday Ridership by Transit Mode
3
Millions
2.5
2
1.5
1
0.5
0
Toronto Montreal Chicago Los Angeles Vancouver Washington, Boston Houston
D.C.
Bus Rail in Shared / Semi-Exclusive ROW Rail in Exclusive ROW Commuter Rail
28Mixed Signals 2018
Ridership per Kilometre of Rail
Ratio of annual local system ridership to exclusive right-of-way rail lines
12
Millions
10
8
6
4
2
0
Toronto Montreal Los Angeles Vancouver Boston Chicago Houston Washington,
D.C.
29Mixed Signals 2018
Operating Budgets
There is no perfect or universal structure for public transit agency Commonalities Differences
funding. But there are lessons to be learned. Funding of public
transit is part of cities’ democratic practice, and the choices we
• The cost of labour for all • Toronto has the highest
make on who must pay for what level of service or access are not
transit agencies pushes back farebox recovery ratio, lowest
neutral or obvious. Public transit is a public service, not a profit
against improved service overall subsidy, lowest
centre, thus every city (without a large money-generating property • Advertising’s degradation to subsidy per rider, and lowest
portfolio) must subsidize its transit. The level of subsidy and the the brand far outweighs the overall revenue per rider
security of the funds determine service and expansion decisions. small revenue it provides among the cities studied
• Network expansion competes • Toronto has no predictable
Consensus is rarely possible in transit taxation decisions, but we revenue stream from a
and wins funding over
should aim to strengthen planning and decision-making by dedicated tax or levy
ongoing operational needs
dedicating transparent revenue streams to specific uses. ◼
Transit systems are complex and dynamic The TTC relies on the farebox more than any other higher per-rider revenue, with Los Angeles
systems, whose costs may fluctuate due to many city in North America. In all comparator cities, the topping out the list with $15.16 in revenue per
factors. Changes in fuel costs and the ups and annual operating subsidy covers more than 50% rider, despite its far lower mode share.
downs of ridership may affect the bottom line of the operating budget. In Boston and Houston, it
with little warning, leading to common mid-year is more than 70%, and in Los Angeles it is nearly Toronto’s biggest differentiator is the lack of a
service adjustments, just as in the private sector. 90%. Toronto’s operating subsidy is just 30%. designated revenue stream for transit. Almost
every other city has a dedicated tax providing
But transit’s largest expense is labour, and budget Even close to home, the difference is striking. The stable, predictable funding.
pressures here create a consistent annual per-rider subsidy for the TTC is dramatically
incentive to reduce service, which can improve smaller than what is provided to riders in In Montreal and Washington DC, participating
the bottom line but betray transit’s reason for municipalities in the surrounding GTHA. Markham regions/counties and cities contribute a subsidy
existence. pays $4.56 per rider, fully five times Toronto’s calculated in relation to their population. In other
$0.90. Suburban transit is normally far more cities with transit-dedicated taxes, these sources
Establishing and planning operations at an costly per-rider, but this contrast is key to GTHA contribute a significant share of the transit
appropriate level requires stable, predictable fare integration, especially amidst claims of cost agency’s revenue. In Houston, the sales tax
funding. Secure funding is also needed to maintain neutrality. contributes over 65% of Metro’s revenue. In Los
the system in a state-of-good-repair and to Angeles, voters have approved transit-dedicated
expand operations to improve service and The TTC’s operating budget is disproportionately sales taxes in multiple elections.
increase ridership. Long-term capital planning also small for its ridership. When compared with other
needs secure relationships with funding sources cities, Toronto has the least to spend, per rider. The status quo of low subsidy and unpredictable
and governments. Toronto lags well behind other Toronto has $2.10 per rider, less than half funding leaves Toronto’s riders at great risk.
North American cities in this regard. Vancouver’s level, even though the TTC carries
more than twice the riders. US cities have even
30Mixed Signals 2018
Toronto TTC (2017)
Funding (30.4% subsidy) Expenses
(All figures ‘000’s)
31Mixed Signals 2018
Boston MBTA (2017)
Funding (50.3% subsidy) Expenses
(All figures ‘000’s)
32Mixed Signals 2018
Chicago CTA (2017)
Funding (55.0% subsidy) Expenses
(All figures ‘000’s)
33Mixed Signals 2018
Houston Metro (2016)
Funding (75.9% subsidy) Expenses
(All figures ‘000’s)
34Mixed Signals 2018
Los Angeles Metro (2017)
Funding (79.2% subsidy of operations spending) Expenses (mixed capital & operations)
(All figures ‘000’s)
Los Angeles Metro’s annual budget combines capital and operations, making direct comparisons difficult.
35Mixed Signals 2018
Montreal STM (2016)
Funding (51.1% subsidy) Expenses
(All figures ‘000’s)
36Mixed Signals 2018
Vancouver Translink (2017)
Funding (60.2% subsidy) Expenses
(All figures ‘000’s)
37Mixed Signals 2018
Washington, D.C. WMATA (2018)
Funding (52.5% subsidy) Expenses
(All figures ‘000’s)
38Mixed Signals 2018
Farebox Recovery Ratio
Operating costs covered by passenger fares
Montreal (STM, 2016) 46.0%
Vancouver (Translink, 2017) 55.8%
Toronto (TTC, 2017) 69.6%
Washington, D.C. (WMATA, 2016) 41.5%
Chicago (CTA, 2016) 39.8%
TTC Operating Budget (2017)
Boston (MBTA, 2016) 33.3%
Other
Revenue
30.4%
Los Angeles (LACMTA, 2016) 20.8% Fares
69.6%
Houston (MTAHC, 2016) 12.9%
Farebox Recovery does not include capital costs
(new construction, vehicles, buildings, signals, etc.)
41 39Mixed Signals 2018
Annual Operating Subsidy Operating Budget per Trip
Total subsidy from all sources Per-unlinked-trip representation of
total budget from all sources
60.2% Vancouver Translink (2017) $4.78
51.1% Montreal STM (2016) $2.12 Example: TTC (2017), rounded figures
$1.8b 857m $2.10
budget trips per trip
30.4% Toronto TTC (2017) $2.10
55.0% Chicago CTA (2017) $3.18
52.5% Washington D.C. Metro (2018) $5.38
50.3% Boston MBTA (2017) $6.81
79.2% Los Angeles Metro (2017) $8.84
75.9% Houston Metro (2016) $11.77
40Mixed Signals 2018
Subsidy per Transit Rider
Per-rider representation of the total subsidy from all sources
$4.75
$4.56
USA (2016, US$) TTC (2017$) Canada (2015$) GTHA (2015$)
$4.12
Example: TTC (2017), rounded figures $3.74
$3.37 $495,000,000 553,000,000 $0.90 subsidy
total subsidies rides per ride
$3.08
$2.73
$2.37 $2.29 $2.30
$1.96 $1.90
$1.86 $1.90
$1.75 $1.69
$1.16
$0.90
41Mixed Signals 2018
Dedicated Revenue Sources and
Recent Recommendations
Land
Sales Gas and Parking Dev Paid Vehicle
Dedicated revenue sources: Tolls Transfer
Tax Fuel Taxes Tax Charges Parking Tax
Tax
Toronto ◼ ◼
Boston ◼ ◼
Chicago ◼ ◼ ◼
Houston ◼ ◼
Los Angeles ◼ ◼
Montreal ◼
Vancouver ◼ ◼ ◼
Washington, D.C. ◼ ◼
Recommended by:
Metrolinx Investment Strategy (2013) ◼ ◼ ◼ ◼ ◼ + Land Value Capture
Toronto Region Board of Trade (2013) ◼ ◼ ◼ ◼
Transit Investment Strategy Advisory Panel (2014) ◼ ◼ + Corporate Income Tax
City of Toronto Staff Report (2012) ◼ ◼ ◼ ◼ ◼ + Vehicle Registration Tax
Canadian Centre for Policy Alternatives (2013) ◼ ◼ ◼ ◼
Ontario Chamber of Commerce (2013) ◼ ◼ ◼ ◼ ◼
◼ Dedicated ◼ Partial None 42Mixed Signals 2018
Governance
There is no perfect or universal structure for regional Commonalities Differences
transportation governance. But there are lessons to be learned.
Governance of public infrastructure is part of cities’ democratic
• No rider or Wheel-Trans rider • Metrolinx board has no
practice, and as we design our structures, we should be thinking
representation on the Board elected representatives at all,
about how to spend effectively, be transparent in decision-making, • Regional population skews nor any who are accountable
represent the diversity of stakeholders affected, and create space provincial government focus to the City of Toronto.
for long-term planning supported by sustainable funding. These are and funding toward regional • PRESTO fare card controlled
all essential characteristics of a strong governance model. commuters not in City of only by Province of Ontario
Toronto property tax base • TTC Board public control only
It is not possible to avoid politicizing transit decisions, but we
• No city has privatized local or indirect, and diversity
should aim to strengthen decision-making processes to favour
regional transit agencies unlegislated
evidence and expertise for collective public benefit, not partisan
electoral politics. ◼
Our report found that Toronto’s governance does not requiring legislative confirmation, and its members with expertise and experience related
structure differs from other North American cities membership cannot include any elected to transit and transportation. Only one city
in key ways: representatives (since 2009 reorganization). No includes both rider and ParaTransit representation
other comparator city has a board fully by law.
Toronto’s principal transportation provider, the appointed by the government with no open
TTC, has limited oversight of transportation within screening or approval process. More Appointments of elected representatives are
the city. It has no control of the road network it significantly, the City of Toronto has no included as one way of representing the different
uses, nor oversight of other forms of representation on the Metrolinx Board geographic stakeholders in a region. In the US,
transportation. It thus has limited opportunity for whatsoever. appointments are often subject to counter-
prioritizing transit within roadspace or for the checking, where the city’s choices must be
coordination of transit with cycling and pedestrian The TTC’s Board of Commissioners is also approved by the state, and vice versa. In only one
infrastructure. somewhat unusual for having City Councillors as a city, Boston, does the province or state have
strong majority of its members (one as Chair), and majority control over the network.
The TTC is currently phasing out the use of its own a limited role for civilian members. Civilian
tickets, tokens, and passes, with completion members are required to hold “executive-level” Both Boards overseeing transit in Toronto are
expected by mid-2019, and provincial agency and “management” experience, but not significantly politicized and vulnerable to partisan
Metrolinx’s PRESTO fare card will become the sole necessarily any transit knowledge or experience. interference, to a degree not seen in other cities.
non-cash fare media option. No other comparator Council approves the membership of the Board, When combined with inadequate and insecure
city has a fare card fully controlled by another but its Councillor members are chosen by the funding, the vulnerability of the TTC is particularly
level of government with no local oversight. mayor. acute.
The Metrolinx Board of Directors is appointed by Other comparator city Boards seek some
the Premier through an Order-in-Council, which representation of diverse stakeholders and/or
43Mixed Signals 2018
Toronto
Jurisdictions
Greater Toronto & City of Toronto Province of Ontario
Hamilton Area (GTHA)
Population Density
Toronto Transit
Boards
Toronto Parking Commission Metrolinx
Authority Board 7 Elected City 14 unelected
2 Elected City Council members, citizen members
Council members, 4 citizen members appointed by
5 citizen members appointed by City provincial cabinet
Council
Wheel-
Modes
Trans, Future
Parking GO Transit, PRESTO
Bus, LRT
Bike Share UP Express fare card
Streetcar,
Greater Toronto Area’s Subway
25 cities & towns
(5 additional in GTHA)
Colour indicates majority control of transportation mode
44Mixed Signals 2018
Boston
Jurisdictions
City of Boston Commonwealth of Massachusetts
MBTA
MBTA
MassDOT Fiscal and
Advisory
Board of Mgmt
Directors Board
Control
Massachusetts 175 members
11 citizen Board
Population Density appointed by
members 5 members
Boards
chief elected
appointed by appointed
Governor of official of each
by
MA city and town
Governor
in the district
of MA
Massachusetts Bay Transportation Authority
Greater Boston’s
175 cities & towns
Modes
Parking,
ParaTransit,
Bike CharlieCard
Bus, Ferry,
Share Fare Card
Subway,
Commuter Rail
Colour indicates majority control of transportation mode
45Mixed Signals 2018
Chicago
Cook “Collar
Jurisdictions
Cook
Governor of Mayor of County Counties”
County
Illinois Chicago Board Board
Board
President Chairs
Regional Transportation Authority Board
16 members total, 5 appointed by the Mayor of Chicago, 4 by the Cook County
Board, 1 by the Cook County Board President, 5 by the “Collar Counties” Board
Illinois Chairs (1 each), and 1 elected by a super-majority of Board members
Pace Board of
Boards
Metra Board of
Directors
Directors
13 members total,
Chicago Transit 11 members total,
12 appointed by Collar
Authority 1 appointed by Mayor
Counties Board Chairs
Board of Directors of Chicago, 4 by the
and the Suburban
7 members total, Cook County Board, 1
members of the Cook
4 appointed by Mayor by the Cook County
County Board (1
City of Chicago of Chicago, and 3 by Board President, and
each), and 1 by the
Population Density the Governor of 5 by the Collar
Mayor of Chicago.
Illinois Counties Board Chairs
Chair appointed by
(1 each)
majority vote of all
Modes
except the Mayor
Greater Chicago’s
126 cities & towns Parking, Bus, Elevated
ParaTransit, Suburban
Divvy Bike Share Trains, Ventra Fare Commuter Rail
Bus, Vanpool
Card
Colour indicates majority control of transportation mode
46Mixed Signals 2018
Houston
Jurisdictions
Harris County 14 Multi-Cities
City of
Commissioners in METRO’s
Houston
Harris County Court Service Area
Population Density
Boards
Metropolitan Transit Authority of
Harris County
9 members total, 5 appointed by City of Houston, 2 by Harris
County Commissioners Court, and 2 by the 14 Multi-Cities in
METRO Service Area
Harris County’s 23 cities & towns
Modes
Parking, ParaTransit, Bus,
Light Rail, Q Fare Card
Texas
Colour indicates majority control of transportation mode
47Mixed Signals 2018
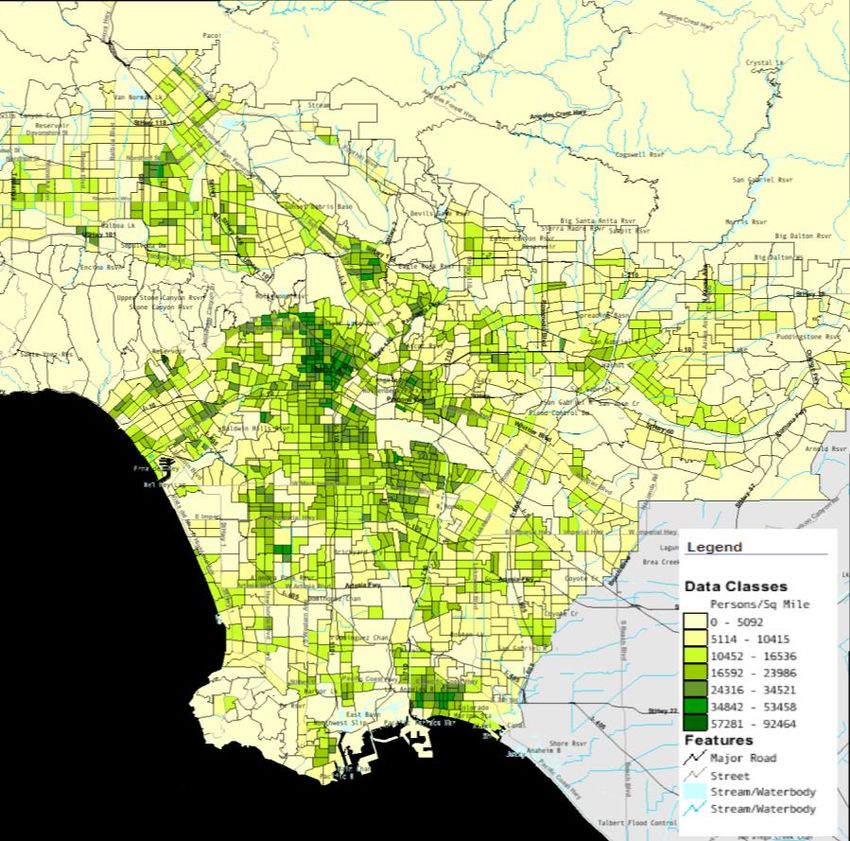
Los Angeles
Jurisdictions
San Bernardino County
Governor of California
Mayor of Los Angeles
Riverside County
Ventura County
Orange County
Los Angeles
County’s Los Angeles
87 Member County
Cities
Los Angeles County’s
127 cities & towns
Los Angeles County Metropolitan
Southern California Regional Rail
Boards
Transportation Authority Board
Authority Board
14 members total, 5 LA County
11 members total, 4 appointed by
Supervisors, the Mayor of LA and 3
Southern California Regional Rail
appointees, and 4 council members of
Authority, 2 by Orange County, 2 by
LA County member cities other than LA
Riverside County, 2 by San Bernadino
itself, and the 14th non-voting member
County, and 1 by Ventura County
by the Governor of California
Bike Share, Bike Paths,
Modes
Carpool Lanes, Freeway Car
Commuter Rail
Service, Parking, Bus, Light
Rail, Subway, TAP Fare Card
Los Angeles County
Colour indicates majority control of transportation mode
Population Density 48Mixed Signals 2018
Montreal
Island of Montreal’s
Jurisdictions
Communauté métropolitaine
Agglomération de Longueuil
15 Municipalities
Ville de Laval
de Montréal
North Shore
South Shore
Montréal Agglomeration Council
Greater Montreal
Boards
Population Density
Réseau de transport métropolitain
Société de transport de
Board of Directors
Montréal Board of Directors
15 members total, 4 appointed by
7-10 members appointed by the
Greater Montreal’s council (including
City of Montréal from its council
one rider and one ParaTransit
and the councils of the urban
representative), 2 by the Island of
agglomeration (up to 7
Montreal regional council, 1 by
members), 1 ParaTransit
Longueuil council, 1 by Laval council,
representative, and 2 rider
and the 8 mayors of cities on the
representatives, 1 of whom must
North (4)
Modes
be under age 35.
and South (4) shores
Taxibus, ParaTransit, Parking,
Bus, Subway, Commuter Rail
OPUS Fare Card
Colour indicates majority control of transportation mode
49Mixed Signals 2018
Vancouver
Jurisdictions
Greater Vancouver Gateway Council
BC Minister of Transportation
Chartered Accountants of BC
Vancouver Board of Trade
City of Vancouver
Mayors’ Council
21 mayors of
Metro Vancouver municipalities
and the Chief of Tsawwassen
First Nation
Boards
Screening Panel
5 members appointed by the five organizations above
Greater Vancouver’s
21 Municipalities,
South Coast British Columbia Transportation Authority
Electoral Area, and (“Translink”) Board of Directors
the Tsawwassen First
Nation (above), and 11 members appointed by the Mayors’ Council from
shortlist prepared by the Screening Panel
Population Density
Modes
(left)
Parking, ParaTransit, Ferry, Bus, SkyTrain,
Bike Share
Commuter Rail, Compass Fare Card
Colour indicates majority control of transportation mode
50Mixed Signals 2018
Washington, D.C.
Jurisdictions
Northern Virginia Transportation
Washington Suburban Transit
United States Secretary of
Montgomery County MD
Commission (Maryland)
Commission (Virginia)
Arlington County VA
Fairfax County VA
Transportation
Alexandria VA
Council of the
District of
Columbia
Population Density in the District of Columbia and its
Boards
neighbor states of Delaware, Maryland, and Virginia
Washington Metropolitan Area Transit Authority
Board of Directors
16 members (8 voting, 8 alternate) total, with
Capital
4 appointed by Council of the District of Columbia,
Bikeshare
4 by Northern Virginia Transportation Commission,
4 by Washington Suburban Transit Commission, and
4 by United States Secretary of Transportation
Modes
Bike Share Parking, ParaTransit, Bus, Subway, SmarTrip Fare Card
Colour indicates majority control of transportation mode
51Mixed Signals 2018
Local Agency Boards of Directors
Membership & Control
Percentage of
Local Agency Board Members Representing… Privatized Rider ParaTransit Unelected
Local Agency
Region Province Federal Agency at representative representative Board members
Board from City
/County /State Govt. any level? on the Board? on the Board? paid?
Local Core City
Toronto 100% ◼ ◼
Boston 0% ◼
Chicago 31% ◼ ◼ ◼ ◼
Houston 56% ◼ ◼
Los Angeles 31% ◼ ◼ ◼
Montreal 100% ◼ ◼ ◼ ◼ ◼
Vancouver 5% ◼ ◼
Washington,
25% ◼ ◼ ◼ ◼ ◼
D.C.
52Mixed Signals 2018
Boards of Directors and Equity
Gender Black, Indigenous, & People of Colour
Toronto Metrolinx 7 7 3 4 Chicago CTA
Montreal STM 5 5 7 2 Houston Metro
Increased
Balance
Vancouver Translink 6 5 10 5 Washington, D.C. WMATA
Houston Metro 5 4 10 4 Los Angeles Metro
Women
BIPOC
White
Los Angeles Metro 8 6 9 2 Toronto TTC
Men
Montreal RTM 9 6 11 3 Toronto Metrolinx
Chicago CTA 6 1 10 1 Boston MBTA
Boston MBTA 8 3 10 0 Montreal STM
Toronto TTC 9 2 11 0 Vancouver Translink
Washington, D.C. WMATA 13 2 17 0 Montreal RTM
53Mixed Signals 2018
Fares
Download this report with clickable links at www.CodeRedTO.com
City/Region Source(s)
Toronto TTC www.TTC.ca GO Transit www.gotransit.com
Provincial Inflation http://inflationcalculator.ca/ontario/
Fare History https://transit.toronto.on.ca/spare/0021.shtml
Boston MBTA www.MBTA.com
Local Inflation https://www.bls.gov/regions/new-england/data/consumerpriceindex_boston_table.htm
Fare History http://beta.metrobostondatacommon.org/site_media/uploads/DataDay2012_Pollack-The_State_of_MBTA_Finances.pdf
Chicago CTA www.transitChicago.com Metra www.metrarail.com
Local Inflation https://www.bls.gov/regions/midwest/data/consumerpriceindexhistorical_chicago_table.pdf
Fare History https://www.chicagorailfan.com/fares.html
Houston Metro www.rideMetro.org
Local Inflation https://www.bls.gov/regions/southwest/data/consumerpriceindexhistorical_houston1967_table.pdf
Fare History https://www.capmetro.org/uploadedFiles/Capmetroorg/Plans_and_Progress/Fare_Change/farestudy%20final%20draft.pdf
Los Angeles Metro www.metro.net Metrolink www.metrolinktrains.com
Local Inflation https://www.bls.gov/regions/west/data/consumerpriceindex_losangeles_table.pdf
Fare History https://socata.net/newsletter/transit-avocate-1992-1999/ http://humantransit.org/2010/03/los-angeles-times-columnist-slams-transfer-
penalties.html https://www.metro.net/news/simple_pr/metro-fare-changes-be-implemented-september-15-off/
Montreal STM www.stm.info Exo (formerly AMT/RTM) https://rtm.quebec
Provincial Inflation http://inflationcalculator.ca/quebec/
Fare History http://www.stm.info/en/about/financial_and_corporate_information/budget-and-reports/budgets-stm
Vancouver Translink www.translink.ca
Provincial Inflation http://inflationcalculator.ca/british-columbia/
Fare History https://www.translink.ca/-/media/Documents/rider_guide/Buzzer%20Vault/1990s/1997/Buzzer_1997_09_19.pdf
http://www.cbc.ca/bc/news/bc-080723-Fare-Evasion-pwc.pdf https://www.huffingtonpost.ca/2012/11/13/translink-fare-increase_n_2126829.html
http://dailyhive.com/vancouver/translink-fares-increase-july-1-2018 https://www.cbc.ca/news/canada/british-columbia/transit-fares-hit-5-in-metro-
vancouver-1.726003 https://www.policyalternatives.ca/sites/default/files/uploads/publications/BC_Office_Pubs/bc_2007/bc_transit_btn.pdf
Washington, WMATA www.wmata.com MARC https://mta.maryland.gov/marc-train VRE https://www.vre.org/
D.C. Local Inflation https://www.bls.gov/regions/mid-atlantic/dc_washington_md.htm
Fare History https://www.wmata.com/about/records/public_docs/upload/History-of-Fare-Increases-FY2015.pdf
Canada Inflation Calculator: https://www.bankofcanada.ca/rates/related/inflation-calculator/
US Inflation Calculator: https://www.usinflationcalculator.com/
Farebox Recovery Ratio: https://en.wikipedia.org/wiki/Farebox_recovery_ratio
https://cms.fta.dot.gov/sites/fta.dot.gov/files/docs/ntd/66026/top-50-summary-and-complete-profile-set_1.pdf
54Mixed Signals 2018
Networks
Download this report with clickable links at www.CodeRedTO.com
City/Region Source(s)
Toronto TTC www.TTC.ca GO Transit www.gotransit.com
Maps: Streetcar/Subway https://www.ttc.ca/Routes/General_Information/Maps/index.jsp GO Transit https://www.gotransit.com/en/trip-planning/system-
and-route-map
Operating Statistics https://www.ttc.ca/About_the_TTC/Operating_Statistics/2016/section_one.jsp
Corporate Plan 2018-2022
http://ttc.ca/About_the_TTC/Commission_reports_and_information/Commission_meetings/2018/January_25/Reports/1_Corporate_Plan_2018-2022.pdf
Boston MBTA www.MBTA.com
Maps: Subway https://www.mbta.com/schedules/subway Rail https://www.mbta.com/schedules/commuter-rail
Expansion https://www.boston.com/news/local-news/2017/12/20/mbta-changes
Chicago CTA www.transitChicago.com Metra www.metrarail.com
Maps: L Metra
Houston Metro www.rideMetro.org
Map: https://www.ridemetro.org/Pages/SchedulesBusRail.aspx
Los Angeles Metro www.metro.net Metrolink www.metrolinktrains.com
Map: https://www.metro.net/riding/maps/
Expansion https://www.metro.net/projects/crenshaw_corridor/
Montreal STM www.stm.info Exo (formerly AMT/RTM) https://rtm.quebec
Maps: STM exo
Vancouver Translink www.translink.ca
Maps: SkyTrain https://www.translink.ca/Schedules-and-Maps/Transit-System-Maps.aspx West Coast Express https://www.translink.ca/Schedules-and-
Maps/West-Coast-Express/WCE-Station-Maps.aspx
Washington, WMATA www.wmata.com MARC https://mta.maryland.gov/marc-train VRE https://www.vre.org/
D.C. MetroAccess https://www.wmata.com/service/accessibility/metro-access/
Additional network details: UrbanRail.net
Ridership: American Public Transportation Association Q4 2017 Ridership Report
Mode Share: Streetsblog, Statistics Canada
55Mixed Signals 2018
Budgets
Download this report with clickable links at www.CodeRedTO.com
City/Region Source(s)
Toronto TTC www.ttc.ca
2017-2018 TTC & Wheel-Trans Operating Budgets
https://www.ttc.ca/About_the_TTC/Commission_reports_and_information/Committee_meetings/Budget/2017/November_17/Reports/1_2018_TTC_and_
Wheel-Trans_Operating_Budgets.pdf https://www.toronto.ca/legdocs/mmis/2017/ex/bgrd/backgroundfile-100738.pdf
Boston MBTA www.mbta.com
2017 Fiscal Year Audited Financial Statements https://d3044s2alrsxog.cloudfront.net/sites/default/files/2017-12/fy17-audited-financial-statements.pdf
Chicago CTA www.transitchicago.com
2017 Fiscal Year Budget Book http://www.transitchicago.com/assets/1/finance_budget/FY17_Budget_Book_FINAL.pdf
Houston Metro www.ridemetro.org
Comprehensive Annual Financial Report 2016 https://www.ridemetro.org/MetroPDFs/FinancialAuditInformation/2017/FY2016-CAFR.pdf
Los Angeles Metro www.metro.net
2018 Fiscal Year Proposed Budget https://media.metro.net/about_us/finance/images/fy18_proposed_budget_2017-05.pdf
Montreal STM http://stm.info
2016 Annual Report http://www.stm.info/sites/default/files/affairespubliques/Communiques/stm_rapport_annuel_2016_final.pdf
Vancouver Translink www.translink.ca
2017 Business Plan and Operating and Capital Budget https://www.translink.ca/-
/media/Documents/about_translink/corporate_overview/corporate_reports/business_plan/2017_business_plan_and_operating_and_capital_budget.pdf
Washington, WMATA www.wmata.com
D.C. 2018 Approved Budget https://www.wmata.com/about/records/public_docs/upload/Approved-Budget-Final_v1.pdf
Sankey Flow Diagrams: www.sankeymatic.com
Subsidy per Rider: 2017 TTC and Wheel-Trans Operating Budgets, Watchdog.org
Revenue Sources: file:///C:/Users/cameron.macleod/Downloads/Dedicated%20Revenue%20Sources%20for%20Major%20Transit%20Agencies.pdf
Revenue Recommendations: https://www.toronto.ca/legdocs/mmis/2014/ex/bgrd/backgroundfile-67455.pdf
http://www.occ.ca/Publications/The-2Billion-Question_online.pdf
https://www.policyalternatives.ca/sites/default/files/uploads/publications/Ontario%20Office/2013/05/Torontos_2andHalf_Billion_Dollar_Question.pdf
http://www.metrolinx.com/en/regionalplanning/funding/investment_strategy.aspx
56Mixed Signals 2018
Governance
Download this report with clickable links at www.CodeRedTO.com
City/Region Source(s)
Toronto TTC Board https://www.ttc.ca/About_the_TTC/Commission_reports_and_information/index.jsp Map Attributions
Metrolinx http://www.metrolinx.com/en/aboutus/board/board_of_directors_bios.aspx
Ontario Ministry of Transportation https://www.ontario.ca/page/ministry-transportation Canadian density maps
Region https://commons.wikimedia.org/wiki/File:Greater_toronto_area_map.svg – © CensusMapper, Data provided by Statistics Canada
Density https://censusmapper.ca/maps/591#10/43.5789/-79.4888
Density Maps for California, Delaware, Maryland,
Massachusetts, Texas, Virginia, and West Virginia
Boston MBTA Fiscal and Management Control Board (FMCB) https://www.mbta.com/leadership/fmcb – © JimIrwin / CC-BY-SA-3.0 / GFDL
MBTA Advisory Board http://www.mbtaadvisoryboard.org
Massachussetts Department of Transportation (MassDOT) Density Maps for Houston TX and Los Angeles County CA
https://www.mass.gov/orgs/massachusetts-department-of-transportation – Public Domain / Government Agency Publication
Region http://www.mbtaadvisoryboard.org/about-us/
Density https://en.wikipedia.org/wiki/Demographics_of_Massachusetts Density Map for Chicago
– © David B. Gleason / CC-BY-SA-2.0
Chicago Chicago Transit Board https://www.transitchicago.com/board/ Region Maps for Greater Boston Area, Harris County TX,
Metra Rail Board of Directors https://metrarail.com/about-metra/leadership Los Angeles County CA, Montreal, and Texas
Region https://en.wikipedia.org/wiki/Cook_County,_Illinois – Public Domain
Density https://www.flickr.com/photos/mindfrieze/4037618743
https://en.wikipedia.org/wiki/Chicago Region Map for Greater Toronto Area
– © mortadelo2005 / CC-BY-SA-3.0 / GFDL
Houston Metro Board https://www.ridemetro.org/Pages/BoardOfDirectors.aspx Region Map for Cook and DuPage Counties IL
Region https://commons.wikimedia.org/wiki/File:Map_of_Texas_highlighting_Harris_County.svg – © DemocraticLuntz at English Wikipedia
https://www.houstontx.gov/controller/investorrelations/2017invconf/metro.pdf
Density https://en.wikipedia.org/wiki/Demographics_of_Texas Region Map for Los Angeles neighbourhood groupings
https://commons.wikimedia.org/wiki/File:Houstonpopulationdensity.PNG – © Peter Fitzgerald / CC-BY-SA-2.0
Los Angeles Metro Board https://www.metro.net/about/board/ Region Map for Vancouver
Metrolink Board https://www.metrolinktrains.com/about/agency/board-of-directors/ – © TastyCakes on English Wikipedia
Region https://commons.wikimedia.org/wiki/File:LA_districts_map.svg Region Map for Washington, D.C.
Density https://commons.wikimedia.org/wiki/File:LACountyPopDensity.png – © Patrickneil / CC-BY-SA-3.0 / GFDL
Montreal Société de transport de Montréal Board of Directors (English link) http://www.stm.info/en/about/corporate-governance/board-directors
Exo Governance (French link) https://rtm.quebec/fr/a-propos/gouvernance
Region https://fr.wikipedia.org/wiki/Montr%C3%A9al Density https://censusmapper.ca/maps/591#11/45.5470/-73.6019
Vancouver Translink Governance https://www.translink.ca/About-Us/Governance-and-Board.aspx
Region https://en.wikipedia.org/wiki/Vancouver Density https://censusmapper.ca/maps/591#11/49.2756/-123.1155
Washington, WMATA Board of Directors https://www.wmata.com/about/board/ MARC https://mta.maryland.gov/about-mta VRE https://www.vre.org/about/board/
D.C. Region https://commons.wikimedia.org/wiki/File:Washington,_D.C._locator_map.svg
Density https://commons.wikimedia.org/wiki/File:Virginia_population_map.png https://commons.wikimedia.org/wiki/File:Maryland_population_map.png
https://commons.wikimedia.org/wiki/File:West_Virginia_population_map.png https://commons.wikimedia.org/wiki/File:Delaware_population_map.png
57You can also read