An Investigation on the Sampling Frequency of the Upper-Limb Force Myographic Signals - MDPI

Page created by Ernest Morales
 
CONTINUE READING
An Investigation on the Sampling Frequency of the Upper-Limb Force Myographic Signals - MDPI
sensors
Article
An Investigation on the Sampling Frequency of the
Upper-Limb Force Myographic Signals
Zhen Gang Xiao          and Carlo Menon *
 Schools of Mechatronics Systems Engineering and Engineering Science, Simon Fraser University,
 250-13450 102 Avenue, Surrey, BC V3T 0A3, Canada; zgx@sfu.ca
 * Correspondence: cmenon@sfu.ca
                                                                                                   
 Received: 25 April 2019; Accepted: 23 May 2019; Published: 28 May 2019                            

 Abstract: Force myography (FMG) is an emerging method to register muscle activity of a limb
 using force sensors for human–machine interface and movement monitoring applications. Despite
 its newly gained popularity among researchers, many of its fundamental characteristics remain to
 be investigated. The aim of this study is to identify the minimum sampling frequency needed for
 recording upper-limb FMG signals without sacrificing signal integrity. Twelve healthy volunteers
 participated in an experiment in which they were instructed to perform rapid hand actions with FMG
 signals being recorded from the wrist and the bulk region of the forearm. The FMG signals were
 sampled at 1 kHz with a 16-bit resolution data acquisition device. We downsampled the signals with
 frequencies ranging from 1 Hz to 500 Hz to examine the discrepancies between the original signals
 and the downsampled ones. Based on the results, we suggest that FMG signals from the forearm and
 wrist should be collected with minimum sampling frequencies of 54 Hz and 58 Hz for deciphering
 isometric actions, and 70 Hz and 84 Hz for deciphering dynamic actions. This fundamental work
 provides insight into minimum requirements for sampling FMG signals such that the data content of
 such signals is not compromised.

 Keywords: force myography; FMG; muscle; wearable; motions; human–computer interface;
 signal sampling

1. Introduction
      Force myography (FMG) is an emerging technique to register muscle activity of a limb [1].
This technique utilizes multiple force sensors to detect the pressure variation on the surface of the limb
during movements [2]. Such variations can be correlated to muscle contraction levels and, therefore,
can be used to estimate different limb movements for physical activity monitoring or human–machine
interface applications [1]. For example, FMG signals from near the wrist or around the proximal
forearm have been used to detect the number of grasping actions during a pick-and-place exercise [3]
and to control an external robotic device such as a hand prosthesis [4]. Compared to other methods
which also can decipher limb action from muscles (e.g., surface electromyography), FMG has better
signal stability against environmental factors such as the change in skin humidity, change in skin
temperature, and power line interference [5]. Also, its signal is less expensive to extract as it requires
less complicated hardware for signal conditioning [5].
      The term “FMG” first appeared in a publication by Wininger et al. in 2008 [2], but the idea of
using force transducers to detect muscle movements dates back to as early as the 1960s [6]. The same
technique was also referred to as “residual kinetic imaging” or “muscle pressure distribution mapping”
by different researchers [7,8]. To avoid confusion, the term “FMG” is used throughout this paper to
represent all techniques which involve the use of force sensors to detect pressure variations of a limb.
Despite the newly-gained popularity of FMG among academic researchers, there is still a lack of study

Sensors 2019, 19, 2432; doi:10.3390/s19112432                                  www.mdpi.com/journal/sensors
An Investigation on the Sampling Frequency of the Upper-Limb Force Myographic Signals - MDPI
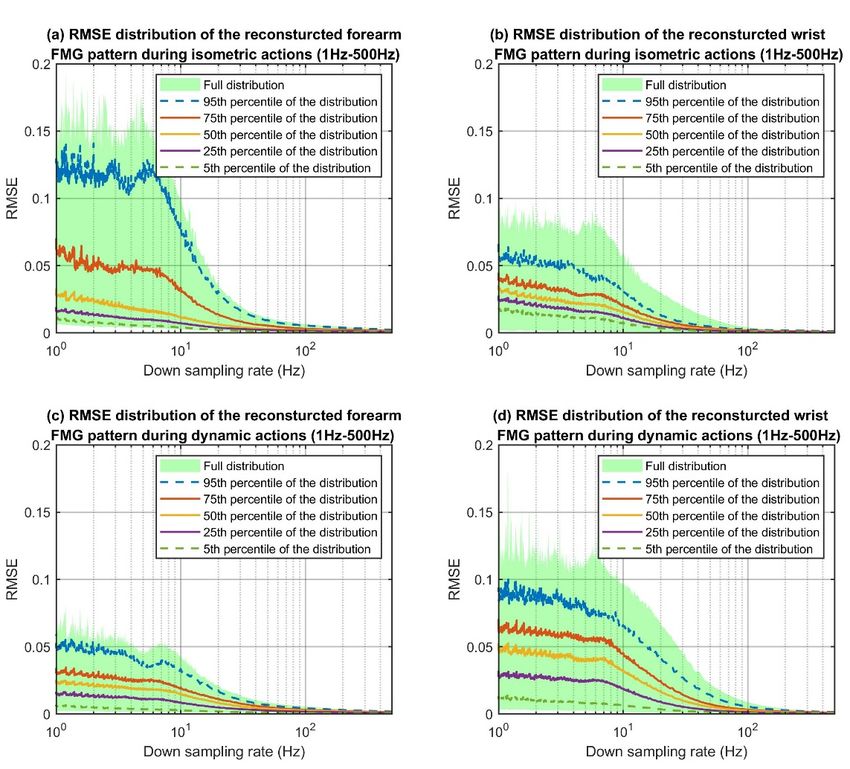
Sensors 2019, 19, 2432                                                                              2 of 18

on its fundamental characteristics. One commonly-asked question about the FMG technique is how
fast the FMG signal should be sampled. FMG researchers have used different sampling frequencies
in their publications. The FMG sampling frequencies reported in the literature from 2006 to 2018 are
listed in Table 1.

                            Table 1. FMG sampling frequency reported in the literature.

                         Action Type Involved    Sampling Frequency (Hz)        Reference
                                Static                      1000                  [9,10]
                                                             100                   [8]
                                                             30                    [11]
                                                             50                    [12]
                                                             25                    [13]
                                                             20                  [14,15]
                                                             15                    [16]
                                                             10                 [4,17–21]
                              Isometric                      50                   [5,22]
                                                             15                    [23]
                                                             10                    [24]
                              Dynamic                        196                 [25,26]
                                                             100                 [27–32]
                                                             30                    [33]
                                                             20                  [34,35]
                                                             15                    [36]
An Investigation on the Sampling Frequency of the Upper-Limb Force Myographic Signals - MDPI
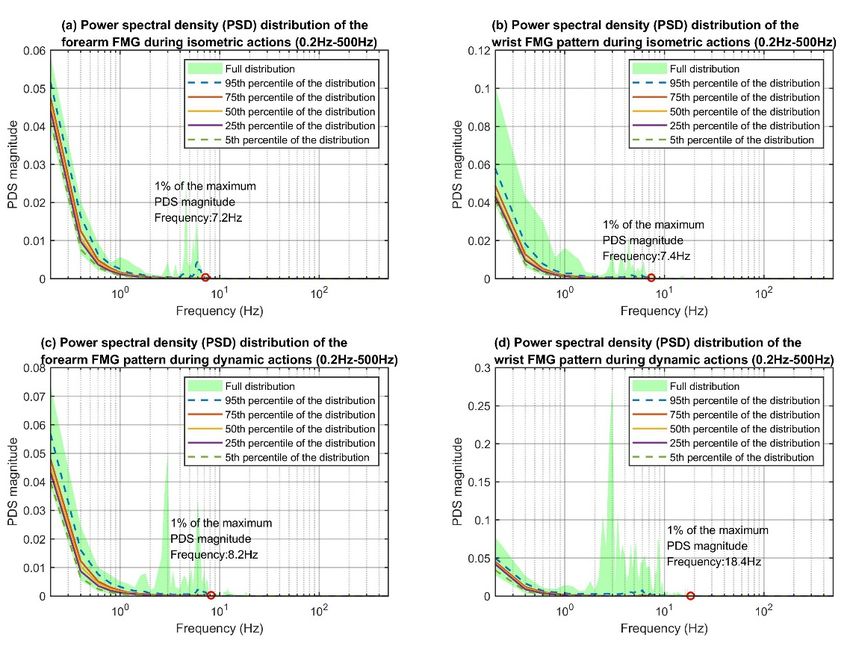
Sensors 2019, 19, 2432                                                                                       3 of 18

Sensors
On the2019, 19, xhand,
        other     FOR PEER REVIEW condition
                       a dynamic            describes a scenario in which the force applied to a 3target
                                                                                                    of 18

results in a displacement. Every displacement of the limb is a result of dynamic actions. For such
dynamic actions. For such an action, not only do the FMG signals relate to the change of muscle
an action, not only do the FMG signals relate to the change of muscle contraction level, but they are
contraction level, but they are also subjected to motion artifacts. To capture all the information
also subjected to motion artifacts. To capture all the information needed, FMG signals may need to
needed, FMG signals may need to be sampled at an even higher frequency. In addition to different
be sampled at an even higher frequency. In addition to different types of actions, the location of the
types of actions, the location of the FMG sensors (i.e., FMG extracted from the distal end of the
FMG sensors (i.e., FMG extracted from the distal end of the forearm versus the proximal end) may also
forearm versus the proximal end) may also contribute to different sampling frequency requirements.
contribute to different sampling frequency requirements.
     To find out the suitable sampling frequency for FMG applications, we conducted an experiment
     To find out the suitable sampling frequency for FMG applications, we conducted an experiment
to examine FMG signals during different rapid movements in both isometric and dynamic scenarios.
The aim of this study is to identify the minimum sampling frequency needed for recording upper-
The aim of this study is to identify the minimum sampling frequency needed for recording upper-limb
limb FMG signals without sacrificing signal integrity. Such results provide guidelines on how to
FMG signals without sacrificing signal integrity. Such results provide guidelines on how to sample
sample FMG signals for various human–machine interfaces and activity monitoring applications.
FMG signals for various human–machine interfaces and activity monitoring applications.

2.
2. Method
   Method
     An
     An experiment
          experiment waswas designed
                              designed to
                                        to collect
                                           collect high-quality
                                                    high-quality FMG
                                                                  FMG data
                                                                         data from
                                                                              from healthy
                                                                                     healthy participants
                                                                                             participants during
                                                                                                             during
rapid
rapid upper limb actions in order to identify the minimum sampling frequencies that are
      upper   limb   actions  in order to identify  the minimum     sampling   frequencies  that  are appropriate
                                                                                                       appropriate
for human–machine interfaces
for human–machine         interfaces and   activity monitoring
                                      and activity    monitoring applications.
                                                                  applications. The
                                                                                  The obtained
                                                                                        obtained data
                                                                                                  data would
                                                                                                         would be be
downsampled       with  different  frequencies   to  investigate the  discrepancy    between  the
downsampled with different frequencies to investigate the discrepancy between the original signal  original   signal
patterns
patterns and    the downsampled
          and the    downsampled ones.ones. Also,
                                             Also, the
                                                    the power
                                                        power density
                                                                density of
                                                                         of the
                                                                            the FMG
                                                                                FMG signal
                                                                                       signal patterns
                                                                                              patterns would
                                                                                                         would be be
studied  to gain  insight   into the signal characteristics   needed  to identify  the minimum
studied to gain insight into the signal characteristics needed to identify the minimum frequencies.frequencies.
     The
     The Office
           Office of
                   of Research
                      Research Ethics
                                 Ethics at
                                        at Simon
                                           Simon Fraser
                                                    Fraser University
                                                           University approved
                                                                        approved thethe protocol
                                                                                        protocol of
                                                                                                  of this
                                                                                                      thisresearch.
                                                                                                           research.
Twelve   volunteers gave
Twelve volunteers      gave informed
                              informed consent
                                         consent to    participate in
                                                   to participate  in the
                                                                       the study
                                                                           study (6   males and
                                                                                  (6 males  and 66 females
                                                                                                    females aged
                                                                                                               aged
from
from 21 to 41 years old). The experimental setup, the protocol, and the data analysis procedures are
      21 to  41  years  old). The  experimental    setup, the  protocol, and  the data   analysis procedures     are
presented
presented inin the
               the following
                    following subsections.
                                subsections.

2.1. Experimental
     Experimental Setup
                  Setup
     The schematic of the experimental setup is shown in FigureFigure 1.1. The setup includes two FMG
straps, a three-axis analog accelerometer,
          three-axis analog accelerometer,aavoltage
                                             voltagedivider
                                                     dividercircuit,
                                                             circuit,two
                                                                      twodata
                                                                           dataacquisition
                                                                                acquisitionmodules,
                                                                                            modules,and
                                                                                                     anda
apersonal
  personal   computer.
           computer.

                                 Figure 1. Schematic of the experimental setup.
                                 Figure 1. Schematic of the experimental setup.
     The two FMG straps (see Figure 2) were designed to capture FMG signals from both the proximal
     The distal
and the  two FMGendstraps
                      of the(see Figure Each
                             forearm.    2) were  designed
                                               strap        to capture
                                                      has eight        FMG signals
                                                                 force sensing        from(FSR402,
                                                                                 resistors  both the proximal
                                                                                                      Interlink
and  the distal end   of the  forearm.   Each  strap  has eight  force sensing   resistors (FSR402,
Electronics, Inc., Los Angeles, CA, USA) embedded inside to capture the pressure from the contact     Interlink
Electronics, Inc.,the
region between     Lossurface
                       Angeles,    CA,limb
                               of the   USA)  embedded
                                            and           inside
                                                 the sensors.     to FSR
                                                               Each  capture
                                                                         has athe  pressure
                                                                                force        from range
                                                                                       sensitivity  the contact
                                                                                                          of 0.1
region between    the surface  of the limb  and  the sensors.  Each FSR  has a  force sensitivity  range
to 10.0 N and a device rise time that is less than 3 µs [42]. These properties ensure that the sensor     of 0.1
to 10.0N and a device rise time that is less than 3 µs [42]. These properties ensure that the sensor can
pick up the minuscule changes in FMG signals. The signals from these sensors were extracted using
an array of voltage divider circuitries and converted into digital data using a data acquisition (DAQ)
device with a 16-bit analog-to-digital resolution (USB-6210, National Instruments Inc., Austin, TX,
An Investigation on the Sampling Frequency of the Upper-Limb Force Myographic Signals - MDPI
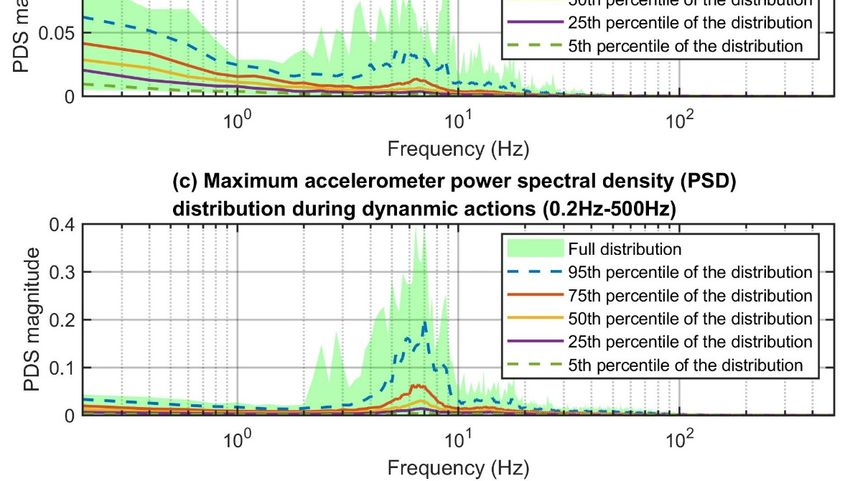
Sensors 2019, 19, 2432                                                                                           4 of 18

 can pick
Sensors 2019,up
              19, the minuscule
                  x FOR          changes
                        PEER REVIEW           in FMG signals. The signals from these sensors were extracted    4 of 18
 using an array of voltage divider circuitries and converted into digital data using a data acquisition
USA).
 (DAQ)The     voltage
          device   with divider     circuit has one base
                          a 16-bit analog-to-digital       resistor
                                                       resolution    per channel
                                                                   (USB-6210,       and the
                                                                                National      values of Inc.,
                                                                                          Instruments     these  base
                                                                                                               Austin,
resistors
 TX, USA). affect
              Thethe     output
                    voltage       response
                               divider       of the
                                        circuit has FSR  sensors.
                                                     one base      In this
                                                               resistor perstudy, theand
                                                                             channel   basethe
                                                                                             resistors
                                                                                               values were    set base
                                                                                                        of these  to 5
kOhm     to affect
 resistors  ensurethe  a output
                          linear FSR    voltage
                                   response   of reading  response In
                                                 the FSR sensors.     within  the actuation
                                                                        this study,  the baseforce   range
                                                                                               resistors     of FMG
                                                                                                          were  set to
applications    (i.e.,
An Investigation on the Sampling Frequency of the Upper-Limb Force Myographic Signals - MDPI
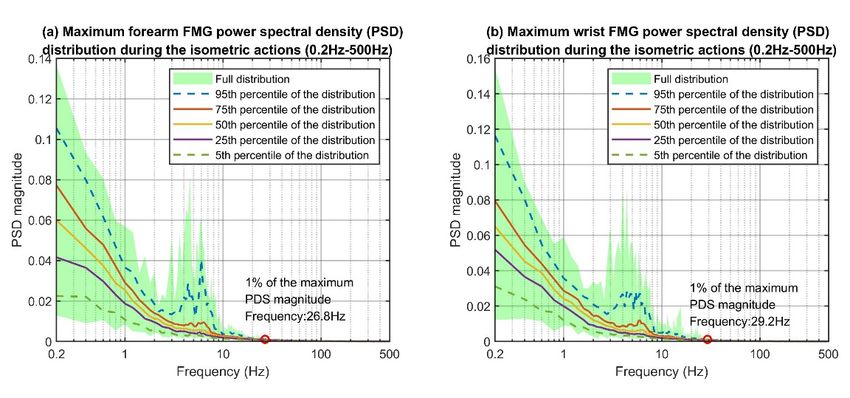
Sensors 2019, 19, 2432                                                                                                                  5 of 18

Sensors 2019, 19, x FOR PEER REVIEW                                                                                                     5 of 18

                                                      Figure 3.
                                                      Figure 3. Sensor
                                                                Sensor placement.
                                                                       placement.

       The core
      The    core ofof the
                        the experiment
                              experiment was     was to to capture
                                                            capture thethe FMG
                                                                            FMG signal
                                                                                    signal patterns
                                                                                             patterns during
                                                                                                         during thethe fastest
                                                                                                                        fastest upper
                                                                                                                                  upper limb
                                                                                                                                           limb
actionsused
actions     usedinin      daily
                      daily        activities
                               activities     (i.e.,(i.e.,
                                                     fingerfinger     and actions).
                                                              and wrist     wrist actions).        By capturing
                                                                                        By capturing                   the FMGassociated
                                                                                                          the FMG patterns            patterns
associated
with            withupper
       the fastest       the fastest       upper limb we
                                 limb movements,              movements,
                                                                  ensured the    wevalidity
                                                                                      ensured  of the
                                                                                                   our validity
                                                                                                        results for ofall
                                                                                                                        our   resultsactions
                                                                                                                           possible     for all
possible     actions    that    can   occur      during     ADL,    which     cover    scenarios    that
that can occur during ADL, which cover scenarios that require either normal speed or rapid movements.     require    either   normal     speed
or rapid
Two   typesmovements.
              of movements      Two were types    of movements
                                             considered       for thewere
                                                                        study,considered
                                                                                 isometric and for the  study,movements.
                                                                                                   dynamic       isometric and       dynamic
                                                                                                                                  Specifically,
movements.
three   isometric   Specifically,
                       actions and       three
                                            fourisometric
                                                    dynamic actions
                                                                  actions and werefour     dynamic
                                                                                      selected:     hand actions    were palm
                                                                                                            squeezing,       selected:    hand
                                                                                                                                     pressing,
squeezing,       palm      pressing,        index      finger   pressing,       index    finger
index finger pressing, index finger tapping, padding, shaking, and simulating a drumming action.   tapping,     padding,       shaking,     and
simulating
These    actionsa drumming
                     were selected   action. as These
                                                 they are  actions
                                                              common were actions
                                                                            selectedused as they   are common
                                                                                               in ADL      [44–47],actions
                                                                                                                      and cover usedainbroad
                                                                                                                                          ADL
[44–47],    and    cover    a  broad      range     of  possible    finger   and    wrist  movement
range of possible finger and wrist movement combinations. For instance, hand squeezing activates           combinations.        For  instance,
hand
the  samesqueezing
              muscle activates
                          group as the    the same
                                                powermusclegrasp, group
                                                                     which as      the of
                                                                               is one    power     grasp,
                                                                                            the most         which isactions
                                                                                                         important         one ofwe  theuse
                                                                                                                                          mostin
important
daily          actions
        activities         we use
                      [45,47].    Palm in daily     activities
                                            pressing,      which [45,47].
                                                                    uses thePalm    pressing,
                                                                                 same   musclewhichgroupuses     the same
                                                                                                            for wrist         muscle group
                                                                                                                         flexion-extension,
foralso
is   wrist    flexion-extension,
           a fundamental            action  is used
                                                also ainfundamental
                                                             daily activities actionand used
                                                                                           a keyin daily
                                                                                                    actionactivities
                                                                                                              includedand   in amany
                                                                                                                                   key action
                                                                                                                                          FMG
included in many
investigations              FMG investigations
                     [9,20,23,48,49].         FMG was[9,20,23,48,49].
                                                             shown to be able     FMG     was shown
                                                                                      to estimate         to be
                                                                                                     finger       able to estimate
                                                                                                               movement                  finger
                                                                                                                              status [22,33];
movementindex
therefore,       statusfinger
                           [22,33];     therefore,
                                    pressing        wasindex    fingerinpressing
                                                           included         the protocolwas included       in thethis
                                                                                                to represent        protocol     to represent
                                                                                                                        fine finger     action.
Index finger pressing is another commonly-used action in daily activities such as mouse clicking such
this  fine  finger    action.    Index      finger    pressing     is another     commonly-used          action   in  daily   activities    [50].
as mouse
Index   fingerclicking
                 tapping [50].        Index finger
                              was selected                  tapping version
                                                  as the dynamic        was selected        as thepressing
                                                                                   of the finger     dynamic       version
                                                                                                               action.         of the
                                                                                                                         Padding,        finger
                                                                                                                                      shaking,
pressing
and  drumming action.actions
                         Padding, wereshaking,
                                           selected and        drumming
                                                        to represent      rapid actions    were selected to represent
                                                                                  wrist flexion–extension,                        rapid wrist
                                                                                                                   pronation–supination,
flexion–extension,
and   abduction–adduction   pronation–supination,
                                        actions, respectively. and abduction–adduction actions, respectively.
       During the
      During       the experiment,
                        experiment, participants
                                            participants were  were instructed
                                                                       instructed to  to perform
                                                                                         perform the the actions
                                                                                                          actions shown
                                                                                                                    shown in   in Figure
                                                                                                                                   Figure 44 as
                                                                                                                                              as
fast  as  possible     for   5  seconds       each    with
fast as possible for 5 seconds each with their dominant hand.their   dominant       hand.    Only   the  action   of  the   dominant
                                                                                                    the action of the dominant hand       hand
was considered
was    considered as    as itit was
                                was expected
                                        expected to    to produce
                                                           produce actions
                                                                        actions at a faster
                                                                                        faster speed than the non-dominant one.
Once completed,
Once     completed, they repeated  repeated all    all actions
                                                        actions two
                                                                  two more
                                                                         more times
                                                                                  times for
                                                                                          for aa total
                                                                                                  total ofofthree
                                                                                                             threetrials.
                                                                                                                     trials. For
                                                                                                                               For isometric
                                                                                                                                    isometric
movements         (Actions      1–3),    participants        were   asked    to  apply
movements (Actions 1–3), participants were asked to apply roughly 10% of the maximum     roughly     10%    of the  maximum         voluntary
contraction force.
contraction       force. For dynamic movements (Actions 4–7), participants were asked to move                                   move within
                                                                                                                                        within
10%    of  the  full  range
10% of the full range of motion.of  motion.       Both    the  maximum        voluntary      contraction     force   and   the
                                                                              voluntary contraction force and the full range of full  range   of
motion were
motion      were assessed
                    assessed prior to data collection with a hand dynamometer and a protractor. However,
10% of
10%    of the
          the maximum
               maximum voluntary voluntary contraction
                                                  contraction force
                                                                  force andand range
                                                                                 range ofof motion
                                                                                             motion were
                                                                                                       were used
                                                                                                               used asas aa guide
                                                                                                                            guide only
                                                                                                                                     only and
                                                                                                                                            and
were    not   monitored        during      the   test.   Participants     were    allowed     to  exceed
were not monitored during the test. Participants were allowed to exceed the 10% limit. The purpose of       the 10%    limit.   The   purpose
of such
such        a step
       a step   was was        to ensure
                       to ensure                that participants
                                       that participants        did not  didovernotfatigue
                                                                                     over fatigue
                                                                                             the hand  theduring
                                                                                                             hand theduring     the allowed
                                                                                                                          test and    test and
allowed
them        them tothe
        to achieve       achieve
                              fastestthe    fastestmovement
                                          natural      natural movement
                                                                     possible. possible.
An Investigation on the Sampling Frequency of the Upper-Limb Force Myographic Signals - MDPI
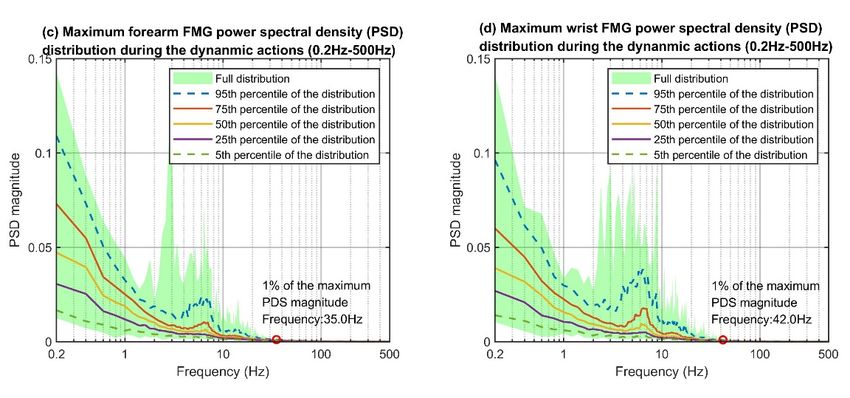
Sensors 2019, 19, 2432                                                                                                         6 of 18
Sensors 2019, 19, x FOR PEER REVIEW                                                                                           6 of 18

                                                 Figure 4. Selected hand actions.
                                                Figure 4. Selected hand actions.
        For the squeezing action, participants were asked to hold the hand in mid-air with a 90◦ elbow
  angleFor   the squeezing
          while  making a fist. action,
                                    When   participants    were asked
                                             the data collection            to hold
                                                                      started,        the hand
                                                                                participants       in mid-air
                                                                                                quickly          withthe
                                                                                                          squeezed      a 90°
                                                                                                                            handelbow
                                                                                                                                   with
angle
  a mild while
           forcemaking      a fist. above
                   as described      When and the data
                                                    then collection     started, as
                                                          relax the muscles        participants
                                                                                     fast as theyquickly       squeezed
                                                                                                      could control.    Theythe would
                                                                                                                                 hand
with
  repeata mild   force until
           the action    as described
                                the dataabove        and stopped.
                                            collection    then relaxFor  thethemuscles   as fast asaction,
                                                                                 palm pressing         they could     control.
                                                                                                              they rested    theThey
                                                                                                                                   hand
would
  on therepeat      the action
           table with    the wrist until  the data
                                      hanging      in collection
                                                       mid-air and  stopped.
                                                                       the elbow Forbent
                                                                                     the palm       ◦
                                                                                           at a 90pressing
                                                                                                       angle. action,
                                                                                                                For thisthey
                                                                                                                          task,rested
                                                                                                                                 it was
the  hand onfor
  important       the  table with to
                     participants     thehold
                                            wristthehanging          ◦ to ensure
                                                      elbow atin90mid-air      and the
                                                                                    theforce
                                                                                         elbow    bent at awas
                                                                                                generated       90° mainly
                                                                                                                     angle. For
                                                                                                                              fromthis
                                                                                                                                     the
task,   it was   important      for  participants      to hold    the   elbow    at 90°  to  ensure
  forearm muscles and not from the bicep or triceps muscles from the upper arm. During data collection, the  force  generated      was
mainly     from the
  they quickly          forearm
                    pressed         muscles
                              the palm           and the
                                            against    nottable
                                                            frommildly
                                                                    the bicep     or triceps
                                                                             without   making  muscles      from the
                                                                                                  any obvious           upper arm.
                                                                                                                    movements       and
During     data   collection,    they   quickly     pressed   the   palm   against   the   table  mildly
  then relaxed as fast as possible. The finger pressing action scheme was similar to the one of the palm     without   making      any
obvious
  pressingmovements
              action, but and       thenonly
                             instead,       relaxed    as fastfinger
                                                  the index      as possible.     The finger
                                                                        was applying       forcepressing
                                                                                                  against the action   scheme
                                                                                                                  table.           was
                                                                                                                           The finger
similar
  tapping  toaction
              the onescheme
                         of the palm      pressing
                                   was similar      to action,  but pressing
                                                       the finger     instead, only    thewith
                                                                                  action,    index thefinger   was applying
                                                                                                         exception    that the force
                                                                                                                                  index
against    the table.
  finger was    moving  Theupfinger
                               and downtapping     action scheme
                                              as quickly    as possiblewasandsimilar  to the finger pressing
                                                                                 an accelerometer                  action,
                                                                                                         was attached        withfinger
                                                                                                                         to the     the
exception     that the
  tip to monitor      theindex
                          action. finger
                                     For was     moving
                                           the three       up and down
                                                        remaining      actions,as participants
                                                                                  quickly as possible
                                                                                                  were once and again
                                                                                                                 an accelerometer
                                                                                                                         holding the
was
  hand attached    to the
          in mid-air      finger
                        with   thetip   to monitor
                                     elbow    bent atthea 90 ◦ angle.
                                                            action.   ForFor
                                                                           thethe
                                                                                three  remaining
                                                                                    padding           actions,
                                                                                                action,          participants
                                                                                                          participants     flexedwere
                                                                                                                                    and
once    again   holding    the   hand    in  mid-air    with   the  elbow     bent  at a  90°  angle.
  extended the hand as quickly as possible while keeping the fingers straight. For the shaking action,   For  the  padding     action,
participants
  participantsflexed
                   shookand      extended
                           the hand            the hand as
                                         by supinating      andquickly    as possible
                                                                   pronating             while
                                                                                 the wrist   jointkeeping
                                                                                                    as quicklythe as
                                                                                                                   fingers   straight.
                                                                                                                      possible    while
For   the   shaking    action,   participants      shook   the   hand    by   supinating    and   pronating
  keeping the hand in a relaxed state. For the drumming action, they moved the hand by abducting and             the  wrist   joint  as
quickly
  adducting as possible
                the wristwhile
                            joint keeping
                                    as quickly  theashand   in a relaxed
                                                       possible              state. For
                                                                  while keeping      thethehanddrumming
                                                                                                  in a gun-likeaction, they moved
                                                                                                                    gesture.
the hand by abducting and adducting the wrist joint as quickly as possible while keeping the hand
in2.3.  Data Processing
    a gun-like    gesture.and Result Analysis Procedure
       Once data collection was completed, each FMG dataset from participants was first normalised
2.3. Data Processing and Result Analysis Procedure
 according to its full range of amplitude variations from the signal reading. In this normalisation
 scheme,
      Onceraw
            datasignals  were was
                   collection   first subtracted
                                      completed,from eachtheir
                                                          FMGminimum        values
                                                                  dataset from     and were then
                                                                                  participants wasdivided     by the full
                                                                                                     first normalised
 range of the
according   to dataset.   Such aof
                its full range     step  reduced the
                                      amplitude        inheritedfrom
                                                    variations     bias the
                                                                        due signal
                                                                             to the participants’ physical
                                                                                    reading. In this         differences
                                                                                                        normalisation
 and the raw
scheme,   different
               signalstightness   of the
                         were first       straps during
                                      subtracted          the donning
                                                    from their   minimum  procedure.
                                                                             values and were then divided by the
       Next,offor
full range        every
                the       single
                      dataset.     trialaof
                                Such        thereduced
                                          step   repeatedtheactions,  the normalised
                                                                inherited   bias due tosignals   were downsampled
                                                                                          the participants’   physical
 with step sizes
differences  and theranging   fromtightness
                        different     2 to 1000ofsamples,
                                                   the strapswhich   corresponds
                                                                during  the donning toprocedure.
                                                                                        sub-sampling frequencies of
 500 Next,
      Hz to for
            1 Hz.    In order
                 every   singletotrial
                                   haveofa the
                                            quantitative
                                                repeated measure     of the
                                                           actions, the      differencesignals
                                                                          normalised     between   the downsampled
                                                                                                were   original signals
 and the
with  stepdownsampled
           sizes ranging ones,
                             from we 2 toneeded   to obtainwhich
                                           1000 samples,      the same   number oftodata
                                                                    corresponds            points fromfrequencies
                                                                                       sub-sampling      the resampledof
 FMG
500  Hzsignals
        to 1 Hz.which    were
                   In order  to achieved     by using the
                                 have a quantitative        linear interpolation
                                                         measure                   method.
                                                                    of the difference        Thethe
                                                                                        between    difference
                                                                                                      originalbetween
                                                                                                                signals
and the downsampled ones, we needed to obtain the same number of data points from the resampled
FMG signals which were achieved by using the linear interpolation method. The difference between
An Investigation on the Sampling Frequency of the Upper-Limb Force Myographic Signals - MDPI
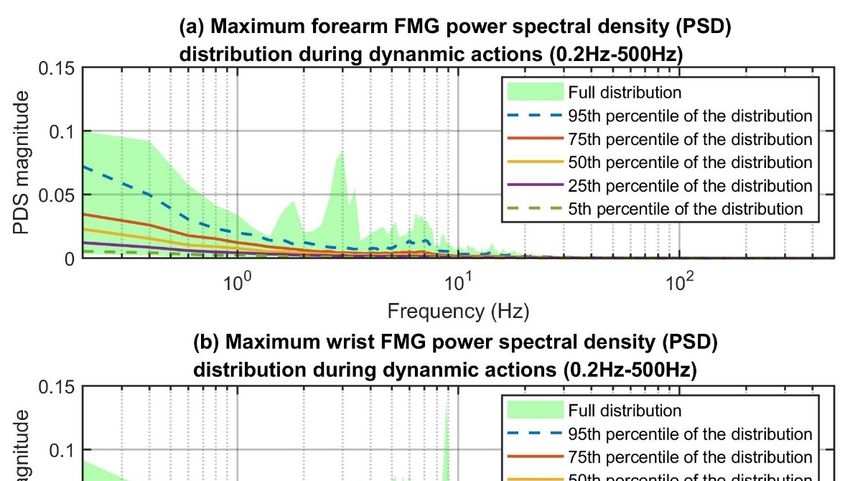
Sensors 2019, 19, 2432                                                                              7 of 18

the two versions of signal patterns was represented by the mean of the root-mean-square-error (RMSE)
of the 8 FMG channels. The equation for the mean RMSE is shown as
                                                         r
                                                             Pn                   2
                                                   Pm         i   (xij −x0 ij )
                                                     j                n
                                   avg. RMSE =                                                         (1)
                                                              m
where x is the original sample value with a sample index, i, and a channel index j; x’ is the interpolated
value from a downsampled signal with the corresponding indexes; m is the number of FMG channels;
and n is the number of samples. To improve readability, we refer to the mean of RMSE of the eight
channels as RMSE from now on. Once the RMSE values from all participants’ trials were computed,
we analysed the obtained values separately based on four categories. The four categories were:
(1) isometric actions with forearm FMG, (2) isometric actions with wrist FMG, (3) dynamic actions
with forearm FMG, and (4) dynamic actions with wrist FMG.
      Then, various factors contributing to the different RMSE values for the entire dataset were analysed
by using N-way ANOVA with Tukey’s Honestly Significant Difference Procedure (provided in the
statistics and machine learning toolbox of MATLAB 2017a). The factors considered for this analysis
were the range of different resampling frequencies, action type, signal type, hidden factor associated
with participants’ data, and choice of different interpolation methods. Due to the amount of complexity
of the N-way ANOVA test required and the limited computational power available, we only focused on
the resampling frequencies that were from 10 Hz to 100 Hz. We further divided this set of frequencies
into nine groups based on an incremental frequency range with a step of 10 Hz. The action types
were the isometric actions and the dynamic actions, and the signal types were the types of FMG
extracted from the forearm and wrist. Finally, the choices of interpolation methods were the linear,
cubic, and spline interpolations.
      In order to gain insight into the power of the FMG signals, we computed the power spectral
density (PSD) using the fast Fourier transform (FFT) for each of the eight unfiltered FMG signals that
were collected during each of the 5-second actions. The maximum PSD reading of the eight FMG
channels for each frequency component within the entire spectrum was then defined as the maximum
FMG power density. This maximum power density represented the highest possible power which
could be captured using the eight FSR sensors. Note that the FFT assumes the periodic nature of the
signals, which is the case for this specific experimental protocol. However, when FMG is used for
predicting limb actions in daily activities, such an assumption may not be valid. Therefore, we also
computed the PSD using the autoregressive (AR) method, which does not assume the periodic nature
of the signals, to provide another investigation on the power of the signals. The PSD calculated using
the AR method is included in the Appendix A.

3. Results
     In this section, we present an example of the FMG signals captured for different actions to provide
a visual representation of the FMG patterns, followed by the analysis of the RMSE between the original
signals pattern and the ones with different downsample frequencies. Then, the results on the different
factors contributing to the difference in RMSE are provided. Finally, we investigate the PSD of the
FMG patterns to gain an understanding of the FMG power characteristics.
     An example of a one-second period of collected FMG data from a participant during one repetition
is shown in Figure 5. The y-axes show the normalised FMG magnitude and the x-axes indicate time
in milliseconds. The forearm FMG are shown in the first and the third rows, while the wrist FMG
are shown in the second and the fourth rows. The different colored lines indicate the different FMG
channel readings. For each action, at least one repeated FMG pattern can be observed, suggesting that
the FMG setup was capable of detecting the actions selected in this study.
An Investigation on the Sampling Frequency of the Upper-Limb Force Myographic Signals - MDPI
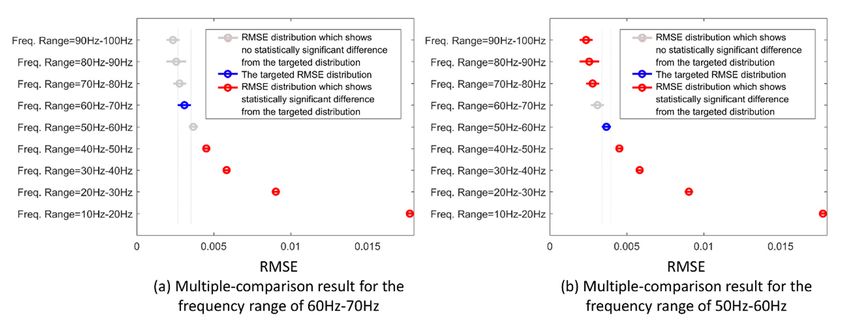
Sensors 2019, 19, 2432                                                                                                      8 of 18
Sensors 2019, 19, x FOR PEER REVIEW                                                                                         8 of 18

                            Figure 5.
                            Figure 5. One second
                                          second of
                                                 of FMG
                                                    FMG signals
                                                        signals collected
                                                                collected during
                                                                          during one
                                                                                 one trial.
                                                                                      trial.

      The
      The RMSE
            RMSE value
                     value forfor each
                                   each downsampled
                                          downsampled action   action sequence
                                                                          sequence was was calculated
                                                                                              calculated to  to form
                                                                                                                 form thethe RMSE
                                                                                                                              RMSE
distribution
 distribution graphs
                graphs that
                          that are
                                 are shown
                                      shown in  in Figure
                                                    Figure 6.6. For each each graph,
                                                                                graph, thethe x-axis
                                                                                               x-axis shows
                                                                                                        shows the the frequencies
                                                                                                                       frequencies
ranging
 ranging from 1 Hz   Hz to
                         to 500
                              500HzHzininloglogscale
                                                 scaleand andthethe   y-axis
                                                                    y-axis     shows
                                                                            shows    thethe    corresponding
                                                                                           corresponding        RMSERMSE     values.
                                                                                                                         values.  To
To  summarise,
 summarise,    thethe  entire
                    entire      datasetwas
                            dataset      wasobtained
                                               obtainedfrom from12  12participants
                                                                        participantsand andthey
                                                                                              they each
                                                                                                     each performed the seven seven
actions
 actions sequence
          sequence three
                      three times.
                               times. The seven
                                              seven actions
                                                      actions included
                                                                  included three
                                                                              three isometric
                                                                                      isometric actions
                                                                                                    actions and
                                                                                                              and four
                                                                                                                    four dynamic
                                                                                                                           dynamic
actions.
 actions. Hence,    for the   isometric
                              isometric    actions,   there   were
                                                               were 108 RMSE values per one downsampled signal
                                                                      108  RMSE      values    per  one   downsampled         signal
pattern.
 pattern. For
           Fordynamic
                dynamicactions,
                            actions,there
                                       therewerewere144144
                                                         RMSERMSE  values   per per
                                                                       values    one one
                                                                                      downsampled
                                                                                            downsampled   signalsignal
                                                                                                                   pattern  to form
                                                                                                                          pattern to
the  distribution   graph.     The  full distribution      of the   RMSE     is shown      as a  light
 form the distribution graph. The full distribution of the RMSE is shown as a light green background    green   background      and
different  percentiles
 and different          of the of
                 percentiles     distribution    (i.e., the(i.e.,
                                    the distribution         95th,the75th, 50th,
                                                                        95th,      25th,
                                                                               75th,      and25th,
                                                                                       50th,    5th percentiles),    are indicated
                                                                                                       and 5th percentiles),     are
with  different
 indicated  withcolored    lines.
                   different       For all
                                colored      categories,
                                          lines.  For all the    RMSE values
                                                            categories,    the RMSE decreased
                                                                                          valuesasdecreased
                                                                                                      the sampling     frequencies
                                                                                                                  as the  sampling
increased.
 frequenciesSince    the majority
               increased.    Since theof majority
                                         the FMGof    literature
                                                         the FMGused        100 Hz
                                                                      literature      for100
                                                                                   used    experiments      involving involving
                                                                                                Hz for experiments         dynamic
actions,
 dynamicwe    considered
            actions,         this sampling
                      we considered        thisfrequency
                                                sampling as       the pointas
                                                              frequency       ofthe
                                                                                  reference
                                                                                      point of forreference
                                                                                                    discussion.for At a frequency
                                                                                                                    discussion.   At
of  100 Hz,  the RMSEs      of  the 95th   percentile    curve     dropped    below     0.001   for all
 a frequency of 100 Hz, the RMSEs of the 95th percentile curve dropped below 0.001 for all categories.  categories.
An Investigation on the Sampling Frequency of the Upper-Limb Force Myographic Signals - MDPI
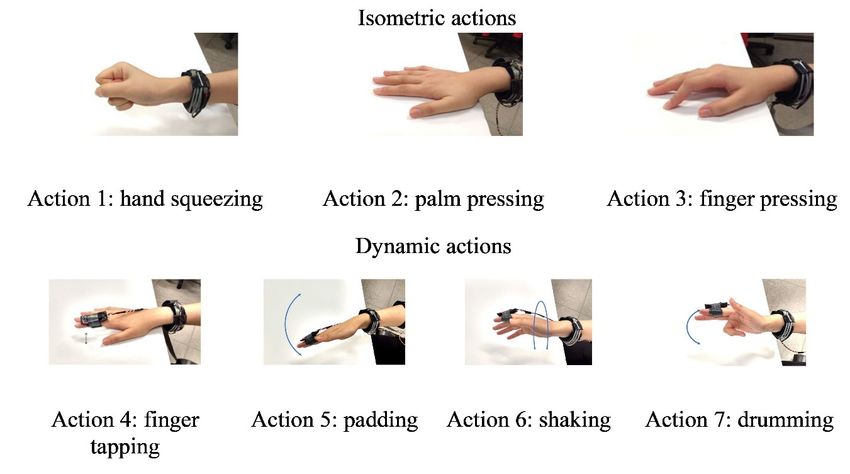
Sensors 2019, 19, 2432                                                                                                9 of 18
 Sensors 2019, 19, x FOR PEER REVIEW                                                                                  9 of 18

                         Figure 6.
                         Figure 6. RMSE distributions
                                        distributions of
                                                      of different
                                                         different resampling
                                                                    resamplingfrequencies.
                                                                               frequencies.

       The
       The results
            results of
                     of the
                         the N-way
                             N-way ANOVAANOVAon     onRMSE
                                                       RMSEdistribution
                                                                 distribution are
                                                                               are partly
                                                                                    partly shown
                                                                                            shown inin Table
                                                                                                        Table2.2. With
                                                                                                                   With thethe
exception
 exception ofof different
                differentinterpolation
                            interpolationmethods,
                                               methods, all
                                                          all of
                                                              of the
                                                                  the selected
                                                                      selected factors
                                                                                factors have
                                                                                        have significant
                                                                                               significant effects
                                                                                                             effects on
                                                                                                                      on the
                                                                                                                           the
RMSE
 RMSEresults
         resultsusing
                 usingaasignificant
                            significantlevel
                                           levelof   p-value== 0.05.
                                                  ofp-value      0.05. The
                                                                       The most
                                                                            most influential
                                                                                  influential factor
                                                                                               factor is
                                                                                                       is the
                                                                                                           the range
                                                                                                               range ofof the
                                                                                                                           the
resampling
 resampling frequency
               frequency as  as itit has
                                     has the
                                          the largest
                                               largestF-value
                                                       F-value(F  (F== 5560),
                                                                       5560), followed
                                                                               followed byby the
                                                                                              the action
                                                                                                  action type     (F == 308),
                                                                                                            type (F     308),
the
 the signal
      signaltype
             type(F(F== 75), and the participant
                                          participant factors    (F =
                                                        factors (F  = 54).
                              Table 2. Partial Results of the N-way ANOVA on RMSE.
                              Table 2. Partial Results of the N-way ANOVA on RMSE.
                 Factors                           F-value                                       P-value
               Freq. Range              Factors    5559.99           F-value    p-value            0.00
              Action Type             Freq. Range 308.18             5559.99      0.00             0.00
               Participant            Action Type 53.96              308.18       0.00             0.00
                                      Participant                     53.96       0.00
               Signal Type                           74.78                                         0.00
                                      Signal Type                     74.78       0.00
              Interpolation          Interpolation 1.53                1.53       0.22             0.22
       Freq. Range*Interpolation                     21.53
                             Freq. Range *Interpolation               21.53       0.00             0.00
       Action Type*Interpolation                      0.07
                             Action Type *Interpolation               0.07        0.93             0.93
                              Participant
       Participant *Interpolation          *Interpolation
                                                      0.03            0.03        1.00             1.00
                             Signal Type *Interpolation               0.29        0.75
       Signal Type*Interpolation                      0.29                                         0.75
                                       Freq: Frequency; * indicates the interaction.
                                      Freq: Frequency; * indicates the interaction.
     The multiple-comparison test results for different frequency ranges are shown in Figure 7.
      The multiple-comparison test results for different frequency ranges are shown in Figure 7. The
The x-axis indicates the RMSE distribution for each group of the downsampled frequencies.
 x-axis indicates the RMSE distribution for each group of the downsampled frequencies. The
The corresponding range for each group is indicated on the y-axis. The blue symbol indicates
 corresponding range for each group is indicated on the y-axis. The blue symbol indicates the targeted
the targeted group which is being tested against the others. The gray color symbols indicate the
 group which is being tested against the others. The gray color symbols indicate the corresponding
corresponding groups that have no statistical difference against the targeted group; while the red color
 groups that have no statistical difference against the targeted group; while the red color symbols
symbols indicate the corresponding groups that have a statistical difference against the targeted one.
 indicate the corresponding groups that have a statistical difference against the targeted one.
An Investigation on the Sampling Frequency of the Upper-Limb Force Myographic Signals - MDPI
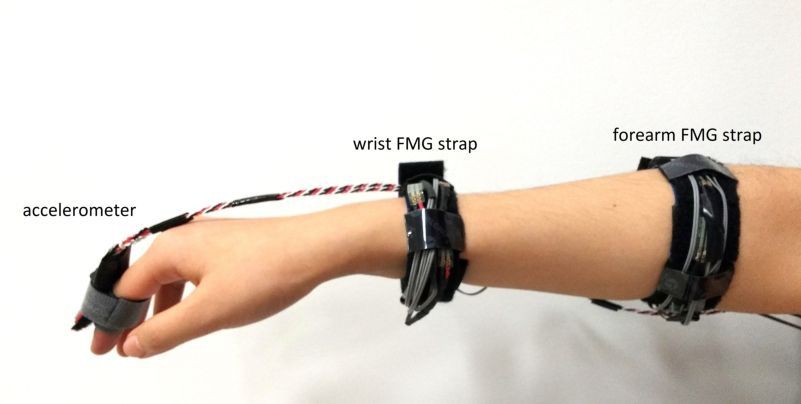
Sensors 2019, 19, x FOR PEER REVIEW                                                                                  10 of 18
   Sensors 2019, 19, 2432                                                                                                10 of 18

      Taking all factors into consideration, the RMSE distribution of the frequency range of 60–70 Hz
was statistically
         Taking alldifferent   from
                     factors into    the ones below
                                  consideration,       50 Hz,
                                                  the RMSE       but did not
                                                              distribution  of differ from the
                                                                               the frequency      onesofwith
                                                                                               range         higher
                                                                                                         60–70 Hz was
frequencies   (see  Figure  7a). In contrast, the RMSE    distribution  of the  range   of 50–60   Hz was  different
   statistically different from the ones below 50 Hz, but did not differ from the ones with higher frequencies
from
   (seethe ones7a).
        Figure    above   70 Hz, despite
                      In contrast,        its distribution
                                   the RMSE    similarity toofthe
                                                                the60–70
                                                                    rangeHz   range Hz
                                                                          of 50–60    (seewas
                                                                                            Figure  7b). from
                                                                                               different This result
                                                                                                              the ones
suggests
   above 70 Hz, despite its similarity to the 60–70 Hz range (see Figure 7b). This result suggests FMG
           that  the  minimum      sampling   frequency   should    be at least  above   60  Hz   for general  that the
applications.
   minimum sampling frequency should be at least above 60 Hz for general FMG applications.

         Figure 7. RMSE distributions for different resampling frequency ranges. The circle indicates the mean
      Figure 7. RMSE distributions for different resampling frequency ranges. The circle indicates the mean
         RMSE and the horizontal line shows the +/− one standard deviations.
      RMSE and the horizontal line shows the +/- one standard deviations.
         The maximum power spectral density distributions of each of the four data categories (i.e.,
   theThe  maximum
       categories    thatpower    spectral
                           were based   on density     distributions
                                            the combination      of theoftwoeach  of the
                                                                                action     fourand
                                                                                        types     data
                                                                                                     twocategories  (i.e., the
                                                                                                          sensor placements),
categories   that were     based  on  the combination       of the two   action    types   and   two  sensor
   are shown in Figure 8. The y-axis of each plot indicates the PSD magnitudes and the x-axis indicates       placements),
arethe
    shown    in Figure
       frequency          8. The y-axis
                    components      from of
                                          0.2each
                                              Hz toplot
                                                     500indicates
                                                           Hz. The the
                                                                     lowerPSD    magnitudes
                                                                              bound    of the FMG andbandwidth
                                                                                                       the x-axis indicates
                                                                                                                   should be 0
theHz,
    frequency    components       from  0.2  Hz  to  500  Hz.   The  lower     bound    of
        as the raw FMG signals were the output voltage from the voltage divider circuitry   the  FMG    bandwidth
                                                                                                             and were should
                                                                                                                         always
be positive.
   0 Hz, as the   raw   FMG    signals  were   the output    voltage   from    the  voltage   divider
              However, the magnitude of the 0 Hz component was disproportionally larger than the        circuitry and   were rest,
always   positive.   However,     the  magnitude    of  the  0  Hz component        was   disproportionally
   therefore, it was ignored for the investigation. The overall trends in each category’s distribution are      larger   than
thesimilar.
     rest, therefore,     it was ignored
             The PSD magnitudes               for as
                                       decrease    thetheinvestigation.     The overall
                                                           frequency increases       roughlytrends
                                                                                                to the in
                                                                                                       3 Hzeach  category’s
                                                                                                             mark.   After that,
distribution
   the PSD magnitudes start to increase and reach the local maxima at around 5 Hz to 7 Hz, and3finally
               are similar.   The  PSD  magnitudes      decrease    as the   frequency     increases   roughly  to the     Hz
mark.
   resume the decreasing trends. There are no more peaks at the tail-end of the plots, which suggeststo
       After   that,  the  PSD  magnitudes     start to  increase   and   reach   the  local  maxima     at around   5 Hz    that
7 Hz,
   the and
       FMGfinally
              setup resume
                       did not the
                                pickdecreasing    trends. Therenoise
                                      up any high-frequency         are no    more
                                                                           such       peaks
                                                                                  as the      at the
                                                                                          50/60   Hz tail-end
                                                                                                      powerlineof interference.
                                                                                                                  the plots,
which suggests that the FMG setup did not pick up any high-frequency noise such as the 50/60 Hz
powerline interference.
Sensors 2019, 19, 2432                                                                          11 of 18
Sensors 2019, 19, x FOR PEER REVIEW                                                            11 of 18

                     Figure 8.
                     Figure    Maximum FMG
                            8. Maximum FMG power
                                           power spectral
                                                 spectral density
                                                          density (PSD)
                                                                  (PSD) distributions.
                                                                        distributions.

      We considered the upper bound frequency of the FMG patterns to be the frequency associated
     We considered the upper bound frequency of the FMG patterns to be the frequency associated
with 1% of the maximum PSD reading on the 95th percentile distribution curve. The maximum PSD
of all four groups resided at 0.2 Hz, but the 1% mark varied slightly across the different categories
(see the red circles in Figure 8). The frequencies associated with the 1% marks are 26.8 Hz, 29.2 Hz,
35.0 Hz, and 42.0 Hz for the corresponding groups. Overall, the upper bound frequencies for dynamic
actions were higher than those for isometric actions. This result was expected as the FMG sensor
captured movement artifacts (i.e., sliding between the sensors and skin) during dynamic actions while
captured movement artifacts (i.e., sliding between the sensors and skin) during dynamic actions
such artifacts were less prominent in isometric scenarios. The upper bound frequencies between the
while such artifacts were less prominent in isometric scenarios. The upper bound frequencies
forearm and wrist FMG were similar for the isometric actions (26.8 Hz vs. 29.2 Hz) but different in the
between the forearm and wrist FMG were similar for the isometric actions (26.8 Hz vs. 29.2 Hz) but
dynamic scenarios (35.0 Hz vs. 42.0 Hz). The main reason could be the difference in sensor placement.
different in the dynamic scenarios (35.0 Hz vs. 42.0 Hz). The main reason could be the difference in
The rapid movements were generated at the hand and fingers, which were much closer to the wrist
sensor placement. The rapid movements were generated at the hand and fingers, which were much
than the forearm. The PSD distribution plots of the forearm, wrist, and the accelerometer data (see
closer to the wrist than the forearm. The PSD distribution plots of the forearm, wrist, and the
Figure 9) support such reasoning as the shape and position of the PSD of the accelerometer data are
accelerometer data (see Figure 9) support such reasoning as the shape and position of the PSD of the
closer to those of the wrist than those of the forearm for the higher frequency portion.
accelerometer data are closer to those of the wrist than those of the forearm for the higher frequency
portion.
Sensors 2019, 19, 2432                                                                                                  12 of 18
Sensors 2019, 19, x FOR PEER REVIEW                                                                                    12 of 18

      Figure 9.
      Figure  9. Maximum
                 Maximum FMG
                         FMG power
                                power spectral
                                      spectral density
                                               density (PSD)
                                                       (PSD) distribution
                                                             distribution of
                                                                          of FMG
                                                                             FMG and
                                                                                 and the
                                                                                     the accelerometer
                                                                                         accelerometer
      signal during dynamic actions.
      signal during dynamic actions.

4. Discussion
      We
      We considered
          considered 100   100 HzHz as
                                     as the
                                         the frequency
                                              frequency of  of interest
                                                                interest for
                                                                          for discussion
                                                                               discussion since
                                                                                             since the
                                                                                                    the majority
                                                                                                         majority of
                                                                                                                   of the
                                                                                                                      the FMG
                                                                                                                           FMG
literature use thethe 100
                       100 HzHzsampling
                                  samplingfrequency
                                                frequencyinintheirtheirexperiments
                                                                         experiments       involving   dynamic    movements.
                                                                                        involving dynamic movements. A
A  sampling
sampling        frequency
             frequency      ofof100
                                  100HzHzproduced
                                            producedRMSEs
                                                        RMSEsless   lessthan
                                                                          than0.001
                                                                                 0.001forforall
                                                                                             all categories’
                                                                                                 categories’ data
                                                                                                              data and it was
                                                                                                                            was
larger  than  double     the  highest    upper    bound    frequency     captured
larger than double the highest upper bound frequency captured in the experiment.      in the  experiment.   Therefore,    based
on the Nyquist theorem [51], this frequency  frequency could
                                                           could capture
                                                                   capture thethe majority
                                                                                   majority of FMG signal characteristics
without
without suffering
          sufferingfrom fromaliasing
                               aliasingerrors.
                                           errors.
      Five
      Five factors
            factorsthat
                      thatcould
                            couldpotentially
                                     potentiallyaffect
                                                    affectthe
                                                            theRMSE
                                                                  RMSE  were
                                                                           wereinvestigated.
                                                                                  investigated. The  frequency
                                                                                                   The  frequencyrange
                                                                                                                    rangewaswas
                                                                                                                              an
obvious
an obviousfactor   that
               factor     could
                       that  couldaffect  thethe
                                      affect   results, asas
                                                  results,   shown
                                                                shown  ininTable
                                                                            Table  2.2.Based
                                                                                        Basedononthe
                                                                                                   theresults
                                                                                                       resultsof
                                                                                                               ofthe
                                                                                                                  the multiple
                                                                                                                       multiple
comparison      test, we   established
comparison test, we established            that  the minimum       sampling     frequency
                                                                                frequency     for general  FMG    applications
should be above 60 Hz,     Hz, asas the
                                    the sampling
                                          sampling range
                                                      range between
                                                                between 60–70 Hz     Hz did
                                                                                          did not
                                                                                              not significantly
                                                                                                   significantly increase
                                                                                                                  increase the
                                                                                                                             the
RMSE whenwhen compared
                 compared to   to aa sampling
                                     sampling frequency
                                                  frequency between
                                                                 between 90–100
                                                                            90–100 Hz. Hz. Furthermore, based on the PSD
analysis, we suggest that a minimum    minimum sampling frequency of 84 Hz               Hz be
                                                                                             be used,
                                                                                                  used, especially
                                                                                                         especially when
                                                                                                                     when thethe
application
applicationinvolves
                involvesfast    dynamic
                             fast  dynamic  actions.  Other
                                                actions.        thanthan
                                                            Other     the frequency
                                                                            the frequencyrange,range,
                                                                                                 the action
                                                                                                        the type  was
                                                                                                             action     another
                                                                                                                     type   was
another important factor, as it had the largest F-value in the ANOVA test, which was about 4 times
larger than the one following it (i.e. the signal type). This finding suggests that the minimum
Sensors 2019, 19, 2432                                                                               13 of 18

important factor, as it had the largest F-value in the ANOVA test, which was about 4 times larger than
the one following it (i.e. the signal type). This finding suggests that the minimum sampling frequency
should be selected based on whether the application involves dynamic movements or not. Moreover,
it is important to pay attention to the source of FMG (i.e., wrist or forearm) for the same action. Part of
the information content that FMG signals carry is specific to each participant. To acknowledge this,
the role of hidden factors in participants’ data on error was investigated, and it was found that such
individual-specific data affects the RMSE. The choice of interpolation method was also investigated.
However, it was found that the interpolation method by itself does not have a significant effect on the
RMSE distribution. Interestingly, when considering different frequency ranges together, the interaction
between the two factors did have a significant influence on the distribution (see the sixth row of Table 2).
Based on the spread of the distribution, we expected that the choice of interpolation methods would
dictate the RMSE value at the lower frequency range, but that its influence would become less as the
frequency increases.
       After the initial decrease in PSD plots (Figure 8), the magnitudes rise again to the peak at around
the 5–7 Hz range and resume the decreasing trend at around the 10 Hz mark. This upward trend
of magnitudes was mainly tied to how fast a healthy individual could move the hand voluntarily.
This frequency range supports findings in the literature showing that the maximum speed for finger
tapping is around 6.5 Hz [52,53]. FMG signal patterns represent movements of muscle groups and
although each muscle can contract at a very fast speed [41], the overall manifestation of the movement is
reduced at the surface due to different layers of muscles and skin. As a result, the dominant FMG signal
content is more related to the speed at which the action is performed rather than muscle contraction.
       FMG is often used along with different machine learning algorithms to decipher hand gestures
and limb actions. For example, Jiang et al. were able to detect 48 different static gestures only
using the raw FMG magnitudes with a support vector machine classifier [54]. However, in order
to decipher dynamic gestures or limb actions, temporal features need to be extracted for machine
learning purposes. A temporal feature is usually extracted from a processing window which contains
multiple consecutive samples. For instance, the second derivative of an FMG signal is a temporal
feature of the signal itself, which can be calculated from the difference in magnitude between two
consecutive samples. This feature can be associated with the action speed and the change of instant
position of the limb, which is of importance for the velocity control scheme of a prosthesis or other
robotic devices. It is important to know that the numeric manifestation of a temporal feature highly
depends on the sampling frequency of the signal. If the signal is sampled at a rate that is slower than
what is required for the targeted action, the extracted temporal feature may not contain information
that can be associated with the action. This scenario may lead to a sub-optimal prediction performance
for a machine learning model. By sampling FMG signals above the suggested minimum frequency,
it is guaranteed that the capability of FMG can be fully exploited for the subsequent processing step.
       This study focused on investigating the FMG frequency associated with hand actions and did not
include movements of the arm. Studies show that FMG on the forearm can detect arm movements as
well [9], which means such movements might also affect the pattern of FMG signals. However, for the
purpose of this study, it was sufficient to identify the frequency bandwidth associated with actions of
the hand, which are faster than arm movements. Therefore, the sampling frequency obtained in this
study is likely applicable for actions involving arm movements.
       The action force used in the experiment was low in order to achieve the fastest action possible.
The effect of different action force levels on the PSD was not investigated in this study. It is known that
some action force (i.e., the grasping force) can be correlated with FMG using regression techniques [2].
The higher the variation in grasping force, the more distinct FMG patterns can be observed, and vice
versa. If the manifestation of the grasping force is too small to be picked up by the FMG sensor,
the overall spectral magnitude will be small, and the shape of the spectral graph will be flat. If the
change in grasping force is large enough to be pickup by FMG sensors, then at least one distinct peak
can be observed from the spectral graph. However, a larger grasping force will require more time for
Sensors 2019, 19, 2432                                                                                   14 of 18

the muscle to generate and recover, hence, the dominant peaks of the spectral graph will be shifted
towards a lower frequency. As long as the investigation includes the fastest action, the upper bound of
the FMG frequency in the PSD distribution graph should not change. Therefore, a higher force level is
not expected to change the results of this investigation.
     Twelve healthy participants volunteered in this research, their main occupations were college
students and university researchers, not professional athletes nor individuals that practice fast hand
actions such as a professional drummer. For instance, the fastest drummer can achieve an average
drumbeat of 16.8 beats per second per hand [55]. Such individuals can achieve much quicker actions
than the general public, therefore, testing results may show different PSD distributions if such
individuals participate in a study. A future study is warranted for sportsmen and individuals with
these specific traits.
     The sensors used in this investigation were the popular polymer thick film sensor (i.e., FSR402),
which have been used in many FMG studies. Even though it has good force range and a quick response
time which made it suitable for this investigation, it is not designed for precise force measurements
and one should exert caution when using FSR for FMG applications. For instance, it has a good single
part force repeatability error (i.e., +/−2%), but a high part-to-part force repeatability error of +/−6%.
In order to reduce the discrepancies due to a different sensor, the sensor reading should be normalised
before further processing. Another limitation of the FSR sensor is its nonlinear voltage output response
when using the voltage divider circuit. The nonlinearity exaggerates when the actuation force on the
sensor is high. However, when the actuation force is low, which is the case for FMG applications,
the nonlinearity can be reduced by selecting the right base resistor [43]. For instance, by using a
5 kOhm base resistor in this study, the voltage response exhibits a strong linear trend within the 1.2 N
of actuation force [43]. Also, FSR is known to have large hysteresis and long-term drift error, which are
10% and 5% respectively [42]. However, they are of lesser concern for FMG applications because of the
low actuation force and the fact that the sensor does not experience constant large loads for a long
period. A more precise force sensor would benefit FMG research.

5. Conclusions
      This work focused on identifying the minimum sampling frequencies for FMG signals during
rapid isometric and dynamic actions. The FMG signals were captured with a high sampling frequency
of 1 kHz and were then reconstructed with different frequencies lower than the original one. We showed
that the commonly used 100 Hz sampling frequency was sufficient to capture the majority of FMG
characteristics as a low RMSE (i.e., less than 0.001) was obtained. Other than the frequency factor,
different action types and signal types, and participants’ characteristics were all found to affect the
RMSE. It was also found that the suitable sampling frequency could potentially be further reduced if the
action and signal types are known beforehand. Based on Nyquist theorem, we suggested the minimum
sampling frequencies of 54 Hz and 58 Hz for forearm and wrist FMG signals during isometric actions,
and 70 Hz and 84 Hz for forearm and wrist FMG signals during dynamic actions. This study provides
guidelines for FMG signals sampling, which is important for future research and development of FMG
technology for human–machine systems.

Author Contributions: Z.G.X. designed the FSR strap prototype, implemented data collection software, performed
experiments, analysed the experimental results and participated in manuscript preparation. C.M. supervised the
project, contributed to discussions and analysis and participated in manuscript revisions. All authors read and
approved the final manuscript.
Funding: This work was supported by the Natural Sciences and Engineering Research Council of Canada,
the Canadian Institutes of Health Research, and the Michael Smith Foundation for Health Research.
Acknowledgments: We would like to thank Tingyu Hu and the members of MENRVA research group for their
assistance with the project.
Conflicts of Interest: The Principal Investigator, Carlo Menon, and members of his research team have a vested
interest in commercialising the technology tested in this study if it is proven to be successful and may benefit
financially from its potential commercialisation. The data are readily available upon request.
Sensors 2019, 19, 2432                                                                                                      15 of 18
 Sensors 2019, 19, x FOR PEER REVIEW                                                                                        15 of 18

Appendix
AppendixAA

FMGPower
FMG PowerSpectral
         SpectralDensity
                  DensityUsing
                         UsingYule–Walker
                               Yule–WalkerAuto-Regressive
                                           Auto-RegressiveAlgorithm
                                                           Algorithm
        ThePSD
      The    PSDofofFMGFMGusing
                              usingYule–Walker’s
                                      Yule–Walker’s       auto-regressive
                                                       auto-regressive        (AR)
                                                                           (AR)       method
                                                                                  method          is shown
                                                                                             is shown           in Figure
                                                                                                         in Figure     A1. A1.     For
                                                                                                                              For the
 the AR   method,     the order    of the  model   is  a hyperparameter        that  should    be
AR method, the order of the model is a hyperparameter that should be tuned to reflect the signal    tuned   to   reflect  the  signal
 content.Generally
content.     Generallyspeaking,
                          speaking,  thethe   higher
                                          higher        the order,
                                                  the order,           the higher
                                                               the higher              the frequency
                                                                             the frequency      resolutionresolution         will be.
                                                                                                               will be. However,
ifHowever,
   a very high if aorder
                    very is
                          high
                            used,order   is used,
                                    the PSD    maythe    PSD
                                                      have     mayspectral
                                                             many     have many peaks spectral
                                                                                        and itspeaks      and
                                                                                                   analysis       its become
                                                                                                               will   analysisverywill
 become     very   challenging.    In this  study,   the  AR   order  was    varied    within    10
challenging. In this study, the AR order was varied within 10 to 5000 range. We found that the shape to 5000    range.    We   found
 that
of  PSDtheofshape   of PSD
             the order    of of thewas
                             1000    order  of substantially
                                          not   1000 was not different
                                                                 substantially
                                                                             fromdifferent
                                                                                     the onesfrom      the ones
                                                                                                  obtained     from obtained     from
                                                                                                                       500 or 5000.
 500 or 5000.
Therefore,    weTherefore,
                   presentedwe  thepresented
                                     PSD usingthe  anPSD
                                                       order using  an order
                                                               of 1000   in theof   1000 in the figure.
                                                                                 figure.
      AsAsobserved
           observedin   inFigure
                           FigureA1,A1,the
                                         thePSD
                                              PSDobtained
                                                    obtainedusing
                                                                usingAR  ARhashasaasimilar
                                                                                      similartrend
                                                                                                trendto tothat
                                                                                                           thatobtained
                                                                                                                   obtainedusingusing
 FFT (see
FFT    (see Figures
             Figure A1    andA1).
                       8 and    FigureThe8).PSD
                                             Thevalues
                                                   PSD values     initially
                                                            initially         decrease
                                                                       decrease           but then
                                                                                    but then           increase
                                                                                                 increase           to around
                                                                                                             to around             5–7
                                                                                                                             5–7 Hz.
 Hz.  However,      when   following     the  same   steps   and  criteria  to  identify   the
However, when following the same steps and criteria to identify the minimum requirements for     minimum        requirements       for
 sampling     frequencies    of  FMG    signals   as  explained    in Section    2, the  PSD    using
sampling frequencies of FMG signals as explained in Section 2, the PSD using AR resulted in values      AR    resulted     in  values
 that were
that    were much
               much lower
                       lower than
                                than those
                                       thoseidentified
                                               identifiedusing
                                                             usingthetheFFTFFTmethod.
                                                                                 method. A    A detailed
                                                                                                  detailed discussion
                                                                                                               discussion of   of the
                                                                                                                                   the
 discrepancies      between    the  PSD   using   the   FFT   and  the  AR    methods     is  out
discrepancies between the PSD using the FFT and the AR methods is out of the scope of this study   of  the  scope     of  this  study
 butisisaatopic
but        topicforforfuture
                       futurework.
                                work. Overall,
                                        Overall, for
                                                   for aa conservative
                                                          conservative measure,
                                                                            measure, the the results
                                                                                              results presented
                                                                                                        presented in    in the
                                                                                                                            themain
                                                                                                                                 main
 manuscriptremain
manuscript       remainvalid
                          validforforselecting
                                      selectingthetheminimum
                                                       minimumsampling
                                                                     samplingfrequency
                                                                                  frequencyfor   forFMG
                                                                                                      FMGsignals.
                                                                                                              signals.

       Figure
        Figure A1.    Maximum FMG
                A1. Maximum     FMG power
                                      power spectral
                                               spectral density
                                                        density (PSD)
                                                                (PSD) distributions
                                                                      distributions using
                                                                                    using Yule–Walker
                                                                                          Yule–Walker
       autoregressive method with order of 1000.
        autoregressive method with order of 1000.

References
References
1.1.   Castellini,
        Castellini,C.;
                   C.; Artemiadis,
                       Artemiadis, P.;
                                    P.;Wininger,
                                         Wininger,M.;
                                                  M.;Ajoudani,
                                                       Ajoudani,A.;A.;Alimusaj,
                                                                      Alimusaj,M.;
                                                                                 M.; Bicchi,
                                                                                       Bicchi, A.;
                                                                                                A.; Caputo,
                                                                                                    Caputo, B.;
                                                                                                             B.; Craelius,
                                                                                                                 Craelius, W.;
                                                                                                                           W.;
       Dosen,
        Dosen, S.; Englehart, K.; et al. Proceedings of the first workshop on Peripheral Machine Interfaces:Going
               S.; Englehart, K.; et al. Proceedings  of the first workshop   on Peripheral     Machine    Interfaces:   going
       beyond
        beyondtraditional
                traditionalsurface   electromyography.Front.
                            surfaceelectromyography.      Front.Neurorobot.   2014,8,
                                                                  Neurorobot.2014,    8,22.
                                                                                        22. [CrossRef] [PubMed]
2.2.   Wininger,
        Wininger,M.M.Pressure
                       Pressuresignature
                                signatureofofforearm
                                              forearmasaspredictor
                                                          predictorofofgrip  force.J.J.Rehabil.
                                                                        gripforce.     Rehabil.Res.
                                                                                                 Res. Dev.  2008, 45,
                                                                                                      Dev. 2008,  45, 883–892.
                                                                                                                      883–892.
 3.    [CrossRef]  [PubMed]
        Xiao, Z.G.; Menon, C. Counting Grasping Action Using Force Myography: An Exploratory Study With
       Healthy Individuals. JMIR Rehabil. Assist. Technol. 2017, 4, e5.
Sensors 2019, 19, 2432                                                                                       16 of 18

3.    Xiao, Z.G.; Menon, C. Counting Grasping Action Using Force Myography: An Exploratory Study With
      Healthy Individuals. JMIR Rehabil. Assist. Technol. 2017, 4, e5. [CrossRef] [PubMed]
4.    Ahmadizadeh, C.; Merhi, L.-K.; Pousett, B.; Sangha, S.; Menon, C. Toward Intuitive Prosthetic Control:
      Solving Common Issues Using Force Myography, Surface Electromyography, and Pattern Recognition in a
      Pilot Case Study. IEEE Robot. Autom. Mag. 2017, 24, 102–111. [CrossRef]
5.    Ravindra, V.; Castellini, C. A Comparative Analysis of Three Non-Invasive Human-machine Interfaces for
      the Disabled. Front. Neurorobot. 2014, 8, 1–10. [CrossRef]
6.    Lucaccini, L.F.; Kaiser, P.K.; Lyman, J. The French electric hand: some observations and conclusions.
      Bull. Prosthet. Res. 1966, 10, 31–51.
7.    Phillips, S.L.; Craelius, W. Residual kinetic imaging: A versatile interface for prosthetic control. Robotica
      2005, 23, 277–282. [CrossRef]
8.    Li, N.; Yang, D.; Jiang, L.; Liu, H.; Cai, H. Combined Use of FSR Sensor Array and SVM Classifier for Finger
      Motion Recognition Based on Pressure Distribution Map. J. Bionic Eng. 2012, 9, 39–47. [CrossRef]
9.    Xiao, Z.G.; Menon, C. Performance of Forearm FMG and sEMG for Estimating Elbow, Forearm and Wrist
      Positions. J. Bionic Eng. 2017, 14, 284–295. [CrossRef]
10.   Xiao, Z.G.; Menon, C. Towards the development of a wearable feedback system for monitoring the activities
      of the upper-extremities. J. Neuroeng. Rehabil. 2014, 11, 2. [CrossRef]
11.   Dementyev, A.; Paradiso, J.A. WristFlex. In Proceedings of the 27th Annual ACM Symposium on User
      Interface Software and Technology, Honolulu, HI, USA, 5–8 October 2014; ACM Press: New York, NY, USA,
      2014; pp. 161–166.
12.   Jiang, X.; Xiao, Z.G.; Menon, C. Virtual grasps recognition using fusion of Leap Motion and force myography.
      Virtual Real. 2018, 22, 297–308. [CrossRef]
13.   Ha, N.; Withanachchi, G.P.; Yihun, Y. Force Myography Signal-Based Hand Gesture Classification for the
      Implementation of Real-Time Control System to a Prosthetic Hand. In Proceedings of the 2018 Design of
      Medical Devices Conference, Minneapolis, MN, USA, 9–12 April 2018; pp. 1–4.
14.   Radmand, A.; Scheme, E.; Englehart, K. High-density force myography: A possible alternative for upper-limb
      prosthetic control. J. Rehabil. Res. Dev. 2016, 53, 443–456. [CrossRef]
15.   Radmand, A.; Scheme, E.; Englehard, K. High-resolution muscle pressure mapping for upper-limb
      prosthetic control. In Proceedings of the MEC—Myoelectric Control Symposium, Fredericton, NB, Canada,
      19–22 August 2014; pp. 189–193.
16.   Jiang, X.; Merhi, L.-K.; Menon, C. Force Exertion Affects Grasp Classification Using Force Myography.
      IEEE Trans. Hum. -Mach. Syst. 2017, 41, 1–8. [CrossRef]
17.   Ghataurah, J.; Ferigo, D.; Merhi, L.K.; Pousett, B.; Menon, C. A Multi-sensor Approach for Biomimetic
      Control of a Robotic Prosthetic Hand. In Proceedings of the 5th International Work-Conference (IWBBIO
      2017), Granada, Spain, 26–28 April 2017; pp. 74–84.
18.   Chengani, R.; Delva, M.L.; Sakr, M.; Menon, C. Pilot study on strategies in sensor placement for robust
      hand/wrist gesture classification based on movement related changes in forearm volume. In Proceedings of
      the 2016 IEEE Healthcare Innovation Point-of-Care Technologies Conference (HI-POCT), Cancun, Mexico,
      9–11 November 2016; pp. 46–49.
19.   Jiang, X.; Chu, H.T.; Xiao, Z.G.; Merhi, L.-K.; Menon, C. Ankle positions classification using force myography:
      An exploratory investigation. In Proceedings of the 2016 IEEE Healthcare Innovation Point-Of-Care
      Technologies Conference (HI-POCT), Cancun, Mexico, 9–11 November 2016; pp. 29–32.
20.   Cho, E.; Chen, R.; Merhi, L.-K.; Xiao, Z.; Pousett, B.; Menon, C. Force Myography to Control Robotic Upper
      Extremity Prostheses: A Feasibility Study. Front. Bioeng. Biotechnol. 2016, 4, 1–12. [CrossRef]
21.   Delva, M.L.; Sakr, M.; Chegani, R.S.; Khoshnam, M.; Menon, C. Investigation into the Potential to Create
      a Force Myography-based Smart-home Controller for Aging Populations. In Proceedings of the 7th IEEE
      International Conference on Biomedical Robotics and Biomechatronics (Biorob), Enschede, The Netherlands,
      26–29 August 2018; pp. 770–775.
22.   Castellini, C.; Ravindra, V. A wearable low-cost device based upon Force-Sensing Resistors to detect
      single-finger forces. In Proceedings of the 5th IEEE RAS/EMBS International Conference on Biomedical
      Robotics and Biomechatronics, São Paulo, Brazil, 12–15 August 2014; pp. 199–203.
23.   Belyea, A.T.; Englehart, K.B.; Scheme, E.J. A proportional control scheme for high density force myography.
      J. Neural Eng. 2018, 15, 046029. [CrossRef]
You can also read