An Economic Analysis of the Mussel Industry in Prince Edward Island Gulf Region - Policy and Economics Branch, Gulf Region Department of Fisheries ...
←
→
Page content transcription
If your browser does not render page correctly, please read the page content below
An Economic Analysis of the Mussel Industry
         in Prince Edward Island

                   Gulf Region

       Policy and Economics Branch, Gulf Region
          Department of Fisheries and Oceans
                Moncton, New Brunswick

                     June, 2006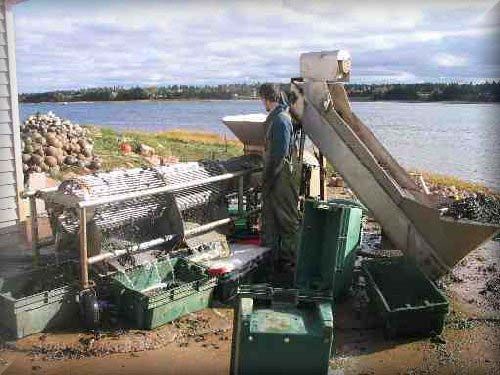
An Economic Analysis of the Mussel Industry
                          In Prince Edward Island

                                               Table of Contents

Executive Summary ......................................................................................................3
Description of the Mussel Industry ................................................................................4
  Site Selection .............................................................................................................4
  DFO’s Role ................................................................................................................4
  Mussel Culture Methods............................................................................................5
     Longline system .....................................................................................................5
     Seed (spat) collection ............................................................................................6
     Socking...................................................................................................................7
     Harvesting ..............................................................................................................9
     Processing .............................................................................................................9
     Mussel Growing Operation Summary of Activities and Investment....................10
  Culture Areas and Production .................................................................................11
  Trade........................................................................................................................14
     Products and Price...............................................................................................14
     Markets and Exports ............................................................................................14
Macro-Economic Impact of the Mussel Industry on the PEI Economy ......................15
Aquatic Invasive Species: Tunicates ..........................................................................19
  Historical background of tunicate species in PEI waters ........................................19
  Types of tunicates....................................................................................................19
  Solitary tunicates......................................................................................................19
     Clubbed tunicate ..................................................................................................19
     Vase tunicate .......................................................................................................20
  Colonial tunicates ....................................................................................................20
     Violet tunicate.......................................................................................................20
     Golden Star tunicate ............................................................................................20
     Establishment factors...........................................................................................21
     Distribution of tunicates........................................................................................21
  Effects of tunicates on the mussel industry.............................................................24
Conclusion ...................................................................................................................25

                                                                                                                               2
Executive Summary
The Blue mussel (Mytilus edulis) is the most important aquaculture specie on Prince
Edward Island (PEI). This industry has grown during the last 13 years from 9.2
million pounds in 1992 to approximately 40 million pounds in 2004. The value at the
harvesting level is presently close to $24 million and almost $49 million at the
processing level. The Island mussel culture industry supplies 80% of the blue
mussels in the North American market. Traditionally, mussels have been sold fresh
in the shell, although in the last few years, some attention has been directed towards
value-added products such as mussels in a prepared sauce, smoked mussels, and
blast frozen cooked mussels.
Mussel culture occurs in many rivers and estuaries in PEI. However, the majority of
the culture areas are concentrated along the Northern and Eastern coasts. Mussel
leases account for a total of 10,831 acres. With 123 growers operating 291 leases
and 8 processing companies (most of them holding leases), the industry has become
a vital sector of the Island economy creating directly and indirectly the equivalent of
622 full-time jobs and generating sales of $107 million in 2004. In terms of the
contribution to the province’s Gross Domestic Product (GDP), the mussel industry
accounted for $36.3 million in 2004.
One of the biggest challenges of the mussel industry in the last five years has been
the population explosion of certain species of aquatic invaders. Presently, four
species of tunicates have been identified in PEI waters: Clubbed tunicate appeared
in 1998 followed by the Golden Star in 2001, and then the Violet and the Vase
tunicates in 2004. These species are causing higher maintenance and labour costs
for growers and processors. Research projects are presently being conducted to
determine the impacts of these various types of tunicates on the mussel growth
period and meat yields.
3Description of the Mussel Industry
Site Selection
The selection of a grow-out site that will produce quality market-sized mussels within
an acceptable time frame is crucial for the profitability of a mussel culture operation.
The ability to select the best site will depend on the understanding of specific local
environmental factors that influence production levels, such as site exposure,
temperature, current velocity, sediment loading, and food availability, as well as on
the understanding of specific regional environmental factors, such as tidal amplitude,
ice coverage, seasonal weather patterns, and climate.
DFO’s Role
DFO is the lead federal agency for aquaculture and acts as both a regulator and
enabler of the aquaculture sector, consistent with its role as a department of
sustainable development.
As a regulator DFO is responsible for administering, monitoring and enforcing
compliance with its regulations relating to conservation and protection,
environment and habitat protection (Fisheries Act- sections 35 (1) (2); 36) and
aquatic animal health (Fish Health Protection Regulations) in a clearly defined,
reasonable and consistent manner.
As an enabler of aquaculture development, DFO is responsible for helping to
improve the business climate for aquaculture by:
ensuring that DFO's laws and regulations relating to aquaculture are clear,
efficient, effective, consistently applied and relevant to the sector;
investing in aquaculture science and research development;
working in partnership with the provinces and territories to develop a proactive
process for site approvals; and
considering support for industry development programs consistent with DFO's
mandate and objectives.
In addition to actions relating to its departmental mandate, as lead federal agency
for aquaculture, DFO's role also includes:
co-ordinating and bringing increased coherence to federal aquaculture policy
and program development; and
helping to brand Canada as a world leader in sustainable aquaculture
development.
In Prince Edward Island, DFO is responsible for the administration of aquaculture
leases since 1928. Most mussel lease applications will require a formal assessment
under the Navigable Waters Protection Act (NWPA) and under the Canadian
Environmental Assessment Act (CEAA). The federal government must also assess
the impact of proposed aquaculture sites with respect to a number of other matters
including, native rights and land claims, migratory birds, utilization by other
4stakeholder groups, shellfish food safety, protection of fish habitat and pollution
prevention
Mussel Culture Methods
Around the world, some mussels are grown in bottom culture systems, but in many
places they are grown in off-bottom systems (suspension) because suspended
culture from rafts or longlines have proven to yield the greatest production per unit
area. In PEI, all mussels are grown in suspension and the longline system is
generally used.
Longline system
Mussel growers in PEI choose the fully suspended method because their experience
has shown that mussels that do not touch the bottom do not pick up grit or form
pearls (although this is true for the first two years of growth, growers have
experienced mussels that grow pearls if kept in suspension longer than 24 months).
Another reason for choosing the suspended method of culture is that mussels are
distributed evenly in a control setting where they have equal access to nutrition and
therefore, are more likely to have an even growth rate with high meat to shell ratio.
In fact, growers in PEI have shown that their cultured mussels produce twice the
amount of mussels, as well as meat yields that are usually 3 to 4 times higher than
wild mussels.
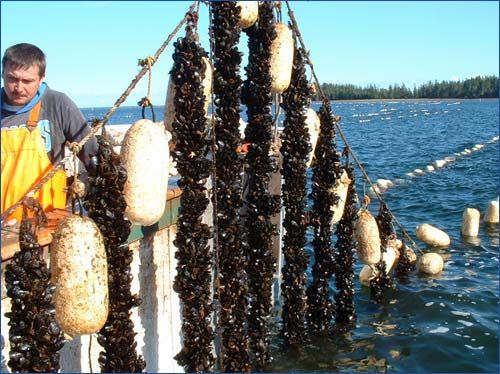
The longline system consists of a backline (headrope), sleeves (or socks), buoys,
anchors, and anchor rods (Figure 1). The seed collectors or socks are attached to
the backline and most longline operations use long polypropylene ropes (80-150 m)
that are anchored securely at both ends and supported by floats tied at intervals
along their length.
Figure 1 - Longline system
5Floatation devices represent a major cost of the mussel operation. More expensive
buoys such as pressurized plastic floats are gaining popularity because of their
longer life expectancy and greater buoyancy which may translate into a better
investment over time. However, the most common floatation device is still the
standard styrofoam lobster buoy coated with paint.
Throughout the years, the mussel industry in PEI has used many different types of
anchors such as sea anchors, scrap metal pieces, railroad rails, and concrete blocks.
The anchoring system chosen will depend on cost, bottom type, current, ice and
other local factors. Presently, the most common anchoring system is the anchor
screws and/or the steel barrel cut in half and filled with concrete installed at the end
of each line.
Seed (spat) collection
To be able to grow mussels you first need to obtain seeds, and growers require huge
quantities of seeds to ensure a good crop. That is one reason growers will have
mussel seeds and larger mussels growing at the same time. Unpredictable and
insufficient seed supply due to poor recruitment can become a constraint to the
expansion of the mussel operation. The selection of a site for the collection of seeds
is therefore as important to the identification of a grow-out site. The recruitment
success at a particular site is dependent on various factors, such as duration and
timing of the settlement period, the number of viable larvae produced, retention of
larvae within the system, and predation. In PEI, seeds are usually collected in the
upper reaches of inlets or rivers where shallow water depths limit grow-out
operations.
Acquiring a mussel lease allows you to collect your own seeds on your lease. There
is only a small proportion of growers (i.e. around 5%) that will also buy seeds from
licenced fishers who are allowed to collect seeds in the spring or in the fall within
certain areas. Growers depend on this important source of seeds. The seed
collectors can be made from all sorts of materials such as old rope, Italian socking
material, nylon bags, and vexar mesh, the most common being 12-18 mm
polypropylene rope around two metres in lengths. Whatever the material being
used, the collectors are usually attached to the longline (backline) 30-50 mm apart
and weighted to keep them suspended vertically in the water column, usually giving
a relatively uniform size distribution of seeds. Providing adequate floatation of
longlines (so they do not touch the bottom) is important, especially to avoid mortality
of seed by predators or fall-offs during storm events.
6The seed collectors are usually hung to the backline just before the spat are
expected to settle in the summer and because of the availability of spat occurring
between late May and late June, the window of opportunity to put the lines in place is
relatively short. Once the lines are in the water, it takes 2 to 3 weeks to determine if
a good set has been received.
Socking
Mussel larvae settle on the collectors and grow rapidly, reaching a seed-size of
10 to 25 mm, usually by fall. At this time, the harvesting of the seeds begins and
mussel seeds are manually stripped off the collectors and are transported to shore
where specialized grading equipment (declumper) cleans and sorts the seeds into
two or three sizes depending on the grower’s preference (Figure 2). Seeds too small
(usually less than 4 mm) are removed.
The seeds are then transferred to grow-out units where the “sleeving” or “socking”
operation begins. The large majority of growers undertake socking operations from
early October to mid or late November, which corresponds to the time of year when
employment in the mussel industry peaks. Socking is the operation by which seed
mussels are loaded into socks or mesh sleeves, usually at a density of 120 to 240
seed mussels per foot of sock. The sock, a long mesh tube often strengthened with
a strand of polypropylene twine, is about 40 mm in diameter and average
2.5-3.0 meters in length depending on local water depths. After socking, the
mussels are sometimes bathed in seawater for some twelve hours to allow the
formation of byssal threads before suspending them from the longlines where they
grow to market size which can take from 18 to 24 months (Figure 3).
7Figure 2 - Mussel seed grading equipment
Figure 3 - Mussel Socks
8Water quality has to be monitored during this time and as winter approaches, the
grower’s time requirement will increase, as it is critical that the lines be prepared for
the winter. Freeze-over of mussel-producing bays and rivers in winter has resulted
in development of adaptive technology to safeguard losses of gear to ice, particularly
in spring. Any longlines left at the surface risk being destroyed by ice, therefore it is
recommended that the grower have knowledge of the average ice depth in the area
(normally between 30 and 90 cm), so that the lines may be lowered below that level.
In November, weights such as concrete blocks are usually tied to the backline at 10-
15 m intervals and the floatation buoys are adjusted accordingly in order to sink the
longline at least 1.5 m beneath the water surface yet allowing the socks to float clear
of the bottom.
Harvesting
The average mussel sock will hold between 15 and 30 kilograms of mussels once
they reached market size (between 55-60 mm) and a line will contain nearly two
tonnes of mussels. At this stage, the harvesting is carried out on special vessels that
have equipment such as a boom and a manual or hydraulic winch system that lifts
the longlines from the water. In the warmer months, the socks can then be detached
and transferred in the fishing boat or small barge. To minimize the losses of mussels
during this transfer, the vessel may have a chute to guide the longline and socks
aboard or sometimes a basket is placed below the sock to recover any fallen clumps.
Other growers may also double sock over the mussels to prevent fall-offs.
Harvesting during the winter months is cold hard work and time consuming, but
worthwhile because the market is strongest during the winter. The ice presence
imposes a specific harvesting technique, which typically begins in December once
the ice has set in. The first step is to be able to identify with precision the location of
the mussel longline system, which is easily done with the Global Positioning System
(GPS), but some growers locate lines using ice poles. Workers will get to the
location using snowmobiles, all terrain vehicles, small trucks, or sleds, depending on
ice conditions, and they will drill holes in the ice, generally with a chain saw equipped
with a special ice cutting blade. The longline system is then hauled out of the water
with a hydraulic system attached to an A-frame by a diver. As the lines emerge, the
socks are cut from the backline and stacked in insulated plastic boxes to protect
them from wind-chill.
Processing
Part of the PEI mussel industry’s success has been its capability to serve the market
year-round. Because a processing plant usually processes tonnes of mussels each
year, it needs to have predetermined delivery dates for harvested mussels, which
consequently determine the harvesting schedule of the grower (who needs to
respect his contract with the plant). However, if for specific reasons such as weather
conditions, the grower can not harvest in the specified time, an alternative grower will
be notified. The predetermined schedule also keeps the market from becoming
saturated with mussels and regulates production levels so that product is not wasted.
Harvested mussels must be carefully looked after and must not be left in the direct
sunlight. In mild weather they may be left stacked in tubs, providing that they are
protected from any breeze, but once harvested, mussels must be transported to the
9processing plants as quickly as possible so they remain fresh and do not sit in their
own liquids or muddy water. Once transported to the processing plant, the mussels
are stripped from the socks and mechanically declumped, washed and graded.
Also, the byssus (beard) are usually removed by a debyssing machine before the
final inspection that will remove any broken or substandard shells. Finally, the
mussels are packed and ready for shipment.
Mussel Growing Operation Summary of Activities and Investment
Tables 1 and 2 provide a brief summary of winter and summer activities of a typical
mussel growing operation and table 3 shows some of the average investment costs
associated with a growing operation. Each operation is different and the activities
and costs are very site and operator specific. In other words, a lot depends on the
size and method of operation, as well as other external factors such as experience,
number of employees, weather conditions, etc.
Table 1 - Winter Activities of a Mussel Growing Operation
Months Activities
November-December • Setting the lines for the winter
• Winter harvest
December – March • Maintaining equipment and preparing for the
summer season
• Maintenance and monitoring and possibly
November – May
harvesting
Table 2 - Summer Activities of a Mussel Growing Operation
Months Activities
May – June • Setting spat collectors and monitoring older
lines
June – October • Summer harvest
September – October – November • Harvesting spat for socking, and returning the
socks to the line
May – November • Monitoring the lines and preparing the lines
and equipment for the winter
10Table 3 - Investment of a Mussel Growing Operation
Hydraulics $5,000.00 - $10,000.00
Floatation Devices $2.75 - $3.00 each
Anchors $20.00 - $25.00 each
Insulated Boxes (with covers) $500.00 - $600.00 each
Declumper $10,000.00 - $15,000.00
Sock Mesh .07 - .12 cents per meter
Mussel Boat $25,000.00 - $40,000.00
24’ aluminum boat $70,000.00 - $100,000.00
40’ mussel boat $200,000.00 - $300,000.00
Lease (annual fee) $10.00 per acre
Aluminum socking table $3,000.00 - $5,000.00
Culture Areas and Production
Mussel culture occurs on leases in many of the rivers and estuaries in PEI, but the
majority of the culture areas are concentrated along the Northern and Eastern coasts
(see figure 4). In total, the 291 mussel leases in PEI account for a total of 10,831
acres, where 123 growers harvest their mussels. These mussels are purchased by
eight processing companies, with most of them also holding leases.
Figure 4 - Mussel Leases in Prince Edward Island
11PEI is the largest producer of mussels in Canada, accounting for close to 77% of all
production in 2004, followed far behind by Newfoundland and Nova Scotia with 10%
and 9% of mussel production respectively. The provinces of New Brunswick and
Quebec are also involved in the aquaculture of mussels. The mussel industry in PEI
has grown intensively during the last 13 years; increasing its production from 9.2
million pounds in 1992 to approximately 40 million pounds in 2004 (see figure 5). As
shown by the following graph, production has however been relatively stable in the
last five years.
Figure 5 - Mussel Production in PEI from 1992 to 2004
Volume Value
(Million lbs) ($ Million)
45 30
40
25
35
30 20
25
15
20
15 10
10
5
5
0 0
1992 1993 1994 1995 1996 1997 1998 1999 2000 2001 2002 2003 2004
Years Volume (Lbs) Value ($)
Source: DFO Gulf Region Policy & Economics, Statistics Division
12Table 4 shows the number of growers & leases (2005) and production by
bay/estuary for 2004. The production shows the quantity and value of mussels that
are purchased from the processors.
1
Table 4 – Number of growers, leases and production by bay/estuary
Number Number Total Production (2004)
Name of of of Leased
Bay/River/Basin Growers Leases Acreage LBS. VALUE ($)
Malpeque Bay2 22 32 1,635.14 6,536,491 3,921,895
New London Bay3 18 25 701.48 5,535,413 3,321,248
Murray River 10 23 918.22 4,469,812 2,681,887
Tracadie Bay4 34 48 1,726.50 4,119,459 2,471,675
Boughton River 4 8 415.72 3,794,030 2,276,418
Brudenell River 7 13 297.15 2,672,874 1,603,724
Darnley Basin 13 14 291.93 2,125,536 1,275,322
5
Rustico Bay 13 18 622.04 2,060,539 1,236,323
St. Peters Bay 11 27 1,554.43 1,934,157 1,160,494
Cardigan Bay/River 14 18 561.15 1,900,325 1,140,195
St. Mary's Bay 5 13 706.44 1,802,930 1,081,758
Montague River 6 11 191.77 1,473,491 884,095
Savage Harbour 12 13 354.02 598,314 358,988
Hillsborough Bay6 10 13 504.11 17,071 10,243
Others7 13 15 351.11 605,548 363,329
8
TOTAL 192 291 10,831.21 39,645,990 23,787,594
Source: DFO Gulf Region: Statistical Division (production); PEI Aquaculture Division (leases &
growers), and information provided by processors.
1
Number of growers, number of leases, and lease acreage is as of September 08, 2005.
2
Malpeque Bay includes Malpeque Bay, Bentick Cove, Bideford River, Chichester Cove, and March
Water.
3
New London Bay includes New London Bay, Southwest River and Stanley River.
4
Tracadie Bay includes Tracadie Bay and Winter Bay.
5
Rustico Bay includes Rustico Bay and Hunter River.
6
Hillsborough Bay includes Hillsborough Bay, Orwell Bay and West River. Hillsborough Bay is mainly
used for spat collection.
7
Others include Cascumpec Bay, Covehead Bay, Enmore River, Mill River, North Lake, Souris River
and South Lake.
8
# Growers: In reality, there are 123 mussel growers in PEI because some growers have more than
one lease in more than one bay.
13Trade
Products and Price
For the most part, mussels are still sold fresh in the shell although some attention
has been directed towards value-added products such as mussel in a prepared
sauce, smoked mussels, and blast frozen cooked mussels. In 2004, a little over 9%
of the PEI total exports were sold frozen, salted, dried or in brine (Statistics Canada).
Traditionally, fresh mussels are placed in mesh bags, which allow for drainage and
ventilation before they are packed into master cartons for shipment. As it can be
expected, technology is always evolving and the new MAP (Modified Atmospheric
Pack) is an example of this.
The price of mussels has remained very stable in the last decade. At the harvesting
level, growers receive approximately $0.60/lb and processors receive between
$1.00/lb to $1.18/lb for their mussels.
Markets and Exports
PEI is by far the principal exporter in Canada, accounting for over 88% of Canadian
mussel exports in 2004. The second and third largest exporting provinces of
mussels are Newfoundland and Nova Scotia with 6.5% and 3.0% of mussel exports
in 2004.
The amount of PEI mussels that are sold locally and in Atlantic Canada is minimal
and only a small percentage of production (around 9%) is sold in Canada, mainly to
large Canadian urban centres. The remaining production is sold mainly in the United
States (93.5%). Table 5 shows PEI’s mussel exports by country of destination.
Table 5 - PEI Total Exports by Country of Destination – 2000 to 2004 (Dollars)
% in
Country 2000 2001 2002 2003 2004
2004
United States 19,036,052 21,403,890 21,274,537 21,256,415 19,819,042 93.5%
Japan 396,693 1,077,832 823,498 409,754 1,236,685 5.8%
Israël - - 25,816 58,598 117,012 0.6%
Hong Kong - 4,463 4,4019 - 25,900 0.1%
Others 96,648 4,363 24,000 82,024 435 0.0%
TOTAL 19,529,393 22,490,548 22,151,870 21,806,791 21,199,074 100%
Source: Statistics Canada: www. strategis.gc.ca
14Macro-Economic Impact of the Mussel Industry on the PEI
Economy9
The objective of this section is to quantify the economic impact of Prince Edward
Island’s mussel industry on the province’s economy. The analysis focuses on the
processing component of the industry. It nevertheless indirectly includes the impact
of the growers since we took into consideration all purchases of the processors,
including the purchases of mussels. Unfortunately, the information related to the
expenditures made by the growers was not available.
The data used in the present study is for the year 2004. It is extrapolated from
information received from processors representing over 99% of the sector’s
production.
Methodology
An analysis like this one can only be done using a proven economic model, in this
case an input-output model. Information for our analysis came directly from the
processing sector. Of the 8 mussel processing plants in PEI, 7 of them were
interviewed and provided information concerning their operations in 2004.
The principle behind the input-output model is essentially to “follow the money path.”
For example, processing equipment used by a plant will be purchased from a
manufacturing plant which in turn may offer its employees more work which in turn
will increase their expenditures, pay more taxes, etc. The input-output model
incorporates all these components.
We present the direct, indirect and induced impacts that result in the total economic
impact. Direct impacts represent the total expenditures of processors for goods,
services and salaries. Indirect impacts are the result of the expenditures by
processors, except for salaries. Induced impacts are the impact of expenditures of
employees of processors.
In other words, the direct impacts are the expenditures made by the processors to
acquire goods such as the processing equipment, boxes, etc., the services of
electricians, truck drivers etc., and the salaries of the individuals on their payroll.
The indirect impacts are generated by the companies that supply the processing
equipment and boxes as well as the electricians and truck drivers that receive a
contract to offer such goods or services to the processors. In the case of the
company that builds and installs the processing equipment, they buy goods and
services to build this piece of equipment and pay salaries to their employees.
9
This section was completed with the collaboration of Dr. Pierre-Marcel Desjardins from L’Université
de Moncton.
15The induced impacts represent the impact of the expenditures made by the
employees hired by the processors. For example, each employee will spend a part
of his wages on goods and services such as food, housing, insurance, clothing,
transportation etc. This pattern of consumption is based on the census data
collected from the consumer habits of PEI.
Finally, we need to remind the reader that such an analysis aims to present a
relatively accurate picture of the situation but one should always be reminded that
the results are not an “exact” measure of the impacts, but rather an “acceptable
approximation”.
Results
Sales Generated
We first estimate the value of sales generated by the mussel processing sector
(Table 6). For example, the direct impact on sales corresponds to the value of
mussels sold by processors.
Indirect sales correspond to the value of the sales generated as a result of the
processors purchases (e.g. purchases of mussels from growers, packaging,
processing equipment, etc.). In other words, the economic activities of the various
parties that supply or service the processors (mussel growers, electricians, truck
drivers, equipment builders, supplier of boxes etc.) generate sales from their
suppliers. In the case of the mussel growers, they will buy boats, buoys, cables,
winches, boxes etc. These acquisitions represent the indirect sales.
Induced sales correspond to the sales generated by the salaries paid by processors
to his employees (ex: vehicles, groceries, clothing, etc., purchased by employees).
The sector was directly responsible for nearly 50 million dollars in sales. Another 36
million dollars in sales were indirectly generated and a further 21 million were
induced. We thus have a total of more than 106 million dollars in sales generated in
Prince Edward Island as a result of the presence of the mussel sector.
Table 6 - Sales Generated (million $)
PEI
Direct $48.7
Indirect $36.4
Induced $21.6
Total $106.7
Employment
Turning to employment, we use the concept of person-years to analyze the impact of
the sector. For example, if two persons each worked 26 weeks during the year, this
would correspond to 1 person-year, i.e. 52 weeks of employment. Our results
16consequently do not correspond to the number of individuals involved in the sector. It
rather corresponds to the level of full-time equivalent employment.
Table 7 - Employment in Person-Years
PEI
Direct 281.0
Indirect 253.0
Induced 88.2
Total 622.2
The sector was directly responsible for 281 person-years of employment, indirectly
responsible for 253 person-years and induced a further 88.2 person-years of
employment (Table 7). We thus have a total employment equivalent to 622.2 person-
years. Taking into account the seasonal nature of the economy, we know that the
number of persons involved is significantly greater than 622.
Gross Domestic Product (GDP)
The gross domestic product measures the value of the economic activity generated
within a given territory. For example, if a processor purchases a truck for which he
paid $40,000 from a local retailer which purchased it from the manufacturer in
Ontario for $35,000, the contribution to the gross domestic product of the province of
Prince Edward Island was $5,000. We can therefore see how the contribution to the
gross domestic product is much smaller than the value of sales generated. The
difference between the two will tend to be greater for smaller regions – or provinces –
than for bigger ones. In other words, a province that builds and supplies most of the
equipment and services required to a specific economic activity will generate a
greater impact on its GDP than one where many of the equipment have to be
imported from outside the province.
We should mention that because we do not have the information for the location of
the growers’ suppliers, we have to assume that the location corresponds to the
provincial profile for similar sectors. Given that mussel growing is concentrated in
Prince Edward Island, most suppliers are probably from the province. Therefore we
are probably underestimating the contribution to the gross domestic market as a
result of not having detailed information for the growers.
The mussel processing sector directly contributed nearly 15 million dollars to the
province’s gross domestic product, indirectly contributed a nearly equivalent amount
to Prince Edward Island’s gross domestic product and induced more than 6.5 million
dollars (Table 8). The total contribution of the sector to the province’s gross domestic
product was more than 36 million dollars. Considering that the GDP of the province
amounted to $4,023 M in 2004, the mussel industry represents approximately 1% of
the GDP (0.9%).
17Table 8 - Gross Domestic Product at Market Price
(million $)
PEI
Direct $14.9
Indirect $14.7
Induced $6.7
Total $36.3
Government Tax Revenues
In Tables 9 and 10, we present our estimates of the federal and provincial
governments’ tax revenues generated from the activities of the mussels processing
sector. The federal government receives nearly 4 million dollars in revenues as a
result (direct, indirect and induced) of the presence of the sector. The provincial
government, for its part, receives 3.5 million dollars.
Table 9 - Federal Government Tax Revenues (million $)
PEI
Direct $1.5
Indirect $1.3
Induced $1.2
Total $3.9
Table 10 - Provincial Government Tax Revenues
(million $)
PEI
Direct $1.2
Indirect $0.9
Induced $1.4
Total $3.5
Summary
To conclude, we have found that the mussel processing sector generated a total of
more than 106 million dollars in sales, the equivalent of 622 person-years of
employment, a contribution of more than 36 million dollars to the province’s gross
domestic product, nearly 4 million dollars in revenues for the federal government and
3.5 million dollars in revenues for the provincial government (see Table 11).
18Table 11 - Summary of Results – Total Impact
PEI
Gross Production (Sales) or Expenditure Generated $106.7
(million $)
Employment in Person-Years 622.2
Gross Domestic Product at Market Price (million $) $36.3
Federal Government Tax Revenues $3.9
(million $)
Provincial Government Tax Revenues $3.5
(million $)
Aquatic Invasive Species: Tunicates10
Historical background of tunicate species in PEI waters
Four species of tunicates have been identified in PEI waters. The Clubbed tunicate
(Styela clava) was the first invasive tunicate species identified in PEI waters in 1998.
More recently, the colonial tunicates; Violet tunicate (Botrylloides violaceus) and
Golden Star (Botryllus schlosseri) have been observed, as well as the solitary
tunicate, Vase tunicate (Ciona intestinalis). All species have the potential to become
pests in the marine environment and to the fishing and aquaculture industries.
The distribution of each species is presently limited to certain areas on PEI.
Although it is likely these species will eventually spread to other areas by natural
means, areas could be affected sooner by organisms being accidentally transported
by the hulls of barges, fishing boats, recreational craft, cruise and cargo ships, bilge
water and possibly through the transfer of seed and/or other stocks from one area to
another.
Types of tunicates
Solitary tunicates
Clubbed tunicate
The clubbed tunicate was first found in PEI in the Brudenell River in 1998. It is a
cylindrical body that can reach lengths up to 15 centimeters (six inches) long. It
attaches by means of a thin stock which protrudes from one end. It has a warty
surface with mottled color. The smaller clubbed tunicates appear as miniature
versions of the large ones with a smoother surface. It is typically found in dense
clumps growing on substrate below the low water level such as docks, buoys, hulls
of boats, etc.
10
Source: Prince Edward Island Department of Agriculture, Fisheries and Aquaculture and
Department of Fisheries and Oceans.
19The clubbed tunicate can live for several days out of the water. The spawning period
for the clubbed tunicate in PEI waters is from the middle of June to the middle of
October. The adults can spawn and the offspring can potentially infest substrate
within a period of a few days.
Vase tunicate
The vase tunicate was first found in PEI in October 2004 in Montague River growing
on mussel aquaculture gear. It has a soft cylindrical body with a smooth transparent
surface, and can reach lengths of up to 15 centimeters (six inches). There is often a
red area inside the tunicate which makes them easier to identify.
The vase tunicate attaches to and fouls the shells of invertebrates, shellfish gear,
hulls of boats and other floating structures, making them very difficult to clean. This
tunicate has caused severe difficulties to mussel growers and processors in Nova
Scotia and is a great concern to the aquaculture industry on Prince Edward Island.
Effectively it has forced them to a fall to spring window for processing as it seems the
Vase tunicate gums up the processing equipment in warmer summer months.
Colonial tunicates
The violet and golden star tunicates, unlike the solitary clubbed or vase tunicate, are
colonial and considered a greater fouling challenge to the mussel industry. They not
only reproduce sexually, spreading larvae through the water column, but they also
bud or fragment, producing new colonies which drift and may spread the tunicate
further into the estuaries.
Violet tunicate
The violet tunicate was first found in PEI during the summer of 2004 in Savage
Harbour. It is a colonial tunicate that grows like a mat over the substrate on which it
is growing. The sizes of the colonies are only limited by the space provided to them
by the substrate. It has several different color variations that vary from tan to bright
orange. It has an obvious ridge of track-like pattern through the colony.
The violet tunicate attaches to and fouls the shells of invertebrates, shellfish gear,
hulls of boats, floating structures and marine plants including eel grass. Small pieces
of colony can easily be transported on pieces of plant material within a body of water,
or to new bodies of water by natural means, or inadvertently by water users.
Golden Star tunicate
The golden star tunicate was first found in PEI in 2001 in St. Peter’s Bay. It is also a
colonial tunicate that grows like a mat over the surface of the substrate on which it is
growing and which the sizes of the colonies are only limited by the space provided to
them by the substrate. It is dark in color with a lighter star shaped pattern.
The golden star tunicate can attach to and fouls the shells of invertebrates, shellfish
gear, hulls of boats and other floating structures, making them very difficult to clean.
The colonies are generally easy to pull off the substrate which increases their
potential to spread.
20Establishment factors
Tunicates have been very successful at establishing in new areas worldwide.
Their general success can be attributed to several factors.
1. Rapid growth and early maturation.
2. Frequent spawning activity (every 24 hours or so).
3. Long reproductive season on PEI, from mid-June to early October.
4. Artificial structures such as mussel lines, provide an excellent attachment and
grow out substrate.
5. Tunicates have little or no natural predators that we know of in PEI.
Several treatment agents have been tested on tunicate colonies at various
concentrations, vinegar (5% acetic acid, household strength) has proven to be the
most effective to date.
Distribution of tunicates
Figures 6 to 9 show the location of each specie of tunicate on Prince Edward Island,
however, the spread of the species changes regularly. As of January 13, 2006, their
presence has been confirmed in the following locations:
The Clubbed tunicate is in Murray River, Brudenell River, Cardigan River, Montague
River, St. Mary’s Bay, Orwell/Vernon, March Water (Malpeque Bay), and Darnley
Basin.
FIGURE 6 – Clubbed Tunicate
(As of January 2006)
March Water
Darnley
Basin
Cardigan River
Brudenell River
Montague River
St. Marys Bay
Orwell/Vernon
Murray River
21The Vase tunicate is in the Montague River, Brudenell River, and St. Mary’s Bay.
F IG U R E 7 – V a s e T u n ic a te
(A s o f J a n u a ry 2 0 0 6 )
B ru d e n e ll R iv e r
M o n ta g u e R iv e r
S t. M a r y s B a y
The Violet tunicate is in Savage Harbour, Port Borden area, Rustico Bay (Hunter
River), Cardigan, St. Peter’s Bay, March Water, Brudenell River.
F IG U R E 8 – V io le t T u n ic a te
(A s o f J a n u a ry 2 0 0 6 )
M a rc h W a t e r Savage
H a rb o u r
R u s tic o B a y
S t. P e t e rs
Bay
P o rt B o rd e n
C a rd ig a n B a y
B ru d e n e ll R iv e r
22The Golden Star tunicate is in Savage Harbour, St. Peter’s Bay, Cardigan Bay,
St. Mary’s Bay.
F IG U R E 9 – G o ld e n S ta r T u n ic a te
(A s o f J a n u a ry 2 0 0 6 )
S t. P e te rs B a y
Savage
H a rb o u r
C a rd ig a n B a y
S t. M a r y s B a y
23The following seed and mussel growing areas remain “clean”/tunicate-free:
Boughton River, Souris River, Hillsborough Bay, (Nine Mile Creek), South Lake,
North Lake, Malpeque Bay, Covehead Bay, New London Bay, and Cascumpec.
Effects of tunicates on the mussel industry
• Higher maintenance costs for growers, as socks need to be treated or sprayed.
• More labour-intensive to harvest mussels (heavier).
• Additional trucking costs (larger volumes).
• More labour intensive to clean mussels before processing.
• More labour intensive to clean vessels, tanks, ropes, buoys etc.
• Additional costs to install screening systems in plant's water lines to control
effluents.
• Clutters or gums up the plant's processing equipment.
• Tunicates may significantly impact the ability of the industry to collect mussel
seed (fouling of seed collectors).
• Additional costs to processing plants for waste disposal.
• Affects employee morale - much more demanding on employees to harvest and
process tunicate - infested mussels (dirty, slimy and difficult to handle).
• Tunicates are cutting into the growers and processors profit margins.
Presently, there is no evidence that invasive tunicates have a significant impact on
the growth period or the meat yields of mussels. In some bays of PEI, the production
capacity has reached its optimal level. Stakeholders are concerned that the arrival of
invasive tunicates will have an impact on the growth period and meat yields of
mussels grown in these bays. Invasive tunicates could prevent many of these bays
from ever attaining their optimal production capacity.
24Conclusion
The development of the blue mussel (Mytilus edulis) industry during the last decade
could easily be termed a success story for Prince Edward Island. This industry has
grown from a production of 9.2 million pounds in 1992 to 40 million pounds of
mussels in 2004. The Prince Edward Island mussel industry accounts for 80% of the
blue mussels consumed in North America.
The method of culture and the price received by growers for their mussels has
remained relatively unchanged in the last 10 years. However, for the processing
sector, during the last few years, more emphasis has been directed towards value
added products.
With 123 growers operating 291 leases and 8 processing companies (with most of
them also holding leases), the industry has become a vital sector of the Island’s
economy creating directly and indirectly the equivalent of 622 full-time jobs and
generating sales of $107 million in 2004. In terms of the contribution to the Gross
Domestic Product (GDP) of the province, the mussel industry accounted for $36.3
million in 2004.
The arrival of aquatic invasive species certainly represents a huge challenge for the
industry. When the first clubbed tunicate showed up in 1998, growers and
processors were able to adjust and cope with this invasive specie. The subsequent
arrival of three other types of tunicates in recent years has created additional
challenges for growers, processors, biologists and stakeholders involved in this
industry. What will be the economic impact of these new types of tunicates is surely
one of the biggest concerns of the industry.
25You can also read