U.S. REAL ESTATE DEBT INVESTMENTS - Capabilities Overview - texpers
←
→
Page content transcription
If your browser does not render page correctly, please read the page content below

U.S. REAL ESTATE DEBT INVESTMENTS
Capabilities Overview

This is a strategy concept and not a finalized product. A decision to invest should only be m ade after reading the final strategy documentation and conducting in-depth
and independent due diligence. No guarantee can be given that the concept will be realized at all or as presented herein. There is NO TYPICAL offering document that
should be referenced for this concept

Confidential—Not for Public Distribution. For Institutional investors only. For distribution to Qualified Institutional Buyers Only

CONTENTS
Real Estate Debt Overview

01   Firm and Platform Overview

02   Why Real Estate Debt

03   The Market Opportunity

04    DWS: Accessing the Asset Class

05   Agency CMBS Credit Bonds (Freddie K Series)

06   Appendices

EXECUTIVE SUMMARY
Real estate and credit experience to evaluate private real estate debt and
real estate debt securities across credit risk spectrum
Firm & Platform DWS: A diversified global asset management firm with a $62.4 billion global real estate business and a $386 billion global fixed
income business
45 year investment heritage in private real estate equity and debt, with more than $23.7 billion in AUM today in the Americas
Executed $2.6 billion in real estate debt transactions since 1998, including more than $1.5 billion since 2010 on behalf of
separate accounts in addition to over $4.7 billion in CMBS AUM managed on a fiduciary basis 1
The Market
Opportunity Regulatory constraints and tougher underwriting standards for banks have led to a funding gap
Transaction volumes indicate need for lending yet CMBS issuance is on the decline
Investment strategy focused on various investment categories designed to adjust risk over time adapting to market conditions
Benefits of Real
Estate Debt Relative value: Attractive current income vs. traditional fixed income and real estate equity
Portfolio diversification: Low correlation to other asset classes, including real estate equity
Principal preservation: Through significant equity cushion and other credit enhancements/loan structuring
DWS Competitive Leveraging the bricks & mortar real estate expertise of broad global platform including origination, underwriting and asset
Advantage management for real estate debt
In house proprietary trading and research for private real estate debt and real estate debt securities
Benefiting from the team’s real estate and credit experience to evaluate private real estate debt and real estate debt securities
across the risk spectrum
(1) As of January 31, 2019.
An investment in real estate debt involves high degree of risk, including possible loss of principal amount invested, and is suitable only for sophisticated investor who can bear such
losses. Forecasts are based on assumptions, estimates, opinions and hypothetical models or analysis w hich may prove to be incorrect. No assurance can be made that investment
objectives w ill be met. Source: DWS. As of December 31, 2018.
U.S. Real Estate Debt Investments: Capabilities Overview /3
01

FIRM AND PLATFORM OVERVIEW

01      FIRM AND PLATFORM OVERVIEW

DWS
One of the world’s leading investment organizations

ASSETS UNDER MANAGEMENT                                                                     GLOBAL INSTITUTIONAL AUM

 $758B1                                                                                     $416B

                                                                                            Institutional client segments
                                                                                            ($’s in billions)
         Active Fixed Income                                                  34%

                         Passive                           17%                                                                     $160

                                                                                                             $1
                  Active Equity                      12%                                                                                                    $61
                                                                                                              $2
                                                                                                           $10
                    Alternatives                     12%                                                                $12
                                                                                                                           $28                        $57
  Systematic & Quantitative                                                                                                      $29
                                                 9%
        Investments                                                                                                                       $55

                            Cash                 9%

                                                                                              Insurance2        Corporate Treasury           Private Pensions 4
                     Multi-Asset               7%                                            Financial Institutions 3        Sovereign Wealth Funds/Central Banks/Supranationals
                                                                                              Public Pensions           Not-for-profit    DB Distribution         Taft Hartley
                                   0%         10%         20%        30%         40%
(1) AUM represents DWS global assets under management.
(2) $48.0B of Unit Linked AUM not included.
(3) Includes banks, insurance, asset managers, family offices and other securities firms.
(4) Includes $0.8B of Insurance and $2.7B of Not-for-profit assets.
Source: DWS as of December 31, 2018.

U.S. Real Estate Debt Investments: Capabilities Overview                                                                                                                         /5
01 FIRM AND PLATFORM OVERVIEW
GLOBAL REAL ESTATE BUSINESS
Long tenured manager of real estate assets across the private and public
investment spectrum and around the globe
GLOBAL FOOTPRINT AND AUM (BILLIONS) REAL ESTATE BUSINESS AT A GLANCE
We seek to provide real estate investment management
services consistent with our clients' objectives for
diversification, preservation of capital and attractive long-term
risk-adjusted performance.
A 45-year investment heritage
More than 450 employees in 27 locations worldwide
$62.4/€54.5 billion in assets under management
558 institutional clients
13% Investors represent more than 25 countries globally
5%
38% Closed $12.0/€10.2 billion in transactions globally over the last 12
Total: months
$62.4 bn
44%
Private RE: Americas $23.7 bn
Private RE: Europe $27.8 bn
Private RE: Asia Pacific $2.9 bn
Public RE: Global $7.9 bn
Numbers may not sum due to rounding. There is no guarantee the investment objective can be achieved. AUM is based on investment region. Past performance is not indicative of
future results. Source: DWS. As of December 31, 2018.
U.S. Real Estate Debt Investments: Capabilities Overview /6
01      FIRM AND PLATFORM OVERVIEW

PRIVATE REAL ESTATE — AMERICAS
Overview

AT A GLANCE
                                                                                              AMERICAS OFFICE LOCATIONS
− $23.7 billion in U.S. private real estate AUM1
− Approximately 300 institutional clients, including public, corporate,
  insurance, union and foundations/endowments
− Long tenured senior professionals averaging 16 years with the firm                          United States
  and 29 years of industry experience
                                                                                              — Chicago                 — Costa Mesa
− 132 professionals and staff in nine offices
                                                                                              — New York                — Dallas
− Dedicated teams closed more than $48.0 billion in purchase and
  sales transactions since 2007                                                               — San Francisco           — Seattle
− Regional asset management organization with more than 25 asset                              — Atlanta                 — Washington,
  managers                                                                                    — Boston                    D.C.

REAL ESTATE DEBT2
                                                                                              PROPERTY DIVERSIFICATION BY SECTOR & REGION
— Since 1998, DWS has managed approximately $2.6 billion of real                                               By Sector                                    By Region
  estate debt in three debt funds and separately managed accounts.                                               2%
— The approximately $2.6 billion of investments made, since 1998,                                                            18%                                           28%
                                                                                                        18%
  consists of 72 individual loans with an average loan size of ~$40mm.
                                                                                                                                                  47%
KEY DISTINCTIONS

— Four decades of experience in U.S. markets                                                                                       26%                                       8%

— Seasoned local teams and hands-on approach                                                          36%                                                                 1%
                                                                                                                                                                   16%
— Industry thought leadership through Research & Strategy team                                      Apartments             Industrial            East                 Midwest
— Long-term outperformance for real estate equity and debt                                          Office                 Retail                Non-US Total         South
                                                                                                    Other                                        West
(1) AUM is based on asset location. (2) As of January 31, 2019. Includes multiple real estate investment styles and the U.S. Portion of global accounts. Excludes real estate securities.
Data is for real estate located in the U.S. Numbers may not sum due to rounding. Diversification based on gross asset value by primary use. Allocations are subject to change.
Allocations may not sum to 100% due to rounding. Past performance is not indicative of future results. Source: DWS. As of December 31, 2018.

U.S. Real Estate Debt Investments: Capabilities Overview                                                                                                                              /7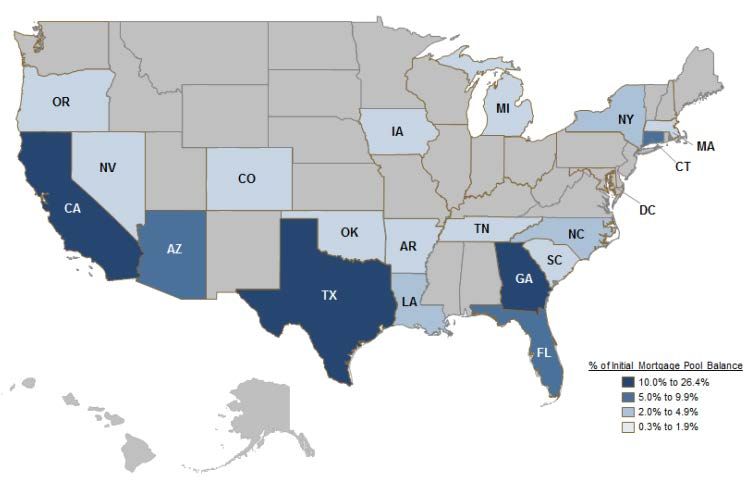
02

WHY REAL ESTATE DEBT
02      WHY REAL ESTATE DEBT

REAL ESTATE DEBT
Overview

− Commercial Real Estate (“CRE”) loans provide
  financing on real estate acquisitions, refinancing
  and recapitalizations, from core properties to
  development projects, across all sectors

− Depending on the risk profile of the loan, CRE debt
  is generally secured by well-located office, retail,
  industrial, multifamily and hospitality properties

− Investment sizes typically range from $5 million to
  $100+ million, with a duration generally between
  3 - 10 years

− Borrowers of CRE debt include institutional real
  estate owners, operators and developers, REITs,
  and private investors

− Lenders access the market via direct borrower
  relationships, banks and insurance companies, co-
  lenders, brokers and other market participants.

For illustrative purposes only.

U.S. Real Estate Debt Investments: Capabilities Overview   /9
02      WHY REAL ESTATE DEBT

REAL ESTATE DEBT
Evergreen opportunity

  − Attractive risk-adjusted returns throughout the full cycle

  − Stable income

  − Low historical volatility

  − Limited risk: Higher recoveries in the event of default

  − Portfolio diversification (non-correlated to most other asset classes)

  − Flexibility in targeting short, medium, or long duration assets and
    loan type/structuring

The photograph depicted above is for illustrative purposes only and is not reflective on any DWS investment or portfolio position.

U.S. Real Estate Debt Investments: Capabilities Overview                                                                             / 10
02 WHY REAL ESTATE DEBT ATTRACTIVE RETURNS Real Estate Private Debt provides attractive total and income returns versus other asset classes AVERAGE ANNUAL RETURNS: TOTAL RETURN VS. INCOME RETURN 2010 through 2018 Sources: NCREIF Property Index (Real Estate Private Equity); Giliberto-Levy High Yield Real Estate Debt Index (High Yield Real Estate Private Debt); Giliberto-Levy Commercial Mortgage Performance Index (Real Estate Private Debt); Bloomberg/Barclays U.S. Aggregate Bond Total Return Index (U.S. Bonds); S&P 500 Total Return Index (U.S. Equity). Past performance is not an indicator of future results. As of December 2018. U.S. Real Estate Debt Investments: Capabilities Overview / 11
02      WHY REAL ESTATE DEBT

ATTRACTIVE RETURNS
Real Estate Private Debt provides the potential for attractive risk-adjusted
returns

                                                                                                                        Real Estate Private Debt
                                                                                                                       returns compare favorably
                                                                                                                      against U.S. High Yield Bonds
                                                                                                                       and Leveraged Loans, with
                                                                                                                          substantially less risk

                                                                                                                           2010 - 2018
                                                                                                                                                    TOTAL         STANDARD
                                                                                                                                                   RETURN         DEVIATION
                                                                                                                    U.S. Bonds                       3.2%             3.1%

                                                                                                                    U.S. High Yield Bonds            6.8%             6.1%

                                                                                                                    Leveraged Loans                  4.6%             3.8%

                                                                                                                    CMBS                             6.0%             4.4%
                                                                                                                    Real Estate Private
                                                                                                                                                     5.1%             2.7%
                                                                                                                    Debt
                                                                                                                    High Yield Real
                                                                                                                                                     9.3%             2.9%
                                                                                                                    Estate Private Debt

Sources: Giliberto-Levy Commercial Mortgage Performance Index (Real Estate Private Debt); Giliberto-Levy High Yield Real Estate Debt Index (High Yield Real Estate Private Debt);
S&P/LTSA Leveraged Loan Index (Leveraged Loans); Bloomberg/Barclays U.S. Aggregate Bond Total Return Index (U.S. Bonds); Bloomberg/Barclays U.S. Corporate High Yield
Total Return Index (U.S. High Yield Bonds); Bloomberg/Barclays Investment Grade Non-Agency CMBS Total Return Index (CMBS).
Past performance is not an indicator of future results. For illustrative purposes only. As of December 2018.

U.S. Real Estate Debt Investments: Capabilities Overview                                                                                                                       / 12
02 WHY REAL ESTATE DEBT
STABLE INCOME OVER THE LONG TERM
In the last 40+ years, Real Estate Private Debt has experienced only 2 down
years of annual total return, while income returns have remained stable
GILIBERTO-LEVY COMMERCIAL MORTGAGE PERFORMANCE INDEX ANNUAL RETURN
1972 - 2018
Average Annual Total Return: 8.0%
Standard Deviation: 6.2%
Source: The Giliberto-Levy Commercial Mortgage Performance Index (“G-L Index” or “GLCMPI”) measures the investment performance of select private-market investments in
commercial real estate debt. Specifically, the Index tracks fixed-rate, fixed-term senior loans that are made by and held in the investment portfolios (“on balance sheet”) of institutional
lenders such as life insurance companies and pension funds. Past performance is not an indicator of future results. As of December 2018.
U.S. Real Estate Debt Investments: Capabilities Overview / 1302 WHY REAL ESTATE DEBT LOWER VOLATILITY Real Estate Private Debt exhibits significantly less volatility over market cycles vs. Mortgage REITs and Leveraged Loans ANNUAL TOTAL RETURNS 1999 – 2018 Sources: Giliberto-Levy Commercial Mortgage Performance Index (Real Estate Private Debt); FTSE/NAREIT Mortgage REIT Index (Mortgage REITs); S&P/LTSA Leveraged Loan Index (Leveraged Loans); Bloomberg/Barclays U.S. Aggregate Bond Total Return Index (U.S. Bonds). Past performance is not an indicator of future results. As of December 2018. U.S. Real Estate Debt Investments: Capabilities Overview / 14
02     WHY REAL ESTATE DEBT

REAL ESTATE INVESTING THROUGH CYCLES
Real Estate Private Equity and Real Estate Private Debt are uncorrelated

ASSET CLASS TOTAL RETURN CORRELATIONS
1999 – 2018

                      RE Private RE Private                    Mortgage                                   World          U.S.        World
                                                     REITs                     CMBS      U.S. Bonds                                              U.S. 10-Yr    U.S. GDP
                        Equity     Debt                         REITs                                     Bonds         Equity       Equity

RE Private Equity         1.00

RE Private Debt           -0.01         1.00

REITs                     0.26          0.46          1.00

Mortgage REITs            -0.17         0.44          0.53        1.00

CMBS                      -0.03         0.83          0.71        0.50          1.00

U.S. Bonds                -0.18         0.73          0.15        0.38          0.52         1.00

World Bonds               -0.13         0.46          0.14        0.27          0.38         0.59          1.00

U.S. Equity               0.27          -0.14         0.54        0.03          0.27         -0.47         -0.11         1.00

World Equity              0.25          -0.12         0.56        0.02          0.27         -0.44         0.00          0.96         1.00

U.S. 10-Yr                -0.07         -0.28         0.14        -0.02        -0.02         -0.68         -0.36         0.56         0.60          1.00

U.S. GDP                  0.67          0.11          0.44        -0.07         0.22         -0.25         -0.12         0.58         0.57          0.22          1.00

Sources: Giliberto-Levy Commercial Mortgage Performance Index (RE Private Debt); Bloomberg/Barclays Non-Agency CMBS Total Return Index (CMBS); FTSE/NAREIT Mortgage
REITS Total Return Index (Mortgage REITs); NCREIF Property Index (RE Private Equity); FTSE/NAREIT All Equity REIT Total Return Index (REITs); Bloomberg/Barclays U.S.
Aggregate Bond Total Return Index (U.S. Bonds); Bloomberg/Barclays Global Aggregate Total Return Index (World Bonds); S&P 500 Total Return Index (U.S. Equity); MSCI All
Country World Total Return Index (World Equity); The Federal Reserve (U.S. 10-Yr); U.S. Bureau of Economic Analysis (U.S. GDP); DWS. As of December 2018.
Note: Correlations calculated using quarterly annualized returns. Past performance is not a guide to future results.

U.S. Real Estate Debt Investments: Capabilities Overview                                                                                                                 / 15
03 THE MARKET OPPORTUNITY
03

THE MARKET OPPORTUNITY
EVOLUTION OF THE CRE DEBT MARKET
New regulation has reduced risk tolerance for traditional lenders and
opened the market for private lenders
REAL ESTATE DEBT OUTSTANDING
Percent of total debt outstanding
Lending Trends:
+ Other: REITs,
Private Lenders
- Banks & Life
Companies
- CMBS
Sources: U.S. Board of Governors of the Federal Reserve System (FRB); Moody’s Analytics; DWS. As of December 2018.
U.S. Real Estate Debt Investments: Capabilities Overview / 1703 THE MARKET OPPORTUNITY
MARKET OPPORTUNITY
Transaction volumes indicate need for lending yet CMBS issuances on
the decline
COMMERCIAL PROPERTY TRANSACTIONS CMBS ISSUANCE
Billions of dollars per quarter Billions of dollars
60+%
$150+ billion
lending gap
Demand for Real Estate Debt Supplier of Real Estate Debt
Past performance is not an indicator of future results.
Sources: Real Capital Analytics (Transaction Volume); Commercial Real Estate Finance Council (CMBS Issuance); DWS. As of December 2018.
U.S. Real Estate Debt Investments: Capabilities Overview / 1803 THE MARKET OPPORTUNITY
ALTERNATIVE LENDERS
Gaining ground in the $4 trillion lending market
COMMERCIAL MORTGAGE DEBT OUTSTANDING
Billions of dollars
− Mortgage REITs and other private
lending sources have taken advantage
of the opportunity, now accounting for
approximately 9% of a $4+ trillion Real
Estate Debt market
− From 2013 - 2018 alone, the “Other”
lending segment has grown by over
57%
Source: U.S. Board of Governors of the Federal Reserve System (FRB); Moody’s Analytics; DWS. As of December 2018.
U.S. Real Estate Debt Investments: Capabilities Overview / 1903 THE MARKET OPPORTUNITY LOOKING AHEAD Market indicators are positive LOAN DELINQUENCY RATES AT HISTORICALLY LOWS MORTGAGE GROWTH CONSISTENT WITH LONG-TERM AVERAGE LOAN-TO-VALUE RATIOS BELOW LONG-TERM AVERAGE MODERATE NOI GROWTH ACROSS ALL REAL ESTATE SECTORS For illustrative purposes only. Past performance is not an indication of future results. Sources: Federal Reserve (Loan Delinquency Rates and Mortgage Grow th); Real Capital Analytics (Loan-to-Value Ratio); NCREIF (NOI Grow th). As of December 2018. U.S. Real Estate Debt Investments: Capabilities Overview / 20
04

DWS REAL ESTATE DEBT
Accessing the Asset Class
04      DWS REAL ESTATE DEBT

U.S. REAL ESTATE DEBT
Overview

− Since 1998, DWS has managed approximately $2.6 billion of real estate debt investments in three debt funds and separately managed accounts.
− The approximately $2.6 billion of investments made, since 1998, consists of 72 individual loans with an average loan size of ~$40mm.
− Currently, the platform has approximately $1.100 billion of debt and debt-type1 assets under management on behalf of separately managed
  accounts with all loans performing as agreed with zero loss experience.

PRIVATE REAL ESTATE PORTFOLIO BY PROPERTY TYPE                                               PRIVATE REAL ESTATE PORTFOLIO BY RISK TYPE

                                                  18%                                                                       14%

             38%                                                8%
                                                                                                             18%
                                     Total                                                                                          Total                    50%
                                    $1.100 B                                                                                      $1.100 B

                                                         36%                                                     18%

                                                                                                        Low Risk Loans                               Medium Risk Loans
                    Multifamily        Hotel       Retail      Office                                   (75% LTV)                                   (65-75% LTV)
(1) Debt-type transactions are similar to debt, but no assurance for the repayment of principal in the equity component can be made, and no assurance can be made this objective w ill
be achieved. Investments are subject to loss, including the loss of total capital invested.
Note: Attachment points range from 0%-68% from loan proceeds. Detachment points range from 50%-85%.
Source: DWS. Past performance is not indicative of future results. As of January 31, 2019.

U.S. Real Estate Debt Investments: Capabilities Overview                                                                                                                          / 22
04 DWS REAL ESTATE DEBT
INVESTMENT TEAM
Over 150 investment professionals dedicated to the Americas real estate debt, credit and equity
business
− Senior team members average 27 years of real estate debt experience
− 6 dedicated investment professionals focused on private real estate debt and real estate debt securities
Investment Team
Marc Feliciano Joe Rado Patrick Kennelly Jordan Pratzel Jennifer Carey Robin Kim
Managing Director Director Director Vice President Associate Associate
Head of Debt Loan Asset Management Sourcing & Origination Underw riting Asset Management Underw riting & Asset
Management
14 26 13 39 1 13 10 14 5 5 1 4
Americas Real Estate Investment Committee
Pierre Cherki Todd Henderson Marc Feliciano Tim Ellsw orth Andy Harper Mike Nigro Mark Roberts Kevin White
Head of Head of Real CIO, Head of Real Head of Transactions Head of Real Head of Research Head of Strategy,
Alternatives Estate, Americas Estate Debt Transactions, Estate Value-Add & Strategy Americas
Americas
21 23 15 27 14 26 21 36 18 21 14 22 8 34 4 15
Broader U.S. Resources 1
RE Asset RE Portfolio Global Client Real Assets Research Structured Finance
RE Transactions Operations
Management Management Group & Strategy Trading & Research
18 employees 19 employees
35 employees 58 employees 12 employees 11 employees 4 employees
(1) As of December 31, 2017 (latest available).
Source: DWS. Years with firm/industry as of December 31, 2018. Years with firm # Years with industry #
U.S. Real Estate Debt Investments: Capabilities Overview / 2304 DWS REAL ESTATE DEBT
REAL ESTATE DEBT SEPARATE ACCOUNTS
− All loans below (realized and unrealized) were made on behalf of separately managed accounts and are performing in-line with target objectives
− By risk type for all loans below, 50% of the loans are low risk loans, 18% are moderate risk loans, and 18% are higher risk loans, and 14% are Freddie
− By property type for all unrealized loans below, 38% are office, 36% are retail, 8% are hospitality and 18% are multi-family
REAL ESTATE DEBT INVESTMENTS: 2010 – PRESENT (SEPARATE ACCOUNT INVESTMENTS)
Property Type Loan to Value Total Investment Gross Target Gross Realized Vintage Year Realized Year
Size (000’s) IRR IRR
Realized 1 Retail 47% $17,500 9.75% 10.75% 2010 2015
Realized 2 Retail 42% $290,000 9.00% 9.00% 2012 2016
Realized 3 Retail 68% $32,000 9.75% 9.75% 2013 2017
Realized 4 Office/Retail 68% $29,000 8.67% 8.80% 2015 2018
Realized 5 Office/Retail 52% $39,000 9.75% 9.87% 2015 2018
Unrealized 1 Office 80% $40,000 9.75% N/A 2014 N/A
Unrealized 2 Multifamily 78% $42,500 8.16% N/A 2016 N/A
Unrealized 3 Retail 50% $355,328 5.72% N/A 2016 N/A
Unrealized 4 Lodging 60% $90,000 4.51% N/A 2016 N/A
Unrealized 5 Office 52% $195,000 5.63% N/A 2016 N/A
Unrealized 6 Office 67% $75,000 6.53% N/A 2016 N/A
Unrealized 7 Office 85% $48,800 7.82% N/A 2016 N/A
Unrealized 8 Office 78% $62,500 7.26% N/A 2018 N/A
Unrealized 9 Multifamily 68% $100,393 8.58% N/A 2018 N/A
Unrealized 10 Retail 60% $39,000 8.60% N/A 2018 N/A
Unrealized 11 Multifamily 68% $58,088 9.10% N/A 2019 N/A
Total $1,514,109
Past performance is not indicative of future results. Gross performance is gross of fees and actual returns earned by an investor w ill be reduced by advisory fees and other expenses.
Please see “Important Information” for details regarding the effect of fees on performance. There is no guarantee that target returns and investment objectives w ill be achieved.
Investments are subject to risk, including possible loss of invested capital.
U.S. Real Estate Debt Investments: Capabilities Overview / 2404 DWS REAL ESTATE DEBT
DWS INVESTMENT PROCESS1
Debt origination, underwriting and management
Step 1
Transaction origination
and Initial review
− Access to broad integrated DWS networks and extensive relationships to
generate robust opportunities
Step 2
Transaction evaluation
and Deal Allocation − Strong, disciplined underwriting standards, processes and formalized rotation
allocation policy
− Seasoned Investment Committee with broad expertise focused on risk control
Step 3
Transaction approval
Step 4
Execution and closing − Extensive background in loan structuring and certainty of execution
Step 5
Active management − In house active asset management designed to identify and mitigate risks early
Step 6 − All loans made on behalf of separately managed accounts in-line with target objectives
Realized returns
(1) Subject to applicable regulations and DB internal policies and procedures.
The data presented herein is as of December 31, 2018, unless noted otherw ise, and is accurate only as of such date. Please refer to “Important Information” for additional information.
Certain significant risks include, but are not limited to, lack of liquidity, changes in national or local economic or market conditions and real estate risks such as the effect of bankruptcy,
the cyclical nature of the real estate market, the financial condition of tenants, buyers and sellers of properties, changes in supply of, or demand for, properties in an area, fluctuations
in lease rates, changes in interest rates and in the availability, cost and terms of financing, promulgation and enforcement of governmental regulations, including rules relating to
zoning, land use and environmental protection, changes in real estate tax rates, energy prices and other operating expenses, risks due to leverage and dependence on cash flow .
Past performance is not indicative of future results. There is no guarantee that target returns and investment objectives w ill be achieved. Source: DWS.
U.S. Real Estate Debt Investments: Capabilities Overview / 2504 DWS REAL ESTATE DEBT
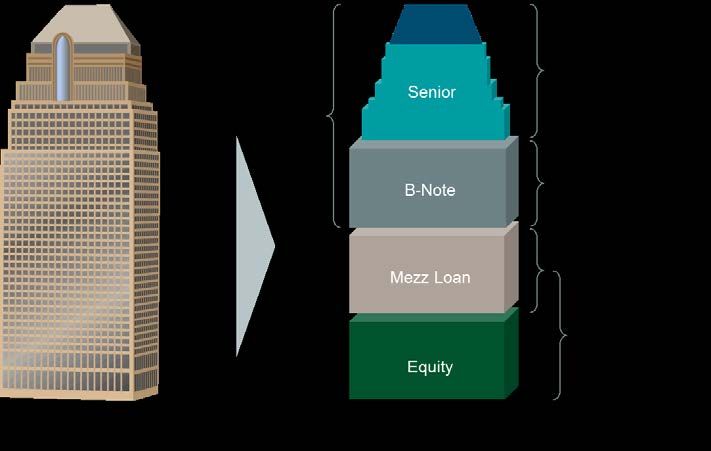
DEBT RATE RANGES
Senior Mortgage Loans and Mezzanine Loans
INTEREST RATE RANGES
7.50 – 14.00%
8.50 – 10.00%
6.00 – 8.00%
7.34 – 7.82%
5.00 – 6.00%
4.00 – 5.50%
4.34 – 4.75% 3.50 – 4.50%
3.25 – 4.25%
2.90 – 4.00%
2.89% 2.98% 3.06%
2.31%
1-Month 5 Yr UST 7 Yr UST 10 Yr UST US BBB 5 Yr Senior 7 Yr Senior 10 Yr Senior Whole Loan Mezzanine, US B Corp. Mezzanine, Freddie Mac Mezzanine,
LIBOR Corp. Bonds (~75% LTV) Lower Risk / Bonds (7-10 Moderate K Deals Higher Risk
(7-10 Yr) B-Note (LTV Yr) Risk (LTV (LTV 75%+)04 DWS REAL ESTATE DEBT
TARGET MARKETS
West Coast and Florida expected to outperform
Minneapolis
Seattle
Boston
Chicago
Portland
New Y ork
Philadelphia/Central PA
Oakland
San Francisco Baltimore
Denv er
Washington DC
San Jose
Nashv ille
Raleigh
Los Angeles
Phoenix
Atlanta
Dallas
Charlotte
Riv erside
San Diego Austin
Orange County Houston Orlando
Tampa
West Palm Beach
Ft. Lauderdale
Miami
Apartment Industrial Office Retail
House View
Red denotes “underw eight”; green denotes “overweight; orange denotes “market w eight”. Opinions and estimates, including forecasts of conditions, involve a number of assumptions
that may not prove valid and are subject to change. No representation or w arranty is made that any portfolio or investment described herein w ould yield favorable investment results.
Source: DWS. As of December 2018. Past performance is not indicative of future results. There is no guarantee that forecast will materialize. There can be no assurance that the
above targets can be achieved.
U.S. Real Estate Debt Investments: Capabilities Overview / 2704 DWS REAL ESTATE DEBT WHY DWS? Seasoned team dedicated to identifying value for our clients within the real estate capital stack − 45 years as an investment fiduciary − Benefiting from the team’s real estate and credit experience to evaluate private real estate debt and real estate debt securities across the risk spectrum − Leveraging the bricks & mortar real estate expertise of broad global platform with $62.4 billion in AUM and in-house credit expertise with $4.7 billion in AUM − Robust origination, underwriting, execution and asset management for real estate loans and structured credit − Proprietary real estate and CMBS research For illustrative purposes only. No assurance can be made investment objectives w ill be achieved. Source: DWS. As of December 31, 2018. U.S. Real Estate Debt Investments: Capabilities Overview / 28
05

    AGENCY CMBS CREDIT BONDS
    Freddie K Series

_ This is a strategy concept and not a finalized product. A decision to invest should only be made after reading the final strategy documentation and conducting in-depth and independent
  due diligence. No guarantee can be given that the concept w ill be realized at all or as presented herein.
05 AGENCY CMBS CREDIT BONDS
FREDDIE “K SERIES” B-PIECE STRATEGY
Investment Period TBD
Sponsor Freddie Mac
Category Agency CMBS (B-Piece)
Pool Size $1B to $1.5B
Expected Capital Deployment $50-$100 million (per holding)
Approximate Attach/Detach 65-70% LTV
Est. Current Coupon* 0.00%-10.00%
Est. Gross Total Return* 8.50%-10.00%
WAL 4-15yrs
*Returns displayed gross of fees on a pre-loss basis
Freddie Program Highlights:
Freddie K series is a securitization program of multi-family loans sponsored by Freddie Mac. In 2016, Freddie originated $57B in multi-family loans and $73B for FYE 2017.
Freddie Mac’s core mission is to provide liquidity, stability, and affordability to the U.S. Housing. In an effort to create liquidity in the multi-family space, the most senior
bonds (Class A) of the Freddie K Series Securitization (90% of the pool) are fully guaranteed by the US Government. The bottom of the pool (not guaranteed) is sold on a
non-competitive rotational basis to institutional investors that have been pre-screened by Freddie as an eligible controlling class shareholder.
Rental Demand Keeps Rising: U.S. Homeow nership Rate has dropped from 69% at the peak (2004/2005) to 64% as of 4Q17 creating significant new demand. Despite
new supply saturating certain markets, housing completions are still below long term average completions.
Credit Quality: average Freddie default rates since 1994 (25,586 loans) have been 23bps per year, peaking at 160bps in 2006 with zero defaults since 2011. Post-
Recession K series 60+ day delinquencies peaked at 36bps in 1Q11 compared to non-agency CMBS multi-family loans w hich exceeded 1,000bps delinquencies from
4Q09 through 4Q12.
Return Profile: Gross Unlevered returns in the B- Piece are expected to be 8.50%-10.00% on a pre-loss basis w ith 30-35% cushion vs. the underlying property values
compared to equity returns in B/B+ multi-family of 13-15% (0% cushion).
The above information is provided for illustrative purposes only and is not indicative of our investment experience as a w hole. We believe the above transaction is representative of
those in the market as of the date of this presentation that meet the proposed investment guidelines of the strategy, including location, size and return expectations. No assurance can
be made that after customary due diligence, similar investment opportunities w ill be available or form part of a future invested portfolio. Past performance is not indicative of future
returns. Performance show n is not indicative of total returns of any fund and does not reflect investment advisory fees. Had such fees been deducted, returns w ould have been low er.
Please refer to the end of this material for important information about the effect of fees on a portfolio. Sources: DWS and Multifamily Loan Performance Database (MLPD) is available
on FreddieMac.com. Quarterly performance information on Freddie Mac's loans w hich includes more than 25,586 loans and total origination UPB of over $323 billion that w ere
purchased by Freddie Mac from 1994 through the end of 2017 Q2. Of this reported population, approximately 0.23% has defaulted through the end of 2017 Q2. Past performance is
not indicative of future returns.
U.S. Real Estate Debt Investments: Capabilities Overview / 3005 AGENCY CMBS CREDIT BONDS HISTORIC DELINQUENCY RATES (vs. Comparable Multi-Family Loan Products) Freddie Mac does not report modif ied or f orbearance loans in delinquency rates if the borrower is less than two monthly payments past due. Fannie Mae reports f orbearance loans in their delinquency rates. Sources: Freddie Mac, Fannie Mae, American Council of Lif e Insurers (ACLI) Quarterly Inv estment Bulletin, FDIC Quarterly Banking Prof ile, TREPP (CMBS multif amily 60+ delinquency rate, excluding REOs) f or periods prior to 3Q17, Wells Fargo CMBS research f or 4Q17-3Q18 CMBS delinquency rates. U.S. Real Estate Debt Investments: Capabilities Overview / 31
05     AGENCY CMBS CREDIT BONDS

FREDDIE MAC HISTORIC DEFAULT RATES / LOSSES (BY VINTAGE)
                                     Average       Total                            Average         Average
                        Funded                                  Average                                           Total Defaulted Total Defaulted Realized Credit Realized Credit
Funding Year                       Origination  Origination                        Origination     Origination
                         Loans                              Origination LTV                                         UPB ($MM)        % ($MM)      Losses ($MM)      Loss As %
                                  Volume ($MM) Volume ($MM)                           DCR         Interest Rate
1994                        122        $3.6         $439          68%                 1.48x           9.0%               $0.8           0.18%             $0.5         0.11%
1995                        230         4.7        1,082          75%                 1.39x           8.5%                6.1           0.56%             (0.3)       -0.03%
1996                        377         3.6        1,349          73%                 1.42x           8.2%                0.0           0.00%              0.0         0.00%
1997                        325         5.1        1,651          73%                 1.52x           7.9%                8.6           0.52%             (2.9)       -0.18%
1998                        583         4.8        2,799          71%                 1.68x           6.9%                9.5           0.34%              5.1         0.18%
1999                        679         7.3        4,942          69%                 1.78x           7.2%               32.2           0.65%              7.5         0.15%
2000                        473         8.8        4,164          70%                 1.52x           8.0%               61.4           1.47%              9.2         0.22%
2001                        716         8.8        6,291          69%                 1.79x           7.0%               15.1           0.24%              8.8         0.14%
2002                        727         8.6        6,254          69%                 1.84x           6.4%               44.0           0.70%             12.1         0.19%
2003                        706         9.0        6,338          68%                 2.06x           5.3%                8.5           0.13%              4.6         0.07%
2004                        755        10.0        7,575          72%                 1.81x           5.0%               17.6           0.23%              5.8         0.08%
2005                        810        10.9        8,805          70%                 1.82x           5.3%                8.6           0.10%             (2.0)       -0.02%
2006                        941        12.2       11,465          67%                 1.70x           5.9%              183.3           1.60%             50.1         0.44%
2007                      1,364        13.2       18,034          68%                 1.57x           5.8%               93.8           0.52%             37.9         0.21%
2008                      1,353        13.0       17,548          68%                 1.61x           5.7%              242.1           1.38%             52.8         0.30%
2009                        929        16.0       14,836          69%                 1.74x           5.3%                7.9           0.05%              1.3         0.01%
2010                        850        15.2       12,891          69%                 1.65x           5.0%               14.2           0.11%              5.2         0.04%
2011                      1,167        15.9       18,555          69%                 1.70x           4.7%               12.6           0.07%              1.8         0.01%
2012                      1,481        17.5       25,947          68%                 1.95x           4.0%                0.0           0.00%              0.0         0.00%
2013                      1,396        17.5       24,403          67%                 1.97x           4.0%               18.8           0.08%              9.9         0.04%
2014                      1,523        17.0       25,936          69%                 2.12x           3.9%                0.0           0.00%              0.0         0.00%
2015                      3,314        12.9       42,856          70%                 2.06x           3.7%                0.0           0.00%              0.0         0.00%
2016                      4,035        12.8       51,551          70%                 2.00x           3.8%                0.0           0.00%              0.0         0.00%
2017                      5,000        12.6       62,992          69%                 1.85x           4.1%                0.0           0.00%              0.0         0.00%
2018 YTD                  1,077        13.3       14,308          69%                 1.82x           4.3%                0.0           0.00%              0.0         0.00%

Total / Wtd. Avg.        30,933      $12.7         $393,011            69%            1.87x            4.6%           $785.1             0.20%         $207.4           0.05%
 Subset: 1994-2005        6,503       $7.9          $51,689           70%             1.78x           6.3%            $212.4            0.41%           $48.4          0.09%
 Subset: 2006-2008        3,658      $12.9          $47,047           68%             1.62x           5.8%            $519.2            1.10%          $140.8          0.30%
 Subset: 2009-Current    20,772      $14.2         $294,275           69%             1.92x           4.1%             $53.5            0.02%           $18.2          0.01%

Past performance is not indicative of future returns.
Source: Multifamily Loan Performance Database (MLPD) is available on FreddieMac.com. Quarterly performance information on Freddie Mac's loans w hich includes more than
30,393 loans and total origination UPB of over $393 billion that w ere purchased by Freddie Mac from 1994 through the end of 2018 Q2. Of this reported population, approximately
0.20% has defaulted through the end of 2018 Q2.

U.S. Real Estate Debt Investments: Capabilities Overview                                                                                                                           / 32
05 AGENCY CMBS CREDIT BONDS
HYPOTHETICAL STRUCTURE SAMPLE FREDDIE K
CAPITAL STACK (FIXED RATE)
Last $ Attach - Detach Est Gross
Rating Tranche WAL Exposure Points IRR OID
AAA
Senior Guaranteed Bonds AA $1,200 million 6.5-10 $63k/unit 0% - 63% 3.25-3.50% 102-103
A
Mezzanine Bonds NR/BBB $33 million 10 $65k/unit 63% - 65% 4.90%-5.15% 92-93
B-Piece
NR $100 million 10 $70k/unit 65% - 70% 8.50-10.00% 35-40
“Controlling Class”
13-15%
Sponsor Equity Cushion N/A $270 million 10 $100k/unit 70% - 100% N/A
Levered
Freddie Mac typically securitizes loans via the K-Deal program into 3 (sometimes 4) tranches. Senior Guaranteed Bonds: Most senior bonds and the “last loss” position. These bonds are guaranteed by
Freddie Mac. Mezzanine Bonds: Mezzanine Bonds are not guaranteed but are senior to the B-Piece Bonds. B-Piece: B-Piece Bonds represent the “first loss” and are subordinate to the Senior Guaranteed
and Mezzanine Bonds. Please see additional risk factors at the end of this presentation. Sponsor Equity Cushion: Sponsor Equity is not part of the securitization, however shown below as an illustration of
the additional equity which implicitly supports the B-Piece principal. We believe the above EST Gross IRR are representative of those in the market as of the date. No assurance can be made that after
customary due diligence, similar investment opportunities will be available or form part of a future invested portfolio. Past performance is not indicative of future returns. Performance shown is not
indicative of total returns of any fund and does not reflect investment advisory fees. Had such fees been deducted, returns would have been lower. Please refer to the end of this material for important
information about the effect of fees on a portfolio. For illustrative purposes only. Source: DWS as of May 2018
U.S. Real Estate Debt Investments: Capabilities Overview / 3305 AGENCY CMBS CREDIT BONDS
CASE STUDY: SUMMARY (10 YEAR FIXED RATE)
Investment Date September 2018
Sponsor Freddie Mac
Par Value $99 million
Expected Purchase Price $52 million
Last Dollar LTV (est.) 68%
Est. Current Coupon 2.50%
Est. Gross Total Return* 8.57%
Contractual / Expected WAL 9.9 years / 9.9 years
*Returns displayed gross of fees on a pre-loss basis
% of Initial Net
No. of Property Principal Mortgage Pool Underwritten
Loan Properties Sub-Ty pe Location Balance1 Balance NCF DSCR LTV2 Coupon
Loan 1 1 Mid Rise Edgewater, NJ $92,400,000 7.01% 1.25x 57% 4.23%
Loan 2 1 High Rise Detroit, MI $85,495,000 6.48% 1.25x 68% 4.43%
Loan 3 1 Senior San Luis Obispo, CA $64,085,000 4.86% 1.97x 67% 4.51%
Loan 4 1 Garden Greenwood Village, CO $49,055,000 3.72% 1.77x 62% 4.64%
Loan 5 1 Mid Rise Charlotte, NC $47,925,000 3.63% 1.25x 70% 4.21%
Loan 6 1 Garden Albany , NY $47,462,000 3.60% 1.25x 80% 4.58%
Loan 7 1 Garden Harrisburg, PA $44,496,000 3.37% 1.25x 79% 4.47%
Loan 8 1 Garden Concord, CA $44,149,000 3.35% 1.25x 74% 3.96%
Loan 9 1 Garden Y ulee, FL $36,723,000 2.78% 1.25x 71% 4.61%
Loan 10 1 Mid Rise Durham, NC $34,775,000 2.64% 1.70x 64% 4.31%
Top 10 - Total/Weighted Average $546,565,000 41.45% 1.41x 68% 4.39%
(1) Principal Balance and LTV are as of September1, 2018.
The abov e inf ormation is provided for illustrative purposes only and is not indicative of our investment experience as a whole. We believe the above transaction is representative of those in the market as of the date of this
presentation that meet the proposed investment guidelines of the strategy, including location, size and return expectations. No assurance can be made that after customary due diligence, similar investment opportunities will
be av ailable or f orm part of a future invested portfolio. Past performance is not indicative of future returns. Performance shown is not indicative of total returns of any fund and does not reflect investment advisory fees. Had
such f ees been deducted, returns would have been lower. Please refer to the end of this material for important information about the effect of fees on a portfolio. Basis of projections previously provided on our estimated bid
price. Sources: Freddie Mac (data), DWS. As of April 2018.
U.S. Real Estate Debt Investments: Capabilities Overview / 3405 AGENCY CMBS CREDIT BONDS
CASE STUDY: SUMMARY (7 YEAR FLOATING RATE)
Investment Date June 2018
Sponsor Freddie Mac
Par Value $87 million
Expected Purchase Price $87 million
Last Dollar LTV (est.) 70%
Est. Current Coupon L + 625bp, floating
Est. Gross Total Return* 9.0%
Contractual / Expected WAL 6.6 years / 3.5 years
*Returns displayed gross of fees on a pre-loss basis
% of Initial Net Underwritten
No. of Property Principal Mortgage Pool Underwritten NCF DSCR
Loan Properties Sub-Ty pe Location Balance2 Balance NCF DSCR at Cap LTV2 Margin
Loan 1 1 Garden San Diego, CA $147,800,000 12.8% 1.26x 1.03x 64.0% 1.800%
Crossed Group 1 14 MH 1 Various 132,131,000 11.4% 1.35x 1.14x 77.4% 2.250%
Loan 2 1 Mid Rise Austin, TX 78,000,000 6.8% 1.30x 1.06x 75.2% 1.940%
Loan 3 1 Garden Austin, TX 65,550,000 5.7% 1.26x 1.01x 63.5% 1.800%
Loan 4 1 Garden Colton, CA 48,000,000 4.2% 1.26x 1.04x 78.0% 2.030%
Loan 5 1 Garden Milton, GA 44,012,000 3.8% 1.26x 1.01x 67.1% 1.800%
Loan 6 1 Garden Mesa, AZ 41,669,000 3.6% 1.26x 1.01x 69.7% 1.800%
Crossed Group 2 2 Various Various 36,200,000 3.1% 1.51x 1.32x 71.0% 2.327%
Loan 7 1 Garden Rowlett, TX 33,882,756 2.9% 1.26x 1.00x 69.0% 2.250%
Loan 8 9 Garden Manchester, CT 33,134,000 2.9% 1.30x 1.07x 73.3% 2.220%
Top 10 - Total/Weighted Av erage $660,378,756 57.2% 1.30x 1.07x 70.6% 1.996%
(1) MH denotes manufactured housing community. (2) Principal Balance and LTV are as of June 1, 2018.
The abov e inf ormation is provided for illustrative purposes only and is not indicative of our investment experience as a whole. We believe the above transaction is representative of those in the market as of the date of this
presentation that meet the proposed investment guidelines of the strategy, including location, size and return expectations. No assurance can be made that after customary due diligence, similar investment opportunities will
be av ailable or f orm part of a future invested portfolio. Past performance is not indicative of future returns. Performance shown is not indicative of total returns of any fund and does not reflect investment advisory fees. Had
such f ees been deducted, returns would have been lower. Please refer to the end of this material for important information about the effect of fees on a portfolio. Basis of projections previously provided on our estimated bid
price. Sources: Freddie Mac (data), DWS. As of April 2018.
U.S. Real Estate Debt Investments: Capabilities Overview / 3506 APPENDICES Important Information
U.S. REAL ESTATE DEBT FUND TERMS
This preliminary summary of proposed terms is provided solely for inform ational purposes and shall not constitute an offer to sell or the solicitation of an offer to buy
interests (the “Interests”) of any pooled investment vehicle (the “Fund”) m anaged by RREEF America L.L.C. This preliminary summary of proposed terms is exploratory
in nature, is subject to review and change at the sole discretion of DWS, including for regulatory or legal reasons, and should not be relied upon as the basis for an
investment in the Fund and is being used solely to gauge initial interest in the Fund. An investment in the Fund can only be m ade pursuant to a final set of Fund offering
documents. Investment in any DWS product is speculative, is subject to risk and potential conflicts of interests and there is no assurance the Fund’s investment objective
will be achieved or that investors will receive a return of capital. There shall not be any sale of Interests in any state or country in which such solicitation or sale would be
unlaw ful prior to registration or qualification of such Interest under the law s of such jurisdiction.

 Objective                              The Fund intends to seek to achieve attractive medium to high yield risk-adjusted returns by investing in commercial real estate debt and debt
                                        securities through changing market cycles -- economic, real estate operating and capital markets
 Investment Strategy:                   Specific investment guidelines to be established, specific investment categories to include:
                                        (1) Stretch senior debt from core to opportunistic including construction (30-70%)
                                        (2) Subordinate / mezzanine debt from core to opportunistic including construction (15-40%)
                                        (3) Non-agency / agency commercial mortgage-backed securities including investment grade and non-investment grade including SASBs, B-
                                        Pieces & commercial real estate collateralized loan obligations (0-45%)
                                        (4) Preferred equity (0-25%)
 Country:                               US investments w ith properties located in top 50 metropolitan areas
 Sectors                                Multi-Family, Office, Retail, Industrial, Student Housing, Self-Storage, Hospitality, Senior Living, and Mixed Use
 Target Return:                         7-9% net internal rate of return
 Investment Restrictions:               No investment restrictions until portfolio stabilizes at $500mm of gross asset value
                                        Delaw are limited partnership and REIT for US taxable investors and certain US tax exempt investors
 Fund Structure:
                                        Additional investment vehicles for foreign investors and certain tax-exempt US investors expected after initial closing
 Size of Fund:                          Initial Capital Target: $200mm equity ($300-500mm of investable capital, assuming 50% maximum leverage)
 Investment Manager:                    RREEF America L.L.C.
 Term:                                  Open ended, perpetual life
                                        Minimum investment - $5 million
 Subscriptions:
                                        Quarterly

There is no guarantee investment objectives w ill be achieved. Note: The target returns set forth herein do not constitute a forecast; rather they are indicative of the Advisor’s internal
transaction analysis regarding outcome potentials. They are based on the Advisor’s current view in relation to future events and financial performance of potential investments and
various estimations and “base case” assumptions made by the Advisor, including estimations and assumptions about events that have not occurred, and there is no assurance that
these target returns w ill be achieved. While the Advisor believes that these assumptions are reasonable under the circumstances, they are subject to uncertainties and changes. Any
such modifications could be adverse to the actual overall returns. Gross returns are calculated before deductions for fees (including the Management Fee), incentive allocations, taxes,
transaction costs in connection w ith the disposition of unrealized investments and other expenses borne by investors, which will reduce returns for investors and, in the aggregate, are
expected to be substantial. A hypothetical model of the target gross and net leveraged returns is available upon request.

U.S. Real Estate Debt Investments: Capabilities Overview                                                                                                                               / 37
U.S. REAL ESTATE DEBT FUND TERMS (CONTINUED)
Sponsor Commitment: 5% of capital up to $25 million
Withdraw als: Quarterly
36-month lockup period fromdate of capital contribution
No partial w ithdrawals unless withdrawal is greater than $5 million and remaining investment is at least $10 million
Income Distributions: Quarterly
Majority of return expected to come from income
Management Fee
At least Less than Fee (bps)
$5,000,000 $25,000,000 95
Management Fees
(Founders Fees are $25,000,000 $50,000,000 85
TBD)
$50,000,000 $100,000,000 75
$100,000,000 $- 65
Performance Fee None
Valuation & Reporting 100% of Fund’s assets investments will be externally valued annually, and 25% valued each quarter
Currency US Dollars
Borrow ing, Gearing, Bridge Maximum loan-to-value of 50% at the Fund level
Financing
Initial Closing May 2019
There is no guarantee investment objectives w ill be achieved. Note: The target returns set forth herein do not constitute a forecast; rather they are indicative of the Advisor’s internal
transaction analysis regarding outcome potentials. They are based on the Advisor’s current view in relation to future events and financial performance of potential investments and
various estimations and “base case” assumptions made by the Advisor, including estimations and assumptions about events that have not occurred, and there is no assurance that
these target returns w ill be achieved. While the Advisor believes that these assumptions are reasonable under the circumstances, they are subject to uncertainties and changes. Any
such modifications could be adverse to the actual overall returns. Gross returns are calculated before deductions for fees (including the Management Fee), incentive allocations, taxes,
transaction costs in connection w ith the disposition of unrealized investments and other expenses borne by investors, which will reduce returns for investors and, in the aggregate, are
expected to be substantial. A hypothetical model of the target gross and net leveraged returns is available upon request.
U.S. Real Estate Debt Investments: Capabilities Overview / 38MULTI-FAMILY PORTFOLIO—MEZZANINE DEBT
Closing February 2016
Sponsor Confidential
Building Size 14 buildings/430 units
Occupancy 93.5%
Total Capitalization $178.5 million
Senior $96 .0million/54% LTV
Mezz $42.5 million/78% LTV
Equity $40.0 million/100% LTV
Projected IRR at Close1 8.16%
INVESTMENT HIGHLIGHTS:
_ Refinancing of a Multi-Family Portfolio containing 14 buildings and 430 units for a total of 203,000 SF, located throughout San Francisco’s most appealing and
energetic neighborhoods
_ Sponsor assembled the Portfolio in 2011-2012 and has continually reinvested capital, upgrading common areas and renovating units as they turn over
_ Portfolio has historically provided consistent rent and NOI growth with in-place rents approximately 32% below market, due to the rent controlled nature of the
units, providing stable cash flow and mark to market upside potential
_ Mezzanine Loan proceeds will be used to partially reimburse the Sponsor for the renovation costs
_ Five year term, interest only
_ Sponsor is one of the preeminent multi-family and urban retail investment platforms in the San Francisco Bay Area2
(1) The Projected IRR and Multiple are based on the terms of the note at closing. Performance show n is not indicative of total returns of any fund and does not reflect investment
advisory fees. Had such fees been deducted, returns w ould have been low er. Please refer to the end of this material for important information about the effect of fees on a portfolio.
There is no assurance that the projected returns w ill be realized. (2) Source: https://veritasinvestments.com/who-we-are .#1 rank among largest ow ners of apartment properties in San
Francisco (based on the number of buildings ow ned).
The above information is provided for illustrative purposes only and is not indicative of our investment experience as a w hole. We believe the above transaction is representative of
those in the market as of the date of this presentation that meet the proposed investment guidelines of the strategy, including location, size and return expectations. No assurance can
be made that after customary due diligence, similar investment opportunities w ill be available or form part of a future invested portfolio. Past performance is not indicative of future
returns. Source: DWS.
U.S. Real Estate Debt Investments: Capabilities Overview / 39CLASS A OFFICE—MEZZANINE DEBT
Closing November 2016
Sponsor Confidential
Building Size 318,689 SF
Occupancy 100.0%
Total Capitalization $244.0 million
Senior $158.6 million/65% LTV
Mezz $48.8 million/85% LTV
Equity $36.6 million/100% LTV
Projected IRR at Close1 7.82%
INVESTMENT HIGHLIGHTS:
_ Acquisition financing for a 319K SF, 12-story, Class A office tower located in the South Lake Union submarket of Seattle, WA
_ LEED-OM Gold property was completed in 2015 as Phase VII of a broader tenant campus
_ Office portion is 100% leased (98.2% of total NRA) to a single credit tenant (S&P: AA-)
_ Mezzanine Loan proceeds will be used to help finance the acquisition of the Property
_ 3+1+1 year term with full cash sweep to pay down the Mezzanine Loan to an 80% LTV (based on value at closing)
_ Sponsor is a partnership of two large, long standing commercial real estate investors
(1) The Projected IRR and Multiple are based on the terms of the note at closing. Performance show n is not indicative of total returns of any fund and does not reflect investment
advisory fees. Had such fees been deducted, returns w ould have been low er. Please refer to the end of this material for important information about the effect of fees on a portfolio.
There is no assurance that the projected returns w ill be realized.
The above information is provided for illustrative purposes only and is not indicative of our investment experience as a w hole. We believe the above transaction is representative of
those in the market as of the date of this presentation that meet the proposed investment guidelines of the strategy, including location, size and return expectations. No assurance can
be made that after customary due diligence, similar investment opportunities w ill be available or form part of a future invested portfolio. Past performance is not indicative of future
returns. Source: DWS.
U.S. Real Estate Debt Investments: Capabilities Overview / 40LEED PLATINUM OFFICE TOWER—MEZZANINE DEBT
Closing October 2016
Sponsor Confidential
Building Size 1,098,633 SF
Occupancy 92.4%
Total Capitalization $594.8 million
Senior $325.0million/55% LTV
Mezz $75.0 million/67% LTV
Equity $194.8 million/100% LTV
Projected IRR at Close1 6.53%
INVESTMENT HIGHLIGHTS:
_ Refinancing of a 1.1M SF, 31-story, Class A office tower located in the West Loop submarket of Chicago, IL
_ LEED-OM Platinum property is one of the most technologically advanced office buildings in Chicago with extensive backup/redundant power supplies
_ Diversified rent roll with over 51% of NRA leased to credit tenants and no rollover for the first six years of the loan term
_ Mezzanine Loan proceeds will be used to repay the existing debt and reserve for future TI/LCs and rent abatements
_ Ten year term, interest only
_ Sponsor is a partnership of three large, long standing commercial real estate investors
(1) The Projected IRR and Multiple are based on the terms of the note at closing. Performance show n is not indicative of total returns of any fund and does not reflect investment
advisory fees. Had such fees been deducted, returns w ould have been low er. Please refer to the end of this material for important information about the effect of fees on a portfolio.
There is no assurance that the projected returns w ill be realized.
The above information is provided for illustrative purposes only and is not indicative of our investment experience as a w hole. We believe the above transaction is representative of
those in the market as of the date of this presentation that meet the proposed investment guidelines of the strategy, including location, size and return expectations. No assurance can
be made that after customary due diligence, similar investment opportunities w ill be available or form part of a future invested portfolio. Past performance is not indicative of future
returns. Source: DWS.
U.S. Real Estate Debt Investments: Capabilities Overview / 41LEED SILVER OFFICE TOWER—MEZZANINE DEBT
Closing January 2018
Sponsor Confidential
Building Size 828,538 SF
Occupancy 90.3%
Total Capitalization $387.9 million
Senior $235.1 million/60% LTV
Mezz $62.5 million/78% LTV
Equity $90.3 million/100% LTV
Projected IRR at Close1 7.26%
INVESTMENT HIGHLIGHTS:
_ Acquisition financing for a 828,538 SF, 40-story, Class A office tower located in the Central Loop submarket of Chicago, IL
_ LEED Silver certified property, built in 2005 to serve as a build-to-suit global headquarters for a global law firm
_ The asset is 66.2% leased to a global law firm and 9.7% leased to the world’s largest steel company
_ Mezzanine Loan proceeds will be used to help finance the acquisition of the Property
_ 4+1 year term with 1.105x minimum multiple
_ Sponsor is an institutional investment firm headquartered in the United States
(1) The Projected IRR and Multiple are based on the terms of the note at closing. Performance show n is not indicative of total returns of any fund and does not reflect investment
advisory fees. Had such fees been deducted, returns w ould have been low er. Please refer to the end of this material for important information about the effect of fees on a portfolio.
There is no assurance that the projected returns w ill be realized.
The above information is provided for illustrative purposes only and is not indicative of our investment experience as a w hole. We believe the above transaction is representative of
those in the market as of the date of this presentation that meet the proposed investment guidelines of the strategy, including location, size and return expectations. No assurance can
be made that after customary due diligence, similar investment opportunities w ill be available or form part of a future invested portfolio. Past performance is not indicative of future
returns. Source: DWS.
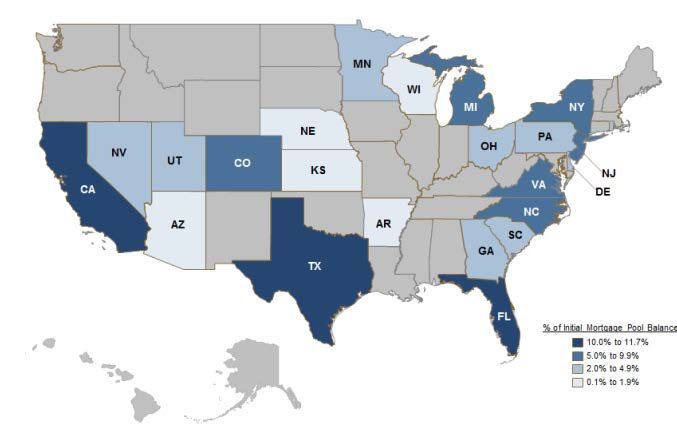
U.S. Real Estate Debt Investments: Capabilities Overview / 42FREMF 2018-K82—FREDDIE K SERIES
Class D Certificate (“Class D”) and X2-A / X2-B Certificates (“Interest Only
Bonds”)
Settlement Date October 31, 2018
Pool Name FREMF 2018-K82
Pool Sponsor Freddie Mac
Type 10 Year Fixed
Initial Pool Size $1.34 billion
Class D Par Value $100.4 million
1
Total Purchase Price $52.7 million
Weighted Avg. LTV 68%
Weighted Avg. Debt Yield 7.95%
Estimated Gross Unlevered Return
8.58%
(Pre-Loss)2
INVESTMENT HIGHLIGHTS:
_ Purchase of a 100% interest in the Class D Certificate and related interest only securities (X2-A and X2-B Certificates or “IOs”) of a ~$1.3 billion fixed rate
Freddie Mac Multi-Family CMBS Securitization consisting of 62 multi-family commercial mortgages known as FREMF 2018-K82 (“K82”).
_ The pool collateral is comprised of 62 different properties in 23 states representing a 68% last-dollar average Loan-to-Value and 7.95% weighted average
debt yield.
_ Top 5 MSAs by loan amount include Baltimore-Towson, MD (14.9% of Pool), Dallas-Fort Worth-Arlington, TX (10.0% of Pool), Las Vegas-Paradise, NV
(8.4% of Pool), Atlanta-Sandy Springs-Marietta, GA (8.1% of Pool), and Denver-Aurora, CO (6.7% of Pool).
_ Credit Quality: Average Freddie Mac loan default rates since 1994 (25,586 loans) have been 23bps per year, peaking at 160bps in 2006 with zero defaults
since 2011. Post-Recession 60+ day delinquencies peaked at 36bps in 1Q11 compared to non-agency CMBS multi-family which exceeded 1,000bps
delinquency rate from 4Q09 through 4Q12.
(1) Total Purchase Price includes Class D ($43.9 million) and X2-A / X2-B Interest Only Securities ($8.8 million). (2) The Estimated Gross Unlevered Return are based on the terms of
the note at closing. Performance show n is not indicative of total returns of any fund and does not reflect investment advisory fees. Had such fees been deducted, returns w ould have
been low er. Please refer to the end of this material for important information about the effect of fees on a portfolio. There is no assurance that the projected returns w ill be realized.
The above information is provided for illustrative purposes only and is not indicative of our investment experience as a w hole. We believe the above transaction is representative of
those in the market as of the date of this presentation that meet the proposed investment guidelines of the strategy, including location, size and return expectations. No assurance can
be made that after customary due diligence, similar investment opportunities w ill be available or form part of a future invested portfolio. Past performance is not indicative of future
returns. Source: DWS.
U.S. Real Estate Debt Investments: Capabilities Overview / 43IMPORTANT INFORMATION The brand DWS represents DWS Group GmbH & Co. KGaA and any of its subsidiaries such as DWS Distributors, Inc. which offers investment products or DWS Investment Management Americas Inc. and RREEF America L.L.C. which offer advisory services, in addition to the regional entities in the DWS Group. An investment in real estate involves a high degree of risk, including possible loss of principal amount invested, and is suitable only for sophisticated investors who can bear such losses. The value of shares/ units and their derived income may fall or rise. Any forecasts provided herein are based upon DWS’s opinion of the market at this date and are subject to change dependent on the market. Past performance or any prediction, projection or forecast on the economy or markets is not indicative of future performance. Investment in real estate may be or become nonperforming after acquisition for a wide variety of reasons. Nonperforming real estate investment may require substantial workout negotiations and/ or restructuring. Environmental liabilities may pose a risk such that the owner or operator of real property may become liable for the costs of removal or remediation of certain hazardous substances released on, about, under, or in its property. Additionally, to the extent real estate investments are made in foreign countries, such countries may prove to be politically or economically unstable. Finally, exposure to fluctuations in currency exchange rates may affect the value of a real estate investment. Key Risks of Real Estate Investments Investments in Real Estate are subject to various risks, including but not limited to the following: _ Adverse changes in economic conditions including changes in the financial conditions of tenants, buyer and sellers, changes in the availability of debt financing, changes in interest rates, real estate tax rates and other operating expenses; _ Adverse changes in law and regulation including environmental laws and regulations, zoning laws and other governmental rules and fiscal policies; _ Environmental claims arising in respect of real estate acquired with undisclosed or unknown environmental problems or as to which inadequate reserves have been established; _ Changes in the relative popularity of property types and locations; _ Risks and operating problems arising out of the presence of certain construction materials; and _ Currency/exchange rate risks where the investments are denominated in a currency other than the investor’s home currency U.S. Real Estate Debt Investments: Capabilities Overview / 44
You can also read