COVID-19 Twitter Dataset with Latent Topics, Sentiments and Emotions Attributes - arXiv
←
→
Page content transcription
If your browser does not render page correctly, please read the page content below
COVID-19 Twitter Dataset with Latent Topics, Sentiments
              and Emotions Attributes

                              Important notes

   1. The dataset described in this paper is available for download at
      OpenICPSR: https://doi.org/10.3886/E120321
   2. The dataset license is also available at the OpenICPSR download
      folder. Essentially, the dataset license considers the need to be
      consistent with Twitter’s terms as the dataset is built upon
      content provided by Twitter API, and CC BY-NC 2.0.
   3. Hence, if you intend to use the dataset, you should read and agree
      with Twitter’s Terms of Service, Privacy Policy, Developer
      Agreement, and Developer Policy. The user should also read the
      restricted uses from Twitter to avoid using the dataset for any
      potentially inappropriate use.
   4. In compliance with Twitter’s content redistribution terms, our
      released dataset only includes “tweet_ID” and “user_ID” from
      Twitter’s original data attributes. Users shall be able to use
      “tweet_ID” and/or “user_ID” to retrieve or “hydrate” the other
      attributes (such as the actual “text”, “tweet_created_at”,
      “retweet_count”, “location”, “followers_count”) through the
      Twitter API directly.
   5. No redistribution beyond the user’s immediate research group or
      lab is allowed. The user shall direct any interest or request to the
      corresponding author.
   6. Citation of this paper:
            Gupta, R., Vishwanath, A., and Yang, Y. (2020), COVID-19
            Twitter Dataset with Latent Topics, Sentiments and Emotions
            Attributes, Preprint at: https://arxiv.org/abs/2007.06954
   7. Enquiries can be sent to the corresponding author via email.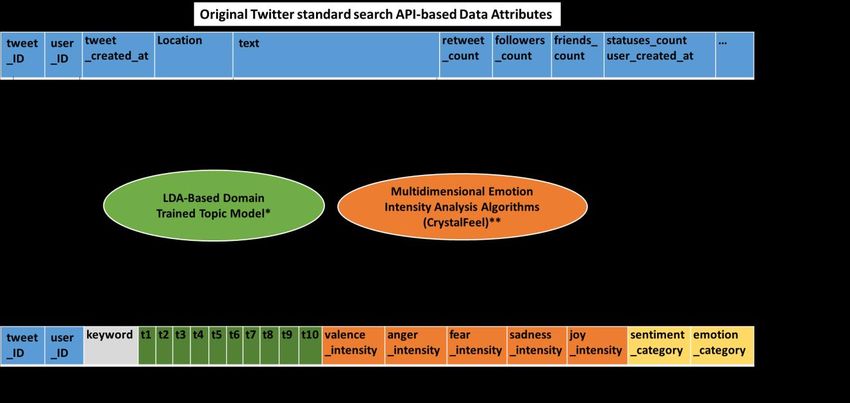
COVID-19 Twitter Dataset with Latent Topics, Sentiments and
Emotions Attributes

Raj Kumar Gupta, Ajay Vishwanath, Yinping Yang

Affective and Social Intelligence Group, Social and Cognitive Computing, Institute of High
Performance Computing, Agency for Science, Technology and Research (A*STAR), Singapore
Corresponding author: Yinping Yang (yangyp@ihpc.a-star.edu.sg)

Abstract
This paper presents a large annotated dataset on public expressions related to the COVID-19
pandemic. Through Twitter’s standard search application programming interface, we
retrieved over 63 million coronavirus-related public posts from more than 13 million unique
users since 28 January to 1 July 2020. Using natural language processing techniques and
machine learning based algorithms, we annotated each public tweet with seventeen latent
semantic attributes, including: 1) ten binary attributes indicating the tweet's relevance or
irrelevance to ten detected topics, 2) five quantitative attributes indicating the degree of
intensity of the valence or sentiment (from extremely negative to extremely positive), and the
degree of intensity of fear, of anger, of sadness and of joy emotions (from extremely low
intensity to extremely high intensity), and 3) two qualitative attributes indicating the
sentiment category and the dominant emotion category, respectively. We report basic
descriptive statistics around the topics, sentiments and emotions attributes and their
temporal distributions, and discuss its possible usage in communication, psychology, public
health, economics and epidemiology research.

Background & Summary
The 2019 coronavirus disease (COVID-19) was first officially reported as acute respiratory
infections caused by an unknown virus in Wuhan city, Hubei province in China on 31 December
2019. To date, the disease has infected 10,357,662 people worldwide and claimed 508,055
lives, according to the World Health Organization (WHO)’s situation report as at 1 July 2020
[1].

The issues surrounding the pandemic are increasingly challenging and complex. The
complexity not only comes from the disease itself, but also by the surge of the medical, social,
behavioural and economic issues that the disease has brought about, such as reports on daily
counts of new cases and mortality rates, scientific discoveries, government responses, news
reporting of social behaviours such as panic buying and food hoarding, impact on businesses
and economic outlook, and changes in people’s everyday lives. The challenges are multi-
faceted and unprecedented. There is a growing recognition of the need for multidisciplinary
research efforts to support the COVID-19 pandemic response, including disciplines such as
social and behavioural science [2] and mental health science [3].

Twitter is a popular microblogging site widely used by Internet users. According to Statista, as
of the fourth quarter of 2019, Twitter had 152 million active users worldwide [4]. Twitter
provides the research community a rich source of information about when, where and what
people have to say in their posts (known as “tweets”) through its free, publicly accessible
standard application programming interface (API) service. However, the raw tweet content is
mostly in textual format and is not readily analysable. When there is a huge amount of tweets,
it takes a significant amount of time to accurately extract information related to people’s
concerns, feelings and emotions for human analysts and researchers to process and analyse
for in-depth patterns and insights.

                                                                                              1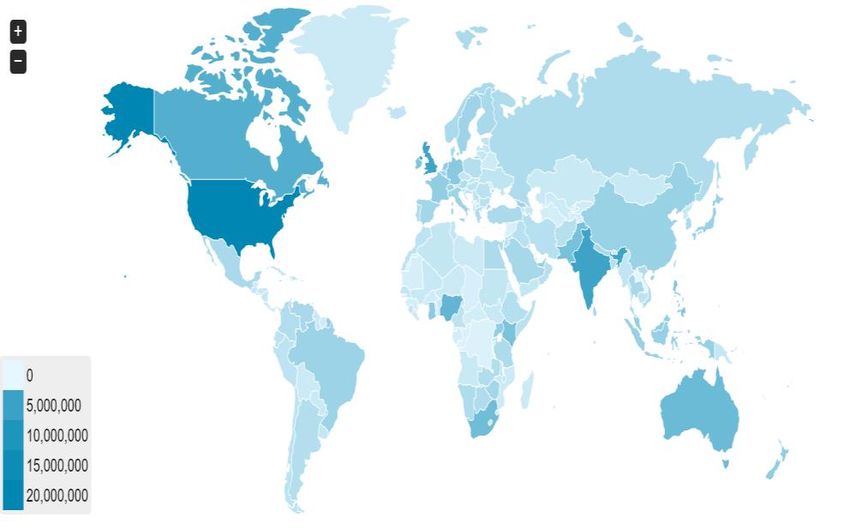
Despite the fact that Twitter has opened up real-time, full-fidelity data streams related to
COVID-19 tweets since late April 2020 [5], and that a few recent studies have leveraged Twitter
for COVID-19 studies (e.g., [6, 7]), to the best of our knowledge, no others have provided a
tweet-by-tweet research resource with rich, semantically and psychologically meaningful
attributes surrounding the topics, sentiments and emotions from the tweets content. The
dataset described in this paper provides tweet-by-tweet tagging of the topic clusters that a
tweet is semantically related to, the sentiment it is expressing, and the emotional properties
it is associated with.

Figure 1 presents the data schematic structure and the data processing methods.

              Figure 1. Overview of the data structure and processing methods

An initial analysis of the world’s emotion trends using a part of this dataset has shed light on
the significant change of people’s emotional responses to the pandemic from late January to
early April [8]. This initial study focused on the “emotion_category” attribute solely, and found
that anger has overtaken fear as the dominant emotion in tweets.

We seek to make the full dataset with tweet-by-tweet topics, sentiments and emotions
attributes available for broad research communities. The purpose is to allow researchers to
perform more in-depth investigations in all possible areas such as discovering the correlational
patterns between with other important variables such as government policy communications,
demographics, economic indicators, as well as epidemiological markers.

Methods
We describe the methods behind the data collection and data processing with a focused
interest on tracking and understanding the latent topics, sentiments and emotions
surrounding the COVID-19 pandemic. We applied natural language processing (NLP)
techniques, in particular, statistical topic clustering techniques that detect tweets surrounding
similar topic clusters. We also applied previously machine learning-trained and validated
algorithms to tag each tweet with a sentiment valence (unpleasantness / pleasantness), as
well as intensity scores of four different emotions – anger, fear, sadness and joy.

                                                                                               2
Collection of raw Twitter data related to COVID-19
We started to set up our data collection app early February 2020 by querying Twitter’s
standard search API [9] using three keywords "corona", "wuhan" (many people refer to the
virus as "wuhan virus" at initial stages when official names were not yet announced), and
"nCov" (WHO first named the virus as "2019-nCov"). On 11 February 2020, upon WHO officially
renamed the disease as "COVID-19", we added "covid" as a new search keyword. Simple
sharing of these tweets (i.e., retweets) are not collected for the dataset.
The Twitter API returns the tweet text content with a rich range of useful attributes. For
example, we were able to download the following 12 attributes in our local database.
• tweet_ID: The unique identifier for this tweet
• tweet_created_at: The UTC time when this tweet was created
retweet_count: Number of times this tweet has been retweeted
• text: The actual UTF-8 text of the tweet
• favorite_count: Number of times this tweet has been liked
• hashtag_text: Name of the hashtag, minus the leading ‘#’ character
• user_ID: The unique identifier for the user who created the tweet
• followers_count: Number of followers this account currently has
• friends_count: Number of users this account is following
• statuses_count: Number of tweets (including retweets) issued by the user
• user_created_at: The UTC datetime that the user account was created on Twitter
location: The user-defined location in this account’s profile
Processing for the topic attributes
Although all the retrieved tweets are relevant to at least one of the four COVID-19 related
keywords, there are many facets or subtopics people have covered in the tweets’ “text”
content. We applied an unsupervised topic clustering technique called Latent Dirichlet
Allocation (LDA) to facilitate the understanding of the subtopics. LDA is a probabilistic
generative model which learns a multinomial distributions of latent topics in a given document
and words in a given topic [10]. The advantage of LDA is that it is independent of the corpus
size which makes it algorithmically efficient to learn topic clusters within a corpus with a large
number of tweets such as ours.
First, we pre-processed each raw tweet by converting it to ASCII characters, removing
accented characters, forming bigrams and trigrams, filtering out stop words (including most
rare and most frequent words), and performing text tokenization. These pre-processed tweets
were then converted into a bag-of-words (BoW) corpus. The training data’s date range is 28
January to 27 May 2020, which consists of 51 million tweets.
Next, we randomly sampled 1% of the BoW corpus and trained an LDA model whose inference
was performed using online variational Bayes [11]. Using the trained LDA-based topic model,
we obtained 100 topic clusters. The following list illustrates the top ten topics detected in the
dataset (e.g., “topic 1”) and the ten most representative words associated with each detected
topic (e.g., “people, cases, new, deaths, time, china, realdonaldtrump, lockdown, trump” for
“topic 1”), respectively.
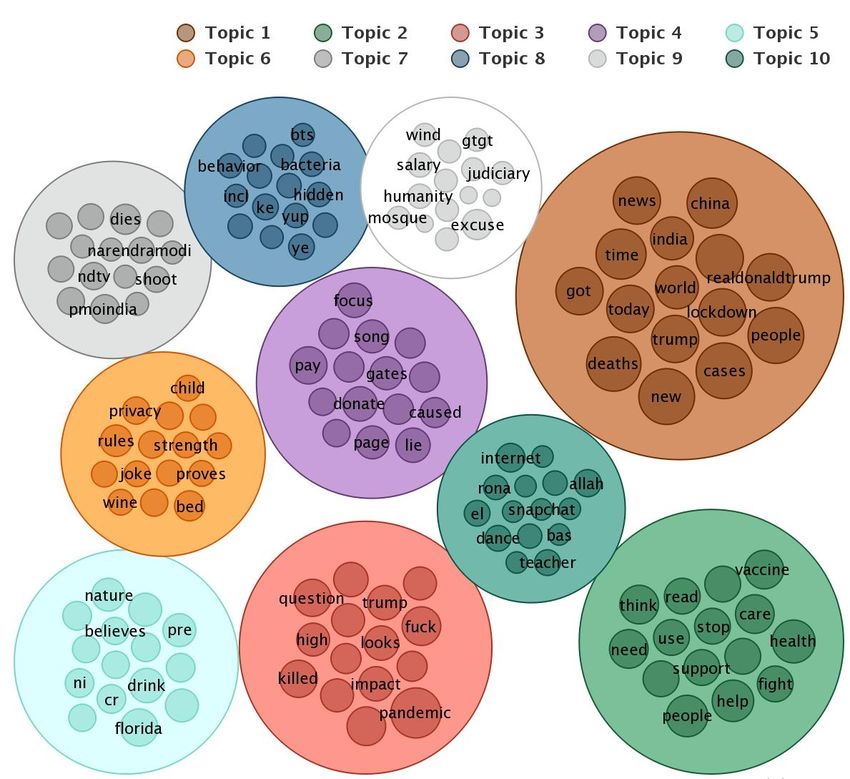
• topic 1: people, cases, new, deaths, time, china, realdonaldtrump, lockdown, trump
• topic 2: health, help, people, need, think, vaccine, care, fight, support
• topic 3: pandemic, f**k, months, killed, question, wait, looks, trump, impact
• topic 4: pay, donate, lie, focus, song, gates, page, google, caused
• topic 5: florida, drink, named, nature, marketing, pr, ncdcgov, farmers, cr
3• topic 6: rules, bed, drtedros, speaks, privacy, parliament, physicians, strength, joke
• topic 7: dies, pmoindia, ndtv, ai, narendramodi, mohfwindia, shoot, drharshvardhan,
battle
• topic 8: ye, ke, behaviour, brought, hidden, yup, smell, zerohedge, odds
• topic 9: excuse, humanity, salary, wind, gtgt, rats, ice, beard, mosque
• topic 10: internet, allah, teacher, dance, el, rona, weed, crush, fk
Lastly, for each tweet in the entire dataset, we assigned a relevance label (“1” or “0”) using
the trained LDA model based on the contribution of each topic (over a total of 100 topic
clusters) to the tweet (“1” indicates if the contribution is > 1%, where “0” indicates otherwise).
Table 1 shows example tweets that are tagged with the corresponding topic clusters that they
are relevant to, respectively. The first ten examples show tweets that are solely relevant to
each of the ten topic clusters. The last example shows that a tweet can be relevant to multiple
topic clusters simultaneously.
Table 1. Examples of the tweets and their corresponding topic attributes
Example tweet text t1 t2 t3 t4 t5 t6 t7 t8 t9 t10
Remember when doja cat said corona was 1 0 0 0 0 0 0 0 0 0
just the flu
STAY SAFE from CORONAVIRUS There is 0 1 0 0 0 0 0 0 0 0
currently no antiviral treatment or vaccine
to prevent Coronavirus (COVID-19)
No. It is a part of One Belt One Road. 0 0 1 0 0 0 0 0 0 0
#ChinaVirus WHO says Wuhan coronavirus
outbreak is not yet a pandemic
Bill Gates: This is how long it may take 0 0 0 1 0 0 0 0 0 0
before Americans can be completely safe
from COVID-19
Florida’s COVID-19 website guru blasts 0 0 0 0 1 0 0 0 0 0
bosses, hints at data suppression
Municipality closes 336 shops in all six 0 0 0 0 0 1 0 0 0 0
governorates for violating corona rules
@Naveen_Odisha @narendramodi 0 0 0 0 0 0 1 0 0 0
@MoHFW_INDIA @PrakashJavdekar
@drharshvardhan @dr_arunsahoo I
request to postpone our…
Previously its DAM funds. now ita corona 0 0 0 0 0 0 0 1 0 0
fund. pochna sirf ye tha k DAM fund kaha
tk pohancha
apparently child abuse cases are going up 0 0 0 0 0 0 0 0 1 0
and the excuse is that parents are stressed
over covid-19. im sorry but
today i found out weed kills the corona 0 0 0 0 0 0 0 0 0 1
virus and i ain’t been worried since
PICS: Built in 10 days – 1000 bed hospital 1 1 1 0 1 0 0 0 0 0
opens to battle coronavirus in Wuhan All 4
Women
4Processing for the sentiment and emotion intensity attributes
As sentiments and emotions are subjective information embedded in the unstructured “text”
content, it is a necessity to extract such information with targeted tools. We used CrystalFeel
[12], a collection of five machine-learning based algorithms to extract the sentiment and
emotions scores. The development of CrystalFeel involved training and experimental
evaluations of features derived from affective lexicons, parts-of-speech, and word
embeddings [13], using tweets manually annotated with intensity ground truth values [14].
Table 2 shows five example tweets tagged with these five attributes. The first example shows
a tweet with a moderate (i.e., neither very negative nor very positive) sentiment
“valence_intensity”, and the other four examples show tweets with relatively high intensity
score for joy, anger, fear and sadness dimensions. It shall be noted that, in certain cases such
as the fourth example (“Being higher risk of covid has me all over the place. Appt is in about
90 mins. Im scared, worried and anxious”), the intensity score may be exceeding the 0-1
normal ranges, which indicates that these cases represented extreme intensities beyond the
algorithms’ original training samples.
Table 2. Examples tweets and their corresponding sentiment valence and emotions
intensity scores attributes
Example tweet text valence_ anger_ fear_ sadness_ joy_
intensity intensity intensity intensity intensity
Community hospital Bright 0.505 0.391 0.444 0.423 0.334
Vision transfers all patients
to make room for stable
COVID-19 cases
Seeing this face for just a 0.930 0.143 0.177 0.209 0.822
few minutes on her 97th
birthday today made my
heart so happy! #Greatful
#COVID #Nana
To any fellow nationalist 0.318 0.665 0.520 0.495 0.260
celebrating boris getting
the corona virus are
nothing less than an
absolute cunt.
Being higher risk of covid 0.231 0.542 1.074 0.670 0.174
has me all over the place.
Appt is in about 90 mins .
Im scared, worried and
anxious
When u cant handle shit 0.076 0.617 0.836 0.940 0.077
any longer and u feel
hopeless #COVID_19
starting to make my
depression worse
Processing or converting intensity to the sentiment category attribute
To facilitate more straightforward interpretation, we also converted CrystalFeel algorithm’s
sentiment valence intensity score (quantitative value as “valence_intensity”) into to a
categorical label (qualitative value as “sentiment_category”) using the following logic.
5// # Initialize the sentiment category in a “neutral or mixed” class
1 sentiment_category = "neutral or mixed";
// # Assign the sentiment category based on the degree of the valence intensity
2 if(valence_intensity 0.70):
7 sentiment_category = "very positive";
8 elif(valence_intensity > 0.52):
9 sentiment_category = "positive";
Table 3 shows the five tweets examples tagged with their corresponding sentiment categories,
qualitatively indicating the sentiment each tweet is mainly expressing.
Table 3. Examples of the tweets data and their corresponding sentiment categories
Example tweet text sentiment_category
Community hospital Bright Vision transfers all patients to neutral or mixed
make room for stable COVID-19 cases
To any fellow nationalist celebrating boris getting the negative
corona virus are nothing less than an absolute cunt.
Being higher risk of covid has me all over the place. Appt is very negative
in about 90 mins . Im scared , worried and anxious
When u cant handle shit any longer and u feel hopeless very negative
#COVID_19 starting to make my depression worse
Seeing this face for just a few minutes on her 97th very positive
birthday today made my heart so happy! #Greatful
#COVID #Nana
Processing or converting intensity to the emotion category attribute
As the underlying dominant emotion behind the sentiments carries more information than the
overall valence or sentiment, we also converted CrystalFeel’s joy, anger, fear and sadness
intensity scores into an “emotion_category” value to facilitate interpretation.
To achieve this, we applied a logic that leverages all the valence and emotions intensities
scores from CrystalFeel’s outputs. We first use “valence_intensity” as the first-line criterion as
this dimension that has very high accuracy, i.e., 0.816 in terms of Pearson correlation with
human annotated ground truth values. We then use the relative intensity comparing the three
primary negative emotions, anger, fear and sadness to assign a corresponding dominant
emotion category. The following script describes the conversion logic:
// # Initialize the sentiment category in a "no specific emotion" class
1 emotion_category = "no specific emotion";
// # Assign the emotion category when valence intensity score exceeds 0.52
2 if(valence_intensity > 0.52):
3 emotion_category = "joy or other positive expression";
// # Assign the emotion category when valence intensity score falls below 0.48
4 elif(valence_intensity < 0.48):
5 emotion_category = "anger";
6 if((fear_intensity > anger_intensity) and (fear_intensity > = sadness_intensity )):
67 emotion_category = "fear";
8 elif((sadness_intensity > anger_intensity) and sadness_intensity > fear_intensity)):
9 emotion_category = "sadness";
Table 4 shows the five tweets examples tagged with the dominant emotion categories.
Table 4. Examples of the tweets data and their corresponding emotion category results
Example tweet text emotion_category
Community hospital Bright Vision transfers all patients to no specific emotion
make room for stable COVID-19 cases
To any fellow nationalist celebrating boris getting the anger
corona virus are nothing less than an absolute cunt.
Being higher risk of covid has me all over the place. Appt fear
is in about 90 mins . Im scared , worried and anxious
When u cant handle shit any longer and u feel hopeless sadness
#COVID_19 starting to make my depression worse
Seeing this face for just a few minutes on her 97th joy or other positive
birthday today made my heart so happy! #Greatful expression
#COVID #Nana
It is useful to note that the above-mentioned conversion logic turning CrystalFeel’s original
emotional intensity scores to “sentiment_category” and “emotion_category” lables are based
on application assumptions where CrystalFeel is used for processing short informal text (e.g.,
tweets, Facebook posts and comments). The conversion thresholds are derived from heuristics
and social media corpora we continuously monitor in our research (see more in [12]).
Users may define and adjust their own conversion logic as far as it is appropriate or suitable
for different applications. For example, for converting the emotional intensity scores to
meaningful categories on short formal text (e.g., news headlines), the conversion logic shall be
adjusted accordingly.
Data Records
As at 1 July 2020, our system collected a total of 63,347,100 English tweets worldwide using
the four COVID-19 related keywords, with the first retrievable date being 28 January 2020.
The data record is constructed to include two comma-separated value (CSV) files:
1. tweets_topics_sentiments_emotions (5k sample).csv
This is a very small, randomly selected sample of the full dataset. It can be used to quickly
understand the data structure and attributes using any typical applications such as Microsoft
Excel.
2. tweets_topics_sentiments_emotions.csv
This is the full 63 million tweets csv file. The file is approximately 8 GB. It is recommended to
use python+pandas to view and retrieve data record in this file.
Here, each of the data record file has a total of 20 columns (i.e., attributes), including: the
“tweet_ID” (the unique identifier for this tweet), the “user_ID” (the unique identifier for the
user), the “keyword” (“corona”, “wuhan”, “nCov” or “covid”, which we used to query the
7Twitter API to obtain the corresponding tweet), and the following 17 latent topics, sentiments
and emotions related attributes.
t1: A binary value of 0 or 1, where 0 – this tweet is not relevant to this topic; 1 – this
tweet is relevant to this topic
t2: A binary value of 0 or 1, where 0 – this tweet is not relevant to this topic; 1 – this
tweet is relevant to this topic
t3: A binary value of 0 or 1, where 0 – this tweet is not relevant to this topic; 1 – this
tweet is relevant to this topic
t4: A binary value of 0 or 1, where 0 – this tweet is not relevant to this topic; 1 – this
tweet is relevant to this topic
t5: A binary value of 0 or 1, where 0 – this tweet is not relevant to this topic; 1 – this
tweet is relevant to this topic
t6: A binary value of 0 or 1, where 0 – this tweet is not relevant to this topic; 1 – this
tweet is relevant to this topic
t7: A binary value of 0 or 1, where 0 – this tweet is not relevant to this topic; 1 – this
tweet is relevant to this topic
t8: A binary value of 0 or 1, where 0 – this tweet is not relevant to this topic; 1 – this
tweet is relevant to this topic
t9: A binary value of 0 or 1, where 0 – this tweet is not relevant to this topic; 1 – this
tweet is relevant to this topic
t10: A binary value of 0 or 1, where 0 – this tweet is not relevant to this topic; 1 – this
tweet is relevant to this topic
valence_intensity: A real-valued score with its normal range as from 0 to 1, where 0 -
this text expresses extremely high intensity of unpleasant feelings; 1 - this text expresses
extremely high intensity of pleasant feelings
anger_intensity: A real-valued score with its normal range as from 0 to 1, where 0 - this
text expresses extremely low intensity of anger; 1 - this text expresses extremely high
intensity of anger
fear_intensity: A real-valued score with its normal range as from 0 to 1, where 0 - this
text expresses extremely low intensity of fear; 1 - this text expresses extremely high
intensity of sadness
sadness_intensity: A real-valued score with its normal range as from 0 to 1, where 0 -
this text expresses extremely low intensity of sadness; 1 - this text expresses extremely
high intensity of sadness
joy_intensity: A real-valued score with its normal range as from 0 to 1, where 0 - this
text expresses extremely low intensity of joy; 1 - this text expresses extremely high
intensity of joy
sentiment_category: A categorical value indicating the sentiment a tweet is expressing,
with a value being either “very negative”, “negative”, neutral or mixed”, “positive”,
“very positive”
emotion_category: A categorical value indicating the most dominant emotion a tweet
is expressing, with a value being either “anger”, “fear”, “sadness”, “joy or other positive
expression”, “no specific emotion”
Important note. In compliance with Twitter’s content redistribution terms, the original Twitter
data attributes in our released dataset only include “tweet_ID” and “user_ID”. Users shall be
able to use “tweet_ID” and/or “user_ID” to retrieve or “hydrate” the other attributes (such as
the actual “text”, “tweet_created_at”, “retweet_count”, “location”, “followers_count”)
through the standard search API from Twitter directly [9].
8Technical Validation
Raw tweets coverage
As at 1 July, our system has collected a total of 63,347,100 English tweets worldwide using the
four COVID-19 related keywords, with the first retrievable date being 28 January 2020.
Table 6 presents the data overview. Out of all the tweets, majority are retrieved based on the
“covid” keyword which returned 44,930,122 tweets, or 71%. On average, 17,029 COVID-
related tweets were posted every hour, or 408,691 tweets every day.
Table 6. Overall Twitter data overview (28 January – 1 July 2020; 155 days)
Keyword Volume / no. of tweets Distribution
used collected
corona 15,492,526 24%
wuhan 2,569,674 4%
ncov 354,778 1%
covid 44,930,122 71%
total 63,347,100 100%
These tweets are posted by 13,749,346 unique users based on the “user_ID” attribute.
Nevertheless, it is useful to note that a known limitation of Twitter’s standard search API is
that it does not guarantee the retrieved tweets are exhaustive, due to indexing and other
reasons. In other words, the search API retrieves relevant but not all the tweets that match
the search keywords.
Geographical representativeness
To assess the geographic representativeness of the tweets, we converted the “location” from
the original Twitter attribute into a “country_region” attribute. This is done using GeoNames’
cities15000 geographic database [15], which contains a mapping between all cities with a
population > 15000 or capitals and a country code. For example, original location “Ontario,
Canada” is converted to country_region code as “Canada”, “India” is converted to as “India”,
“Shanghai” is converted to as “Kuwait”, “London” is converted to as “United Kingdom”. If the
location is indicated as “online”, “The Entire Universe!” or left blank (i.e., no match can be
found using the GeoNames database), the country_region is coded as “-“.
The geographical coverage of the tweets is estimated to contain users coming from more than
170 countries, regions and territories worldwide. Figure 2 shows a visualization of the
geographical representativeness.
9Figure 2. Geographical coverage and volume distribution of the tweets
Validity of the processing methods
Topic identification. The quality of the topic model was evaluated using metrics including
perplexity and coherence scores based on suggestions from the literature [16]. We obtained
the top ten topics, i.e., “t1”, “t2”, …,”t10”, that received a relatively high coherence scores (c_v
measure, mean = 0.575) from a model optimized by learning 100 topics and hyper-parameters
α as a fixed normalized asymmetric Dirichlet prior (1/topic_number) and η = 0.909. We
obtained ten topics out of 100 extracted from 500,000-odd data points, which is a 1% sample
from the full dataset. Conceivably, training an LDA-based topic model with data from specific
twitter accounts, smaller and more focused date range, particular countries of interest, or
certain hashtags, would yield more targeted and meaningful results. Hence, we provide our
Python source code to help researchers quickly apply and adapt the model for further usage
scenarios.
Emotional intensity scores. The accuracy in determining “valence_intensity”, “fear_intensity”,
“anger_intensity”, “sadness_intensity”, and “joy_intensity” are systematically validated in
prior research [13], and are subsequently tested for predictive validities in other NLP tasks [17,
18, 19]. As reported in Gupta and Yang’s original evaluation experiments using out-of-training-
sample test data, the CrystalFeel algorithms’ accuracies in terms of Pearson correlation
coefficient (r) with manually annotated test data, are 0.816 on valence intensity, and are
0.708, 0.740, 0.700 and 0.720 on joy intensity, anger intensity, fear intensity and sadness
intensity [13]. The predictive validity of the valence, joy, anger, fear and sadness intensity
scores on other tasks has been studied and demonstrated in the context of predicting news
social popularity in Facebook and Twitter [17], in predicting the ingredients of happy moments
[18], and in detecting propaganda techniques in news articles [19]. Hence, researchers may
examine the use of the sentiment and emotions intensity scores directly without conversions.
Sentiment category and emotion category labels. The “sentiment_category” and
“emotion_category” attributes are obtained based on a conversion logic or “codebook”
presented in the “Methods” section. The conversion principle that allows each tweet to be
labelled with one of the five emotion categories (i.e., “fear”, “anger”, “sadness”, “joy or other
positive expression”, “no specific emotion”) follows a conceptual simplification that a single
dominant emotion exists for each tweet, though some tweets may express “mixed emotions”
[20], such as express anger and fear simultaneously. Other conversion logic may be explored
in future research. For example, Mohammad et al. [14] suggest to use the mid-scale threshold,
i.e., 0.5, to differentiate high-intensity vs. non-high-intensity emotions. Researchers shall
examine the intended applications and determine the conversion threshold accordingly.
10Topics coverage
We checked the tweets volume related to the top ten identified topic clusters. A vast majority
of tweets were related to two or more topics, which form 60% of the total tweets. The tweets
that solely pertained to “t1” have the highest volume, consisting of 14,467,272 tweets or 23%
out of the total data volume.
Table 7 presents the overall tweet topics statistics. Figure 3 depicts with a visualization of the
topic clusters in the context of the tweets volume.
Table 7. Overall tweets distribution over topic clusters
Tweets related to Volume / no. of Distribution
attributes tweets
two or more topics 38,065,393 60%
t1 only 14,467,272 23%
t2 only 7,345,398 12%
t3 only 2,328,557 4%
t4 only 703,455 1%
t5 only 94,969 0.15%
t6 only 64,236 0.10%
t7 only 56,718 0.09%
t8 only 35,003 0.06%
t9 only 8,890 0.01%
t10 only 31,075 0.05%
other single topics 146,134 0.23%
total 63,347,100 100%
Figure 3. The ten topic clusters showing different issues surfaced in the total tweets
11Sentiment intensity and sentiment category coverage
The quantitative “sentiment_intensity” averaged for the full dataset is 0.460, with the most
negative tweet having its valence intensity score of -0.058, and the most positive tweet having
its valence intensity score of 0.989 (Table 8).
Table 8. Sentiment intensity descriptive statistics
Attribute name Mean Standard deviation Median Min Max
valence_intensity 0.460 0.093 0.461 -0.058 0.989
Qualitatively, the counts and distributions for valence intensity score converted into sentiment
categories counts are presented in Figure 4. The results indicate that the majority of the tweets
are “negative” or “very negative”, forming 58% of the total 63,347,100 tweets.
very negative very positive
2,612,518 427,982
positive
4% 1%
15,832,843
25%
negative
34,146,186 neutral
54% 10,327,571
16%
Figure 4. Five sentiment categories tweets count and distribution
Plotting the “sentiment_category” values over daily aggregated tweets counts suggested
more nuanced patterns (see Figure 5). For example, the single-day peak during this period was
1,075,087 tweets (629,938 were “negative” tweets and 65,165 were “very negative” tweets),
which took place on 13 March 2020, one day immediately following WHO’s announcement on
the disease as a “pandemic”. Further analysis may look into, for example, the sentiment
changes before and after more targeted time periods based on critical announcements (e.g.,
to study a week before and after 13 March 2020). The dataset may also allow for further
research to explore the correlations and predictive values based on the sentiment and
emotion scores, when over-laid with economic indicators (e.g., stock market changes).
WHO announces the COVID-19 outbreak as a “pandemic” (12 March 2020)
Figure 5. Five sentiment categories in stacked chart showing their evolvement over time
12Emotion intensity and dominant emotion category coverage
Using the four quantitative emotions intensities attributes, overall statistics show that
“fear_intensity” has the highest mean value of 0.440, closely followed by “anger_intensity” of
0.437. Table 9 reports the descriptive statistics for the four emotions intensity scores.
Table 9. Emotion intensity descriptive statistics
Attribute Mean Standard deviation Median Min Max
fear_intensity 0.440 0.096 0.438 -0.053 1.118
anger_intensity 0.437 0.085 0.433 0.028 1.100
sadness_intensity 0.411 0.078 0.405 0.039 0.968
joy_intensity 0.305 0.091 0.302 -0.091 0.936
Qualitatively, the counts and distribution of the various most dominant emotion categories
based “emotion_category” attribute are presented in Figure 6. The results suggest that, over
the five months in total, tweets that are dominantly expressing “anger” (16,864,419 tweets,
27%) and tweets that are dominantly expressing “fear” (16,668,156 tweets, 26%) formed the
majority of the total tweets.
no specific
emotion
10,327,571, fear
16% 16,668,156,
26%
joy or other
positive
expression:
16,260,825, anger
26% 16,864,419,
sadness 27%
3,226,129, 5%
Figure 6. Count of tweets and distribution of each dominant emotion category
We checked the daily counts of the four emotions for the five-month period (see Figure 7).
The significance of the change can be illustrated using the contrast of results at the start and
at the end of our data range. For example, as at 28 January, a total of 23,405 tweets were
posted for the day, and the tweets with “anger” as the dominant emotion formed 15% of the
total 23,405 tweets, far less than those tweets with “fear” as the most dominant emotion
which formed 53% of the total 23,405 tweets. In contrast, as at 1 July, a total of 432,736 total
tweets were posted for the day, and the tweets with “anger” as the most dominant emotion
formed 30% of the 432,736 tweets, exceeding those tweets with “fear” as the most dominant
emotion, which formed 23% of the 432,736 tweets). The trends surfaced some interesting
patterns: While both “fear” and “anger” dominated in the overall counts, the trend plot shows
that over time, the relative distribution of “fear” has been decreasing and the relative
distribution of “anger” has been increasing; meanwhile, “joy and other positive expressions”
have been increasing, though in a slower rate (See [8] which provides an interpretation based
on analysis of early time coverage of this dataset).
1328 January 2020 1 July 2020
Figure 7. Daily distribution of the four primary emotions over time
Usage Notes
This paper presents a large COVID-19 tweets dataset with additional, psychologically
meaningful attributes. This dataset may create opportunities to understand both global and
local conversations and social sentiments in real time, at a large scale, potentially leading to
very rich insights on human behaviours and behavioural changes surrounding the
unprecedented pandemic. We envisage its potential usage in five broad areas.
First, for media and mass communication research, the dataset can be useful for
communication scientists and professionals in evaluating and improving government
response, policies and media communications towards the unprecedented pandemic crisis.
For example, a recent study compared communications efforts of health authorities in the
United States, the United Kingdom and Singapore on Facebook during the early period of
COVID-19 [21]. As the virus continuously hit different countries in different timeframes and
governments implemented different response strategies and policies, one direction of an
ongoing related work is to overlay the location attribute, examine and compare sentiments,
emotions and topics associated with different countries (e.g., [22]). The dataset may also help
to study how media’s topical and emotional framing in their headlines and titles are different
from those expressed by the general public.
Second, the dataset is of inherent interest for psychology research. The granularity of the
tweets metadata in terms of “tweet_created_at” and “user_ID” may allow researchers to dive
deeper of the more nuanced trends with deeper psychological accounts and insights. One
possibility is to look into the sentiments and emotions differences over more fine-grained
timelines, examine cultural differences, and segregate the users which are influencers vs the
general public. Future research may also look into leveraging user characteristics inference
techniques (e.g., [23]) and the present dataset to investigate user community-specific
tendencies and issues.
Third, as the pandemic escalates in its severity and geographical span, and is likely to last for
a prolonged period, public mental health issues (e.g., [24]) are more prevalent. The dataset
may be used to examine public mental wellbeing. Prior literature (e.g., [25, 26]) has
established the linkage between fear (as an emotion) and anxiety (as a mental disorder), and
between sadness (as an emotion category) and depression (as a mental disorder). Hence it can
be fruitful to study the value of the emotion intensity scores and their trends in the context of
its duration, frequency and in relation to various user communities.
14Fourth, it is potentially useful to overlay publicly available economic indicators (e.g., daily stock
market data, monthly unemployment rates reports), and investigate in more depth on how
the twitter topics, sentiments and emotions trends present predictive value in future research.
Last but not least, data scientists and epidemiology researchers may find the dataset useful.
For example, prior research in Zika [27] and other infectious disease outbreaks [28] have
studied and found useful insights in overlaying with air travel networks and virus genome.
Hence the dataset may contribute towards revealing more hidden patterns and relationships
of the large-scale social media content and other pandemic-related data streams.
Code Availability
The source scripts for the trained LDA-based topic model are available at our GitHub page:
https://github.com/ajvish91/covid_twitter_scripts. Info on CrystalFeel can be accessed from:
https://socialanalyticsplus.net/crystalfeel. Its access is available upon request from the
corresponding author.
Acknowledgements
This work is supported by the Agency for Science, Technology and Research (A*STAR) under
its A*ccelerate Gap Fund (ETPL/18-GAP050-R20A & ETPL/18-GAP052-R20A), the Singapore
Ministry of Health’s National Medical Research Council under its COVID-19 Research Fund
(COVID19RF-005) and the Institute of High Performance Computing, A*STAR under its Core
Fund. The authors thank Anita Sheldenkar, Brandon Loh, Cui Mengyang, Gangeshwar
Krishnamurthy, Lim Keng Hui, Jiahui Lu, Joseph JP Simons, May Oo Lwin, Nur Atiqah Othman,
Paul E. Cain, Sebastian Maurer-Stroh, Therese Quieta, Thomas Vuong, Tuan Le Mau, Wan Kum
Seong, Wong Chi Kit, and Zhang Mila, for helpful discussions. We are grateful for the help from
Nur Atiqah Othman for her proofreading which helped to enhance the clarity of the paper. All
errors that remain are our sole responsibility.
Author Contributions
RG acquired the data and extracted sentiment and emotions features. AV extracted topic
clusters features. YY initiated, conceptualized, and led the manuscript. All authors performed
data analysis, contributed to the manuscript writing, reviewed the content and agreed with
the submission.
Competing Interests
The authors declare the following competing interests: RG and YY are co-inventors of the
CrystalFeel tool which was used to extract the sentiment and emotion related attributes. No
other conditions or circumstances present a potential conflict of or competing interest for the
other authors.
References
1. World Health Organization, Coronavirus disease 2019 (COVID-19) Situation Report – 163
on 1 July 2020 https://www.who.int/docs/default-source/coronaviruse/situation-
reports/20200701-covid-19-sitrep-163.pdf?sfvrsn=c202f05b_2 (2020).
2. Bavel JJV, Baicker K, Boggio PS, Capraro V, Cichocka A, Cikara M, et al. Using social and
behavioural science to support COVID-19 pandemic response. Nat Hum Behav. 4, 460–
471(2020).
3. Holmes EA, O'Connor RC, Perry VH, Tracey I, Wessely S, Arseneault L, et al.
Multidisciplinary research priorities for the COVID-19 pandemic: a call for action for
mental health science. Lancet Psychiatry (2020).
154. Clement, J. Number of monetizable daily active Twitter users (mDAU) worldwide from 1st
quarter 2017 to 1st quarter 2020
https://www.statista.com/statistics/970920/monetizable-daily-active-twitter-users-
worldwide (2020).
5. Twitter, COVID-19 Stream https://developer.twitter.com/en/docs/labs/covid19-
stream/overview (2020).
6. Abd-Alrazaq A, Alhuwail D, Househ M, Hamdi M & Shah Z. Top Concerns of Tweeters
During the COVID-19 Pandemic: Infoveillance Study. J Med Internet Res. 22 (2020).
7. Budhwani H & Sun R. Creating COVID-19 Stigma by Referencing the Novel Coronavirus as
the “Chinese virus” on Twitter: Quantitative Analysis of Social Media Data. J Med Internet
Res. 22 (2020).
8. Lwin MO, Lu J, Sheldenkar A, Schulz PJ, Shin W, Gupta R, & Yang Y. (2020). Global
Sentiments Surrounding the COVID-19 Pandemic on Twitter: Analysis of Twitter Trends,
JMIR Public Health Surveill 6 (2020).
9. Twitter standard search API
https://developer.twitter.com/en/docs/tweets/search/overview/standard (2020).
10. Blei, D. M., Ng, A. Y., & Jordan, M. I. Latent dirichlet allocation. Journal of Machine
Learning Research, 3, 993-1022 (2003).
11. Hoffman, M., Bach, F. R. & Blei, D. M. Online learning for latent dirichlet allocation. In
Advances in Neural Information Processing Systems, 856-864 (2010).
12. CrystalFeel - Multidimensional Emotional Intensity Analysis. Institute of High Performance
Computing, A*STAR. https://socialanalyticsplus.net/crystalfeel (2020).
13. Gupta, R.K. & Yang, Y. Understanding and Detecting Intensity of Emotions using Affective
Lexicons, In Proceedings of the 12th International Workshop on Semantic Evaluation
(NAACL-SemEval) (2018).
14. Mohammad, S., Felipe Bravo-Marquez, Mohammad Salameh & Svetlana Kiritchenko.
SemEval-2018 task 1: Affect in tweets. In Proceedings of the 12th International Workshop
on Semantic Evaluation (NAACL-SemEval). (2018).
15. GeoNames, GeoNames Geographical Database
http://download.geonames.org/export/dump/cities15000.zip (Accessed on 15 Feb 2020)
16. Chang, J., Gerrish, S., Wang, C., Boyd-Graber, J. L. & Blei, D. M. Reading tea leaves: How
humans interpret topic models. In Advances in Neural Information Processing Systems,
288-296 (2009).
17. Gupta, R.K. & Yang, Y. Predicting and Understanding News Social Popularity with
Emotional Salience Features, In Proceedings of the 27th ACM International Conference on
Multimedia 2019 (ACM MM) (2019).
18. Gupta, R.K., Bhattacharya, P. & Yang, Y. What constitutes happiness? Predicting and
characterizing the ingredients of happiness using emotion intensity analysis, In
Proceedings of the AAAI-19 Workshop on Affective Content Analysis (AAAI-AFFCON)
(2019).
19. Krishnamurthy, G., Gupta, R.K. & Yang, Y. Detecting propaganda in news articles using
sentence-level emotional salience features, In Proceedings of the 14th International
Workshop on Semantic Evaluation (COLING-SemEval) (2020). Forthcoming. Preprint at:
https://arxiv.org/abs/2008.13012
20. Berrios, R., Totterdell, P., & Kellett, S. Eliciting mixed emotions: a meta-analysis comparing
models, types, and measures. Frontiers in Psychology, 6, 428 (2015).
21. Sesagiri Raamkumar A, Tan SG & Wee HL. Measuring the Outreach Efforts of Public Health
Authorities and the Public Response on Facebook During the COVID-19 Pandemic in Early
2020: Cross-Country Comparison. J Med Internet Res 22 (2020).
22. Lwin MO, Lu J, Sheldenkar A, Schulz PJ, Shin W, Gupta R & Yang Y. The evolution of public
sentiments during the COVID-19 pandemic: A case comparison of Italy, Singapore, South
16Korea, and the United States, Working Manuscript (under review at Frontiers in Public
Health)
23. Volkova, S., Bachrach, Y., Armstrong, M. & Sharma, V., March. Inferring latent user
properties from texts published in social media. In Proceedings of Twenty-Ninth AAAI
Conference on Artificial Intelligence (2015).
24. Luo, M., Guo, L., Yu, M. & Wang, H. The Psychological and Mental Impact of Coronavirus
Disease 2019 (COVID-19) on Medical Staff and General Public – A Systematic Review and
Meta-analysis, Psychiatry Research 291 (2020).
25. Öhman, A., Fear and anxiety. Handbook of Emotions, 709-729. (2008).
26. Karp, D.A., Speaking of sadness: Depression, disconnection, and the meanings of illness.
(Oxford University Press, 2017).
27. Grubaugh ND, Saraf S, Gangavarapu K, et al. Travel Surveillance and Genomics Uncover a
Hidden Zika Outbreak during the Waning Epidemic, Cell 178 1057-1071 (2019).
28. Tatem AJ, Rogers DJ & Hay SI. Global transport networks and infectious disease spread.
Adv Parasitol 62 293–343 (2006).
17You can also read