Managing Bad News in Social Media: A Case Study on Domino's Pizza Crisis
←
→
Page content transcription
If your browser does not render page correctly, please read the page content below
Proceedings of the Sixth International AAAI Conference on Weblogs and Social Media

    Managing Bad News in Social Media: A Case Study on Domino’s Pizza Crisis

                            Jaram Park           Meeyoung Cha                Hoh Kim          Jaeseung Jeong
                                            Graduate School of Culture Technology, KAIST
                                                     291 Daehak-ro, Yuseong-gu
                                                     Daejeon, Republic of Korea

                            Abstract                                         social media. From a corporate point of view, the “diffu-
     Social media has become prominently popular. Tens of                    sion of bad news” often means a crisis, having a negative
     millions of users login to social media sites like Twitter              impact on brand reputation, word-of-mouth advertisements,
     to disseminate breaking news and share their opinions                   and even sales. Before the social media era, companies used
     and thoughts. For businesses, social media is poten-                    to respond to bad news by releasing position statements or
     tially useful for monitoring the public perception and                  public apologies via traditional media within days to weeks.
     the social reputation of companies and products. De-                    Nowadays, however, the public expects companies to apol-
     spite great potential, how bad news about a company                     ogy promptly (within 24 hours) and response directly via
     influences the public sentiments in social media has not                 social media—the channel in which a crisis occurs.
     been studied in depth. The aim of this study is to assess
     people’s sentiments in Twitter upon the spread of two                      Therefore, companies are interested in knowing how bad
     types of information: corporate bad news and a CEO’s                    news spreads in social media. Their major concerns are on
     apology. We attempted to understand how sentiments                      knowing how people’s feelings propagate, what influences
     on corporate bad news propagate in Twitter and whether                  the public sentiment, and how it impacts corporate repu-
     any social network feature facilitates its spread. We in-               tation. Several recent work have paid attention to analyz-
     vestigated the Domino’s Pizza crisis in 2009, where bad                 ing public sentiments in social media. Studies have shown
     news spread rapidly through social media followed by                    that online communities like Twitter can be used for pre-
     an official apology from the company. Our work shows                     dicting election results (Tumasjan et al. 2010) or even stock
     that bad news spreads faster than other types of infor-
                                                                             prices (Bollen, Mao, and Zeng 2011). Another study ex-
     mation, such as an apology, and sparks a great degree
     of negative sentiments in the network. However, when                    amined how sentiments embedded in online content affect
     users converse about bad news repeatedly, their negative                the persistence of information, measured by decay time in
     sentiments are softened. We discuss various reactions                   the spread (Wu et al. 2011). However, sentiment analysis
     of users towards the bad news in social media such as                   in the spread of corporate bad news, in particular, has not
     negative purchase intent.                                               been studied. Understanding the diffusion dynamics of bad
                                                                             news in social media is important for crisis communication,
                                                                             as such knowledge can help companies and the government
                        Introduction                                         respond appropriately to crisis situations.
Social media is bringing a major headache to the corporate                      One of the first companies to experience a serious and
world because it has been shown to facilitate the spread bad                 global damage in its reputation due to the spread of bad news
news. In January 2012, a Korean-American female cus-                         in social media is Domino’s Pizza. The crisis started when
tomer, who visited Papa John’s Pizza in New York, discov-                    two employees produced and uploaded a vulgar YouTube
ered that the cashier identified her as “lady chinky eyes” on                 video in 2009. Within a few days, the video gained more
her receipt. She tweeted about the negative experience via                   than half a million views, major news media covered the
Twitter that morning, and a local newspaper picked up the                    event, and people started to discuss the incident on social
story. Within a few days, the news was reported not only                     media. Domino’s soon released a YouTube video where its
in the US newspapers and broadcasts like CNN, but it also                    CEO apologized and explained the situation.
spread to other countries. The employee was fired, Papa
                                                                                We paid attention to the Domino’s crisis in Twitter, be-
John’s in the US apologized, and even Papa John’s in Ko-
                                                                             cause from the beginning to the end the medium played a
rea had to apologize to Korean customers. This news started
                                                                             central role in spreading both the bad news and the apology.
from one tweet by a customer in New York, but its impact
                                                                             First, the crisis started in YouTube, but soon it was picked up
reached all the way to Asia (ABC 2012).
                                                                             by users in various social media sites. Twitter was one of the
   In the past, only elite journalists could break bad news.
                                                                             key places where discussions took place. Based on our es-
Nowadays, anyone can produce bad news and spread it in
                                                                             timation, more than 15,000 Twitter users posted a message
Copyright  c 2012, Association for the Advancement of Artificial             about the event. Second, Domino’s apologized on Twitter
Intelligence (www.aaai.org). All rights reserved.                            by sharing a link to its CEO’s apology on YouTube.

                                                                       282
Similar corporate crises have occurred causing dire conse-           tempts to provide a holistic view of the crisis event in social
quences to various companies. Interestingly, however, crisis            media through both quantitative and qualitative analyses.
communication researchers have not yet conducted a sys-
tematic analysis of public sentiments in social media (Jin                                  Case Description
and Pang 2010). By conducting an in-depth analysis of pub-
                                                                        On April 13th, 2009, two employees of Domino’s Pizza in
lic sentiments in Twitter related to the Domino’s Pizza crisis,
                                                                        Conover, North Carolina, filmed a prank in the restaurant’s
we attempted to answer the following three questions:
                                                                        kitchen and posted a video on YouTube, showing vulgar acts
1. What are the temporal and spatial diffusion characteristics          while making sandwiches. The employee in the video put
   in the spread of corporate bad news?                                 cheese up his nose, nasal mucus on the sandwiches, and vio-
2. How does the network structure determine the reactions               lated other health-code standards, while his fellow employee
   of socially connected users?                                         provided commentary. The URL of this video rapidly spread
                                                                        via online social media, especially through Twitter, as soon
3. What kinds of negative and positive sentiments are por-              as it appeared. The video was viewed more than half a mil-
   trayed in Twitter conversations?                                     lion times in the following two days and prompted angry
   This study makes three contributions. First, we demon-               reactions from the customers and from social media users.
strate the benefits of analyzing the actual social media con-               Two days later, on April 15th, the president of Domino’s,
versations on a crisis situation. Before social media existed,          Patrick Doyle, shot a video directly apologizing about the
it was extremely difficult for researchers and companies to              incident and uploaded the apology on YouTube. Domino’s
examine the actual conversations during crises. Social me-              also created a Twitter account with username @dpzinfo to
dia is hence called “the world’s largest focus group,” and the          actively address the comments and share the apology video
importance of decoding its content for businesses is being              link. The apology video also spread through social media.
recognized (Talbot 2011).                                               The original prank video was removed from YouTube be-
   Second, this is one of the first studies to conduct a sys-            cause of a copyright claim, but its aliases or copies remained
tematic analysis of sentiments during a crisis situation. Re-           both inside and outside the YouTube community and contin-
searchers have pointed out the lack of systematic under-                ued to circulate. The company prepared a civil lawsuit, and
standing of emotions in crisis communication research and               the two employees were faced with felony charges for deliv-
have suggested analysis of emotions as an important future              ering prohibited foods to customers.
research direction in the area (Jin and Pang 2010).
                                                                        Twitter Data In order to examine the global spreading
   Third, we not only analyzed how bad news spread in so-
                                                                        pattern in the network, it is important to have access to all
cial media but also analyzed the influence of a corporate
                                                                        the tweet posts and the social network topology during the
apology in social media. We used multiple methods, both
                                                                        event period. This is because using sample tweets will not
quantitative and qualitative, to obtain a balanced view.
                                                                        only increase biases in the measured sentiments but also re-
                                                                        sult in fragmentation of information propagation patterns. In
                      Related Work                                      this work, we obtained and used the near-complete Twitter
In the past, it took a long time for companies to apologize             data in (Cha et al. 2010).
for mistakes. Nowadays, the reaction is quicker. As so-                    The data consists of information about 54 million users,
cial media plays a major role in the diffusion of bad news              1.9 billion social links, and 1.7 billion tweets. The follow
and crisis communication, companies have started to lever-              links are based on a topology snapshot taken in the summer
age social media in responding to corporate crises, such as             of 2009, a few months after the Domino’s event. The 1.7
CEO’s apologies using YouTube: David Neeleman, former                   billion tweets include all public tweets that were ever posted
Chairman of JetBlue Airways responding to its Valentine’s               by the 54 million users. Each tweet entry contains the tweet
day crisis in 2007; Bob Eckert, CEO of Mattel responding                content as well as the corresponding time stamp.
to its millions of toy recalls; and Patrick Doyle, President               We extracted tweets that contained the word “domino”
of Domino’s Pizza responding to its prank video crisis. The             for an eight-day period from April 13th, 2009. A total of
work in (Efthimious 2010) analyzed the case of JetBlue Air-             19,328 tweets were identified in this way. This extraction
ways, and the work in (HCD a) analyzed how people’s per-                method incurs both false positives (i.e., irrelevant tweets
ception changed after viewing the CEO’s apologies of Mat-               about the event containing the keyword) and true negatives
tel and Domino’s. They found positive effects of the CEO’s              (i.e., tweets about the event that do not include the keyword).
apologizing via YouTube.                                                In order to mitigate the error, we resorted to examining the
   Nonetheless, many scholars have pointed out the lack of a            tweet content and utilized the fact that the majority (60%) of
scientific approach in crisis communication research. Case               these tweets contain a URL. We chose URLs that appeared
studies have been a major research method in this area, yet             more than 10 times and searched for tweets containing them
it has been judged that more than half of them failed to                from the entire Twitter data without necessarily mentioning
describe a reliable data gathering method and only about                the keyword. Encompassing the 1,445 true negative tweets
13 percent proposed research questions or hypotheses (An                found in this fashion, we analyzed a total of 20,773 tweets
and Cheng 2010). In that context, the work in (Coombs                   in this work.
2008) emphasized the importance of building evidence-                      Table 1 displays the number of users, tweets, mentions,
based knowledge for crisis management. This paper at-                   re-tweets (RTs), and tweets with URls on the Domino’s case.

                                                                  283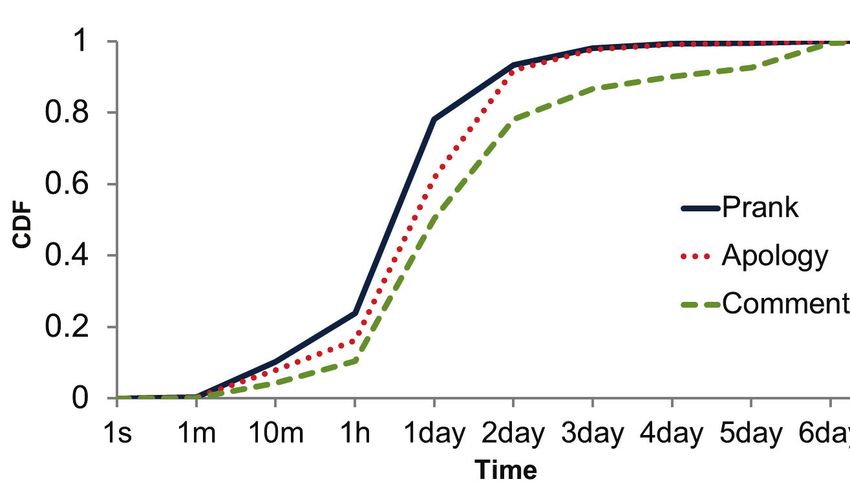
Figure 1: Temporal evolution of the positive and negative sentiment scores

The number of users who posted at least one tweet is 15,513.             sentiment scores. Therefore, we do not attempt to retrieve a
We found that 4,990 or 24% of the tweets were mentions,                  meaningful sentiment score of a single tweet nor try to infer
including @username in the tweet. This implies that a lively             the moods of individuals. Since the LIWC tool calculates
conversation took place among the Twitter users. We also                 the sentiment scores based on just word count, capturing the
found that 2,673 or 13% of the tweets were re-tweets. The                subtle mood changes or the differences in tone of voice was
most prolific tweet had been re-tweeted over 500 times.                   not possible. Therefore, qualitative content analysis of sen-
                                                                         timent propagation was needed, and we will show the results
 # users    # tweets    # mentions     # RTs      URL (%)                at the end of this paper.
 15,513      20,773       4,990        2,673    13,132 (63%)
                                                                         Overall Trend The bar plot in Figure 1 shows the daily
              Table 1: Summary of the data set                           number of tweets containing the word “domino” through-
                                                                         out the month of April in 2009. On the day after the prank
                                                                         video was uploaded, the number of tweets about Domino’s
Sentiment Analysis Tool In order to quantitatively mea-                  Pizza increased to over 2,500 tweets per day, which is five
sure the mood changes of Twitter users, we used Linguis-                 times larger than in the previous week. Only for two days
tic Inquiry and Word Count (LIWC), which is a transpar-                  (April 14th and 15th) right after the employees posted the
ent text analysis program that counts words in psycholog-                prank video on April 13th, there were nearly 7,000 tweets.
ically meaningful categories. The LIWC dictionary in-                    When we account for the sheer size of the audience, a total of
cludes around 4,500 words and word stems. It has been                    16,553,169 or 30% of all Twitter users were exposed to the
widely used by many social media researchers for senti-                  news during an eight-day period (April 13th–20th, 2009).
ment analysis (Tumasjan et al. 2010; Wu et al. 2011;                        The line plots in Figure 1 show the level of positive af-
Golder and Macy 2011). This program shows the propor-                    fect (blue solid line) and negative affect (red solid line with
tion of words that is related to each category (e.g., affect,            markers) embedded in tweets over the same time period.
cognition) in an input file. Empirical results demonstrate                Twitter users exhibited a stronger positive affect towards
that LIWC can detect meanings in a wide variety of ex-                   Domino’s Pizza except for during the three peak days. Based
perimental settings, including attention focus, emotionality,            on a randomly chosen set of 10,000 tweets from the same pe-
social relationships, thinking styles, and individual differ-            riod, the level of positive and negative affects were 4.24 and
ences (Tausczik and Pennebaker 2010).                                    1.65, respectively.
   In this work, we focused on the affective psychological                  Figure 1 shows the overall trend. We find that the amount
process and examined the fraction of words in tweets that                of conversations and negative sentiments suddenly and sig-
are related to the positive and negative affects. Note that typ-         nificantly increased right after the crisis event was triggered
ically, the levels of positive and negative affects are indepen-         via social media. The amount and the negative sentiments,
dent (Golder and Macy 2011). There are some limitations in               however, dropped right after the CEO posted an apology
using LIWC for sentiment analysis in Twitter. According to               video, indicating that the CEO’s apology video was an ap-
the LIWC provider, the input file should contain more than                propriate response from a crisis management practice point
50 words for accurate analysis. In practice, tweets written in           of view. In fact, the apology is considered a reasonably fast
fewer than 50 words yield extremely high or extremely low                one (within 48 hours) although it could have been faster.

                                                                   284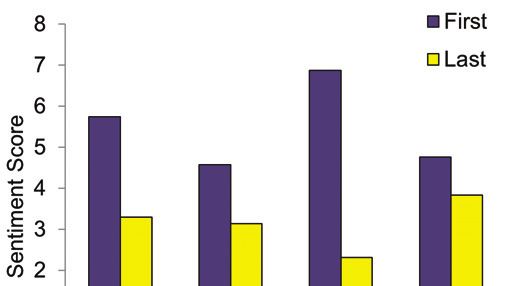
Num       Num       Num         Med        Audience         LCC         Avg       Node     Clustering   Diameter     Path
    Type         URLs     tweets   spreaders   followers      size          (edges)     degree    density   coefficient     hop       length
   Prank          24       2230      2078         169       2204175       42% (99%)       5.3      0.001      0.071         10         3.4
  Apology         15        771       707         351        542161       82% (99%)       7.2      0.008      0.230         7          2.7
 Commentary       44       1641      1608         367       4706032       89% (99%)      14.5      0.008      0.233         9          2.8
Table 2: Spatial characteristics of the users who spread Web links to the prank video, apology video, and critiques, respectively.

     Characteristics of Bad News Spreading                               users who could have received URLs on the Domino’s event
                                                                         through Twitter.
We examine the temporal and spatial characteristics in the
spread of Domino’s news. In order to identify bad news, we                  Hundreds to thousands of users posted URLs on the
manually inspected the URLs embedded in tweets. Given                    Domino’s event, and more people (47%) participated in
that the majority of tweets (63%) contained a URL, we only               spreading the prank video than in spreading the apology
considered those tweets that contained a URL that appeared               video or commentaries. However, the median number of
more than 10 times during the trace period. There were                   followers was the smallest for the prank network, indicat-
90 distinct URLs, and the most popular one appeared 561                  ing that the bad news was shared by less connected users
times. After manual inspection, we classified these URLs                  compared to those who spread the apology news or com-
into three representative categories. Seven out of 90 URLs               mentaries.
did not belong to the main categories and were discarded in                 Several spreaders in each of these networks had very large
the analysis. The three categories are:                                  indegrees. As a result, the size of the audience is three orders
                                                                         of magnitude larger than that of spreaders and reaches from
• Prank: There were 24 URLs on the prank video, either                   half a million to nearly 5 million users on Twitter.
  containing a link directly to the YouTube video or con-                   The second set of statistics is on the largest connected
  taining a link to news or blog articles which had the link             component (LCC) of each of these networks. We focus on
  to the prank video, e.g., “U need 2 look @ this especially             connected users because they have a high chance of having
  if u eat at domino’s http...” and “Be careful before order-            read about the Domino’s event through followers in Twitter
  ing Domino’s: http..”                                                  before their posts.1 Hence, the LCC can be viewed as an
• Apology: There were 15 URLs on the apology video, ei-                  active community that voiced the event. We show the frac-
  ther a direct link or a link to a website with relevant infor-         tion of users and edges belonging to the LCC, the average
  mation, e.g., “Domino’s President responds http...” and                degree, density, and clustering coefficient of nodes, as well
  “Excellent 2-min video on YouTube from Patrick Doyle.                  as the diameter and the average path length.
  Congrats on this move http...”                                            The prank network varied in its shape compared to the
                                                                         apology and commentary networks. Fewer than half of the
• Commentary: When a crisis happens, journalists, cri-                   nodes formed the LCC in the prank network, while a great
  sis management consultants, and consumers write various                majority (over 80%) formed the LCC in the two other net-
  articles to show their points of view on the event. Fur-               works. Furthermore, users in the LCC had sparse connec-
  thermore, Twitter users often spread the commentaries by               tions in the prank network compared to in the two other net-
  linking the URLs. There were 44 URLs on the commen-                    works, as seen from small average node degree, density, and
  tary in total, e.g., “Apropos to the #dominos fallout, How             clustering coefficient values. The commentary network was
  to weather a #twitter storm http...” and “RT @briansolis:              the most well connected; its nodes had 13 edges on average.
  The Domino’s Effect http...”                                           The diameter of these networks similarly ranged from 7 to
   For each of these categories, we constructed a social net-            10, and all three networks had short average path length of
work of users who tweeted about Domino’s event based on                  between 2.7 and 3.4.
their follow link relationships. A large fraction of users in               We discuss three implications of the findings. First, it is
each of these networks were connected to each other by                   common sense that more people pay attention to an event in
Twitter’s follow links and formed one large weakly con-                  the beginning of a crisis, rather than later when companies
nected component. However, some users were singletons                    respond to the crisis. Table 2 confirms this implication. The
and others formed small communities of their own and were                prank network receives the most number of spreaders and
not connected to the majority of users who talked about the              tweets compared to the other networks.
crisis.                                                                     Second, while the prank video was more popular than the
                                                                         apology or commentaries, the median numbers of followers
Spatial Characteristics Table 2 displays the characteris-                in the apology and commentary networks far exceed that in
tics of the prank, apology, and commentary networks. The                 the prank network. We can reasonably assume that while
first set of statistics are on the number of URLs, the number             normal consumers or the average Twitter users would pay
of tweets, the number of users who posted the URLs (whom                 more attention to the prank video, experts such as journal-
we call “spreaders” for convenience), the median number
of Twitter users who follow these spreaders, and the unique                 1
                                                                             This intuition is based on the extremely low probability for
number of total followers of these spreaders (whom we call               when any two randomly chosen users are connected and have
“audience”). Audience represents the maximum number of                   shared similar content in the Twitter network.

                                                                   285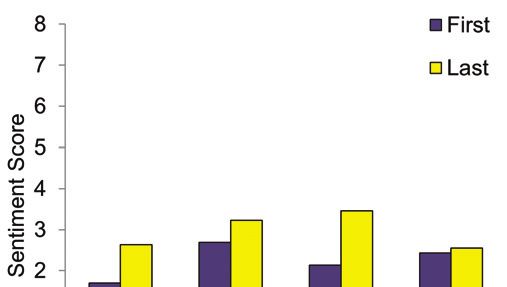
ists, marketing consultants, and power bloggers would pay                 fuse. The median spreading times were 8.0, 19.3, and 23.8
close attention to how companies or the public respond to                 hours for the prank, apology, and commentary networks, re-
the crisis. These experts spread corporate responses and                  spectively. Based on the 95th percentile values, the prank
commentaries, and they likely have more connections than                  and apology news slowed down quickly in their spreading
people who simply spread the bad news. We could observe                   rates after 2.2-2.4 days. However, the commentary news
this power of influence, as the apology and commentary                     continued to spread actively for up to 5.4 days.
networks had denser connections than the prank network.                      Our temporal analysis has several implications. Consider-
These experts would more likely be opinion sharers who                    ing the speed of spreading, we can conclude that more peo-
share their point of view, rather than information sharers                ple deliver bad news “faster” to more friends. Also, com-
who simply deliver news.                                                  pared to other types of news, commentary tweets stayed and
   Third, Pete Blackshaw, the executive vice president of                 spread for a longer period of time (more than twice the time)
digital strategy services for Nielsen Online, wrote a book                and reached a large audience. This means that when it comes
with an exaggerated title, “Satisfied Customers Tell Three                 to commentary, more people share conversation with others
Friends, Angry Customers Tell 3,000” (Blackshaw 2008).                    for a longer time period.
Crisis management consultants used to say that people de-
liver bad news than good news to more friends. Our anal-                    Social Network Determinants in Spreading
ysis confirms the overall trends. Considering the audience                 The most important characteristic of Twitter is that its users
size and the number of spreaders, one spreader tells about                are linked to each other based on the follow feature. Under
the prank video to 1,061 (2204175/2078) people in the audi-               this circumstance, we tried to identify the factors that are
ence, but the apology video to 766 (542161/707) people on                 related to the structure of social network and the interaction
average. From the difference in the number of spreaders be-               of users that could affect sentiment propagation.
tween the prank and the apology, we can conclude that more                   In this section, we limit our focus to the sentiment of peo-
people deliver bad news to more friends.                                  ple in respect to the bad news. Therefore, we only consid-
Diffusion Time Lag Given that web links are discovered                    ered tweets that were posted within the first 48 hours of the
at different rates depending on their topics, we next examine             event prior to the CEO’s apology from April 13th to 15th.
how the tweets containing the same URL are correlated in                  We grouped tweets by the hour of their post time and ig-
time. To understand this, we identify the follow links that               nored the time window with fewer than 100 tweets. In total,
could have been used for information diffusion. We say a                  we took 23 valid time windows and analyzed sentiments of
piece of information diffused from user A to B if and only                the tweets in each time window.
if (1) B follows A on Twitter, and (2) B posted the same                  Connected Users We asked whether the social network
URL only after A did so. Then the diffusion time for a piece              structure or user interactions in Twitter can influence pub-
of information to cross a social link is calculated as the time           lic sentiments (i.e., positive or negative psychological af-
difference between the tweet posts of A and B. In case a                  fects) on corporate bad news. Using LIWC, we conducted
user has multiple possible sources, we pick the user who                  sentiment analysis considering different types of user rela-
posted the same URL the latest as the source.                             tionships. We examined the difference by comparing the
                                                                          sentiments of tweets generated by users who independently
                                                                          talked about the event against those generated by users who
                                                                          had at least one friend who talked about the same event. We
                                                                          classified users into two types as follows:
                                                                          • Isolated users: those who tweeted independently about
                                                                             the Domino’s event and did not follow any other user who
                                                                             tweeted about the same event
                                                                          • Connected users: those who are connected to other users
                                                                             who tweeted about the Domino’s event

                                                                                                  # tweets    # RTs     # mentions
                                                                               Isolated users      2,718       243         684
Figure 2: Time taken for information to cross a social link                   Connected users      2,009       559         535
                                                                                   Total           4,727       802        1,219
   Figure 2 shows the cumulative distribution function of the               Table 3: Statistics for the isolated and connected users
social diffusion times. We find that the spreading time varies
widely in all three networks. A non-negligible fraction of                   We compared the difference in sentiments of the isolated
tweets (10-25%) spread within an hour and the majority less               users with the connected users. Two-sample t-tests were per-
than a day to cross a social link, indicating a rapid social dif-         formed, which showed that there was no significant differ-
fusion process. Some tweets took several days to be found,                ence between the two groups in both positive sentiments and
possibly because these users did not login to Twitter every               negative sentiments (p>.05). This observation indicates that
day. Notably, the prank video took the shortest time to dif-              there is no statistically meaningful level of influence of a

                                                                    286
social link in the propagation of sentiments shared by two his personal thoughts (i.e., statement tweet) on the Domino’s
connected users. That is to say, the users that tweeted about incident two times and retweeted another user’s tweet once,
the Domino’s Pizza incident had similar sentiments, whether than he is categorized as the retweet interaction group.
they were linked to each other or not. Figure 4 shows the sentiment scores of the first tweet and
Note that our finding does not deny the high level of the last tweet of users in a given interaction group. Compar-
assortativity observed in the everyday mood of social net- ing the first tweet and the last tweet for each user, we found
work users, where researchers found that happy or unhappy that the overall negative sentiment decreased with repeated
people form clusters in the offline contact network (Fowler, interaction. In contrast, the positive sentiment increased
J.H. and Christakis 2008) as well as in the online counter- slightly with repeated interaction. Users who only posted
part (Bollen et al. 2011). Our finding rather supports that statement tweets showed the least variations in their moods
while there might be a great level of homophily in the gen- over time compared to those who interacted with others.
eral mood of users who are connected in social networks,
the collective sentiments on a particular topic are strikingly
in tune with one another regardless of social distance. For
instance, people would collectively feel sad towards disas-
ters like an earthquake. In the case of Domino’s Pizza, most
people felt disgusted watching the prank video; hence, their
sentiments were similar irrespective of social distance.
Interacted Users Next, we examined the various types of
user interactions on Twitter such as retweets and mentions to
determine whether tweet sentiments are affected by user in-
teractions. Figure 3 shows the level of positive and negative (a) Positive sentiment (b) Negative sentiment
sentiments among different interaction groups. According
to the results of analysis of variance, the tweets that were Figure 4: Sentiment difference by repeated interactions
retweeted had more negative sentiment words compared to
tweets without any interaction (called “statement” in the fig-
ure) tweets (pexcluded because of their ambiguity in whether they refer to The 1st peak The 2nd peak
the crisis or not. From the 860 tweets, 117 tweets (53 from Facts 57 (16.7%) 160 (39.9%)
the 1st peak and 64 from the 2nd peak) were considered as Positive opinions 2 (0.6%) 22 (5.5%)
irrelevant and thus, excluded. Negative opinions 283 (82.8%) 219 (54.6%)
Total 342 (100%) 401 (100%)
Results We identified two types of tweet content: facts
and opinions. Tweets on facts have no sentiments, but sim- Table 4: Tweets on facts versus opinions
ply state the event. This category included mere links with-
out any text, links with the same headline of the linked web-
site, or simple introductions of the link. Examples are: 1. Future intent: Some users showed that in the future they
“Shared: Dominos Pranksters Done In By Crowdsourc- will not to eat at Domino’s, for example,
ing: Teens have long used YouTube to post videos of “No more Domino’s at my house”
them.. http://tinyurl.com/dx8kln”
“and I don’t think I will be eating Domino’s again...
“Searched Twitter for dominos: *throw up in my mouth*.”
http://tinyurl.com/c4s4lx”
2. Persuasion: Some recommended others not to eat at
“See the video: http://ping.fm/9Eybi” Domino’s, for example,
During the 1st peak (right after the launch of the prank “This Is Why You Never Eat Dominos Pizza
video), 57 out of the 342 relevant tweets (16.7%) were cate- http://tinyurl.com/d22ubr”
gorized as facts, while in the 2nd peak (right after the launch
of the apology video), 160 out of the 401 relevant tweets “If you didn’t have a reason to not eat Domino’s
(39.9%) were facts. pizza http://tinyurl.com/cd62h3”
The opinions category contained tweets that had either 3. Perception: Some tweets confirmed people’s past nega-
positive or negative sentiments. Because of the nature of tive purchase intent towards Domino’s, such as,
the event, most opinions were negative. However, a few had
“This is why I don’t eat anything from Domino’s
positive sentiments towards the crisis:
pizza http://tinyurl.com/chxbbz”
“Yes, I read the stories about Dominoes on Con-
sumerist today. No, that didn’t stop me from just or- “@TheDLC Due to their disgusting pizza, I also
dering a philly cheesesteak pizza.” haven’t eaten at Domino’s pizza in about 20 years.
Thanks for confirming my decision!”
“RT @BillieGee RT @berniebay I will continue to eat
at Domino’s Pizza. What about you? http://bit.ly/y3T” “Thankfully, due to its psycho anti-abortion founder,
I haven’t eaten a Domino’s pizza in probably 20
Some tweets had both positive and negative sentiments, in years.”
which case the annotator questioned what the major senti-
ment was and then categorized the tweet. For example, the We counted the negative purchase intent in two peaks. It
following tweet shows regret in the end. Nevertheless, the significantly dropped from the 1st peak with 129 tweets
tweet was categorized as positive because its major senti- (37.7%) to the 2nd peak with 26 tweets (6.5%).
ment was judged to be positive. Finally, our analysis confirmed that not all tweets men-
“liking the response by dominos... wish he would have tioning the CEO’s apology had a positive sentiment. A total
looked at the camera tho http://tinyurl.com/c8dju3” of 71 tweets (17.7%) talked about the apology, out of which
34 of them (47.9%) exhibited negative sentiments, such as
We make the following observations from Table 4. First,
after the official corporate apology, the level of negative sen- “Too little too late Domino’s http://tinyurl.com/c8dju3”
timents dropped from 82.8% to 54.6%. However, the level “Very insincere response from Domino’s -
of positive sentiments increased marginally from 0.6% to http://ow.ly/31mF. Compare to Jet Blue’s very
5.5%. In crisis management practice, when companies pub- sincere response 2 yrs ago - http://ow.ly/31mV”
licly apologize, they do not have high expectations for re-
and ten tweets (14.1%) were positive, for example,
ceiving praise or suddenly being viewed positively. Rather,
they expect the public’s negative sentiment to calm down “via @hollisthomases http://bit.ly/2lZr8m kudos to
and become more rational because of the apology. Our anal- Dominos for taking swift action via social media in re-
ysis confirms this expectation. The number of factual tweets sponse to the nasty employee videos.”
increased significantly from 16.7% to 39.9%. Therefore, “Impressed w/ Domino’s Response RT @lon-
in Domino’s case, the public apology reduced the amount niehodge:RT @SherryinAL: Dominos posts apology
of negative opinions and increased (neutral) facts in Twitter video on YouTubehttp://bit.ly/2lZr8m”
conversations.
When a crisis like this hits a company, they worry not only while 27 tweets (38%) were factual rather than being opin-
about its reputation damage but also and probably more im- ionated, such as
portantly about its impact on sales. In fact, during the first “Razor Report Blog: Update - Domino’s Responds:
peak, a category on negative purchase intent emerged con- Patrick Doyle, President, Domino’s U.S.A., resp..
taining the following three representative types of opinions: http://tinyurl.com/csls5n”
288“For the PR agencies to analize, Domino’s official re- References
sponse to the video http://tinyurl.com/cr9ak7” 2012. ABC News Papa John’s Employee Calls Woman ‘Lady
Chinky Eyes’ on Receipt. http://tinyurl.com/746lzko.
It is interesting to observe that nearly half of the tweets on An, S.-K., and Cheng, I.-H. 2010. Crisis communication research
apology were negative. Nonetheless, slightly more than half in public relations journals: Tracking research trends over thirty
of such tweets, including facts (38%) or positive opinions years, in The handbook of crisis comm. Handbooks in Comm. and
(14.1%), were non-negative. Media. Wiley-Blackwell.
Blackshaw, P. 2008. Satisfied Customers Tell Three Friends, Angry
Conclusion Customers Tell 3,000. Crown Business.
Bollen, J.; Goncalves, B.; Ruan, G.; and Mao, H. 2011. Happiness
When bad news spread, we could not find any statistically is Assortative in Online Social Networks. Artificial Life 17(3):237–
meaningful influence of sentiments taking place at the so- 251.
cial network level. However, when users interacted with Bollen, J.; Mao, H.; and Zeng, X.-J. 2011. Twitter mood predicts
each other, their sentiments changed significantly. People the stock market. J. Comput. Science 2(1):1–8.
spread and retweeted bad news with negative sentiment, but Cha, M.; Haddadi, H.; Benevenuto, F.; and Gummadi, K. 2010.
interacted with other through mentions with relatively pos- Measuring User Influence in Twitter: The Million Follower Fal-
itive sentiment. We provide one possible explanation for lacy. In Int. AAAI Conf. on Weblogs and Social Media (ICWSM).
this result. As people interact with others in social media, Coombs, W. T., . H. S. J. 2008. Comparing apology to equivalent
they share their feelings and this act could reduce the nega- crisis response strategies: clarifying apology’s role and value in
tive sentiments. For example, it is well known in psychol- crisis comm. Public Relations Review 34:252–257.
ogy that people’s anger could be reduced by simply venting Efthimious, G. 2010. Regaining Altitude: A case analysis of the
their sentiments (Frantz and Bennigson 2005). Also, bad JetBlue Airways Valentine’s Day 2007 crisis, in The handbook of
news spread faster than a corporate response (i.e., apology) crisis comm. Handbooks in Comm. and Media. Wiley-Blackwell.
and by more people, while commentaries resonated in the Fowler, J.H., and Christakis, N. 2008. Dynamic spread of happi-
network for a longer period of time. From our qualitative ness in a large social network: Longitudinal analysis over 20 years
analysis, the negative purchase intent emerged as a major in the framlington heart study. British Medical Journal 337:a2338.
negative sentiment category. The CEO’s YouTube apology Frantz, C., and Bennigson, C. 2005. Better late than early: The
caused a significant decrease in negative sentiments, espe- influence of timing on apology effectiveness. Journal of Experi-
cially the negative purchase intent, and facilitated factual mental Social Psychology 41(2):201–207.
and non-opinionated conversations. Geertz, C. 1973. The interpretation of cultures: selected essays.
Our study has practical implications for crisis managers in Harper colophon books. Basic Books.
businesses. First, when a company makes a mistake and bad Golder, S. A., and Macy, M. W. 2011. Diurnal and seasonal mood
news starts to spread in social media, crisis managers should vary with work, sleep, and daylength across diverse cultures. Sci-
react quickly, admitting mistakes and apologizing appro- ence 333(6051):1878–1881.
priately. Several recent work confirmed the positive effect HCD Research 2007. Majority of Americans Will Continue to Pur-
of CEO’s apologies in social media, Twitter and YouTube, chase Mattel Toys after Recall. http://tinyurl.com/6ujmcbu.
both in the US and in Korea (HCD b; Efthimious 2010; HCD Research 2009. Domino’s Brand Takes a Hit after YouTube
Park et al. 2011). Second, companies should start conver- “Prank” Video. http://tinyurl.com/d4e47h.
sations in social media during normal times, not just after Jin, Y., and Pang, A. 2010. Future directions of crisis communi-
a crisis hits the organizations. Third, considering the speed cation research: Emotions in crisis - the next frontier in The hand-
at which bad news spreads, companies should prepare to re- book of crisis comm. Handbooks in Comm. and Media. Wiley-
Blackwell.
spond within hours, not within days.
Park, J.; Kim, H.; Cha, M.; and Jeong, J. 2011. Ceo’s apology in
There are several exciting directions for future research.
twitter: A case study of the fake beef labeling incident by e-mart.
First, our methodology could not capture any subtle changes In SocInfo, volume 6984 of Lecture Notes in Computer Science,
in sentiments of individuals, because an automated analyses 300–303. Springer.
tool like LIWC operates based on simple word counts. As Strauss, A., and Corbin, J. 1990. Basics of qualitative research:
we have demonstrated, a cross examination of both quan- Grounded theory procedures and techniques. Sage Publications.
titative and qualitative analyses can provide a big and in- Talbot, D. 2011. A social media decoder. MIT Technology review
depth picture. Second, our investigation focused on only 44–51.
one event. Other bad news cases can be analyzed using the
Tausczik, Y. R., and Pennebaker, J. W. 2010. The Psychological
research framework of this study to identify commonalities Meaning of Words: LIWC and Computerized Text Analysis Meth-
and differences in the spread of bad news. ods. Journal of Language and Social Psychology 29(1):24–54.
Tumasjan, A.; O.Sprenger, T.; G.Sander, P.; and M.Welpe, I. 2010.
Acknowledgement Predicting elections with twitter: What 140 characters reveal about
political sentiment. In Int. AAAI Conf. on Weblogs and Social Me-
Meeyoung Cha and Jaram Park were supported by Basic dia (ICWSM).
Science Research Program through the National Research Wu, S.; Tan, C.; Kleinberg, J.; and Macy, M. 2011. Does bad news
Foundation (NRF) of Korea, funded by the Ministry of Ed- go away faster? In Int. AAAI Conf. on Weblogs and Social Media
ucation, Science and Technology (2011-0012988). (ICWSM).
289You can also read