Automatic Linguistic Indexing of Pictures by a Statistical Modeling Approach
←
→
Page content transcription
If your browser does not render page correctly, please read the page content below
IEEE TRANSACTIONS ON PATTERN ANALYSIS AND MACHINE INTELLIGENCE,                       VOL. 25, NO. 9,      SEPTEMBER 2003                       1075

          Automatic Linguistic Indexing of Pictures
            by a Statistical Modeling Approach
                                Jia Li, Member, IEEE, and James Z. Wang, Member, IEEE

       Abstract—Automatic linguistic indexing of pictures is an important but highly challenging problem for researchers in computer vision
       and content-based image retrieval. In this paper, we introduce a statistical modeling approach to this problem. Categorized images are
       used to train a dictionary of hundreds of statistical models each representing a concept. Images of any given concept are regarded as
       instances of a stochastic process that characterizes the concept. To measure the extent of association between an image and the
       textual description of a concept, the likelihood of the occurrence of the image based on the characterizing stochastic process is
       computed. A high likelihood indicates a strong association. In our experimental implementation, we focus on a particular group of
       stochastic processes, that is, the two-dimensional multiresolution hidden Markov models (2D MHMMs). We implemented and tested
       our ALIP (Automatic Linguistic Indexing of Pictures) system on a photographic image database of 600 different concepts, each with
       about 40 training images. The system is evaluated quantitatively using more than 4,600 images outside the training database and
       compared with a random annotation scheme. Experiments have demonstrated the good accuracy of the system and its high potential
       in linguistic indexing of photographic images.

       Index Terms—Content-based image retrieval, image classification, hidden Markov model, computer vision, statistical learning,
       wavelets.

                                                                                æ

1    INTRODUCTION

A     picture is worth a thousand words. As human beings,
      we are able to tell a story from a picture based on what
we have seen and what we have been taught. A 3-year old
                                                                                    examples of related work, not as the complete list of work in
                                                                                    the cited areas.

child is capable of building models of a substantial number of                      1.1 Related Work on Indexing Images
concepts and recognizing them using the learned models                              Many content-based image retrieval (CBIR) systems have
stored in her brain. Can a computer program learn a large                           been developed since the early 1990s. A recent article
collection of semantic concepts from 2D or 3D images, build                         published by Smeulders et al. reviewed more than 200
models about these concepts, and recognize them based on                            references in this ever changing field [20]. Readers are
these models? This is the question we attempt to address in                         referred to that article and some additional references [2],
this work.                                                                          [17], [18], [25], [23], [4], [11], [26] for more information.
   Automatic linguistic indexing of pictures is essentially                            Most of the CBIR projects aimed at general-purpose image
important to content-based image retrieval and computer                             indexing and retrieval systems focus on searching images
object recognition. It can potentially be applied to many areas,                    visually similar to the query image or a query sketch. They do
including biomedicine, commerce, the military, education,                           not have the capability of assigning comprehensive textual
                                                                                    description automatically to pictures, i.e., linguistic indexing,
digital libraries, and Web searching. Decades of research have
                                                                                    because of the great difficulty in recognizing a large number
shown that designing a generic computer algorithm that can                          of objects. However, this function is essential for linking
learn concepts from images and automatically translate the                          images to text and consequently broadening the possible
content of images to linguistic terms is highly difficult.                          usages of an image database.
   Much success has been achieved in recognizing a                                     Many researchers have attempted to use machine-learning
relatively small set of objects or concepts within specific                         techniques for image indexing and retrieval [16], [24]. In 1997,
domains. There is a rich resource of prior work in the fields of                    a system developed by Minka and Picard included a learning
computer vision, pattern recognition, and their applications                        component. The system internally generated many segmen-
[9]. Space limitation does not allow us to present a broad                          tations or groupings of each image’s regions based on
                                                                                    different combinations of features, then learned which
survey. Instead, we try to emphasize some work most related
                                                                                    combinations best represented the semantic categories given
to what we propose. The references below are to be taken as
                                                                                    as examples by the user. The system requires the supervised
                                                                                    training of various parts of the image.
. J. Li is with the Department of Statistics, The Pennsylvania State                   A growing trend in the field of image retrieval is to
  University, University Park, PA 16802. E-mail: jiali@stat.psu.edu.                automate linguistic indexing of images by statistical classifi-
. J.Z. Wang is with the School of Information Sciences and Technology, The          cation methods. The Stanford SIMPLIcity system [22] uses
  Pennsylvania State University, University Park, PA 16802.
                                                                                    statistical classification methods to group images into rough
  E-mail: jwang@ist.psu.edu.
                                                                                    semantic classes, such as textured-nontextured, graph-photo-
Manuscript received 8 Apr. 2002; revised 8 Oct. 2002; accepted 27 Jan. 2003.
Recommended for acceptance by C. Schmid.
                                                                                    graph. Potentially, the categorization enhances retrieval by
For information on obtaining reprints of this article, please send e-mail to:       permitting semantically adaptive searching methods and by
tpami@computer.org, and reference IEEECS Log Number 116290.                         narrowing down the searching range in a database. The
                                          0162-8828/03/$17.00 ß 2003 IEEE           Published by the IEEE Computer Society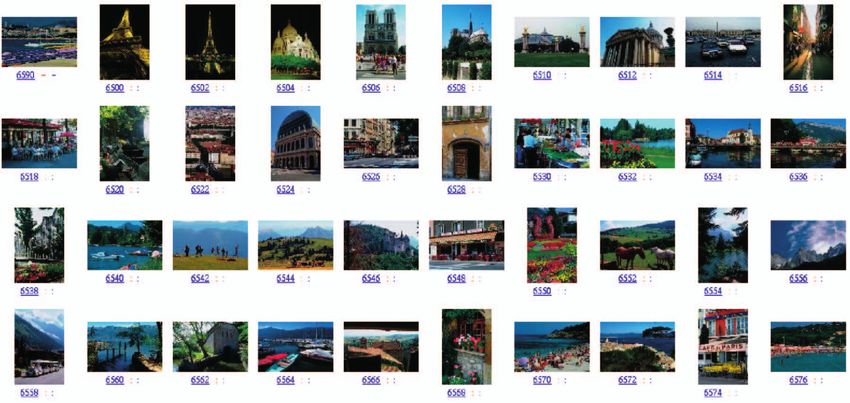
1076                           IEEE TRANSACTIONS ON PATTERN ANALYSIS AND MACHINE INTELLIGENCE,         VOL. 25,   NO. 9,   SEPTEMBER 2003

approach is limited because these classification methods are
problem specific and do not extend straightforwardly.
   Recent work in associating images explicitly with words
was done at the University of California at Berkeley by
Barnard and Forsyth [1] and Duygulu et al. [8]. Using region
segmentation, Barnard and Forsyth [1] explored automati-
cally annotating entire images and Duygulu et al. [8] focused        Fig. 1. Decomposition of images into frequency bands by wavelet
                                                                     transforms.
on annotating specific regions. The work has achieved some
success for certain image types. But, as pointed out by the
authors in [1], one major limitation is that the algorithm relies
on semantically meaningful segmentation which is, in                 2   SYSTEM ARCHITECTURE
general, unavailable to image databases. Automatic segmen-           The system has three major components, the feature
tation is still an open problem in computer vision [27], [19].       extraction process, the multiresolution statistical modeling
                                                                     process, and the statistical linguistic indexing process. In
1.2 Our Approach
                                                                     this section, we introduce the basics about these individual
In our work, categories of images, each corresponding to a
                                                                     components and their relationships.
concept, are profiled by statistical models, in particular, the
two-dimensional multiresolution hidden Markov model                  2.1 Feature Extraction
(2D MHMM) [13]. The pictorial information of each image              The system characterizes localized features of training images
is summarized by a collection of feature vectors extracted at        using wavelets. In this process, an image is partitioned into
multiple resolutions and spatially arranged on a pyramid             small pixel blocks. For our experiments, the block size is
grid. The 2D MHMM fitted to each image category plays the            chosen to be 4  4 as a compromise between the texture detail
role of extracting representative information about the              and the computation time. Other similar block sizes can also
category. In particular, a 2D MHMM summarizes two types              be used. The system extracts a feature vector of six dimensions
of information: clusters of feature vectors at multiple              for each block. Three of these features are the average color
resolutions and the spatial relation between the clusters, both      components of pixels in the block. The other three are texture
across and within resolutions. As a 2D MHMM is estimated             features representing energy in high-frequency bands of
separately for each category, a new category of images added         wavelet transforms [5]. Specifically, each of the three features
to the database can be profiled without repeating computa-           is the square root of the second order moment of wavelet
tion involved with learning from the existing categories. Since      coefficients in one of the three high-frequency bands. The
each image category in the training set is manually annotated,       features are extracted using the LUV color space, where
a mapping between profiling 2D MHMMs and sets of words               L encodes luminance and U and V encode color information
can be established. For a test image, feature vectors on the         (chrominance). The LUV color space is chosen because of its
pyramid grid are computed. Consider the collection of the            good perception correlation properties.
feature vectors as an instance of a spatial statistical model. The      To extract the three texture features, we apply either the
likelihood of this instance being generated by each profiling        Daubechies-4 wavelet transform or the Haar transform to the
2D MHMM is computed. To annotate the image, words are                L component of the image. These two wavelet transforms
selected from those in the text description of the categories        have better localization properties and require less computa-
yielding highest likelihoods.                                        tion compared to Daubechies’ wavelets with longer filters.
    Readers are referred to Li and Gray [14] for details on          After a one-level wavelet transform, a 4  4 block is
2D MHMM. Many other statistical image models have been
                                                                     decomposed into four frequency bands, as shown in Fig. 1.
developed for various tasks in image processing and
                                                                     Each band contains 2  2 coefficients. Without loss of
computer vision. Theories and methodologies related to
                                                                     generality, suppose the coefficients in the HL band are
Markov random fields (MRFs) [6], [10], [12], [3] have played
                                                                     fck;l ; ck;lþ1 ; ckþ1;l ; ckþ1;lþ1 g. One feature is then computed as
important roles in the construction of many statistical image
                                                                                                         vffiffiffiffiffiffiffiffiffiffiffiffiffiffiffiffiffiffiffiffiffiffiffiffiffiffiffiffiffi
models. For a thorough introduction to MRFs and their                                                    u 1 1
                                                                                                       1u   XX
applications, see Kindermann and Snell [12] and Chellappa                                        f¼ t                    c2             :
and Jain [3]. Given its modeling efficiency and computational                                          2 i¼0 j¼0 kþi;lþj
convenience, we consider 2D MHMMs an appropriate
starting point for exploring the statistical modeling approach       The other two texture features are computed in a similar
to linguistic indexing.                                              manner using the LH and HH bands, respectively.
                                                                        These wavelet-based texture features provide a good
1.3 Outline of the Paper                                             compromise between computational complexity and effec-
The remainder of the paper is organized as follows: The              tiveness. Unser [21] has shown that moments of wavelet
architecture of the ALIP (Automatic Linguistic Indexing of           coefficients in various frequency bands can effectively
Pictures) system is introduced in Section 2. The model-              discern local texture. Wavelet coefficients in different
learning algorithm is described in Section 3. Linguistic             frequency bands signal variation in different directions. For
indexing methods are described in Section 4. In Section 5,           example, the HL band reflects activities in the horizontal
experiments and results are presented. We conclude and               direction. A local texture of vertical strips thus has high
suggest future research in Section 6.                                energy in the HL band and low energy in the LH band.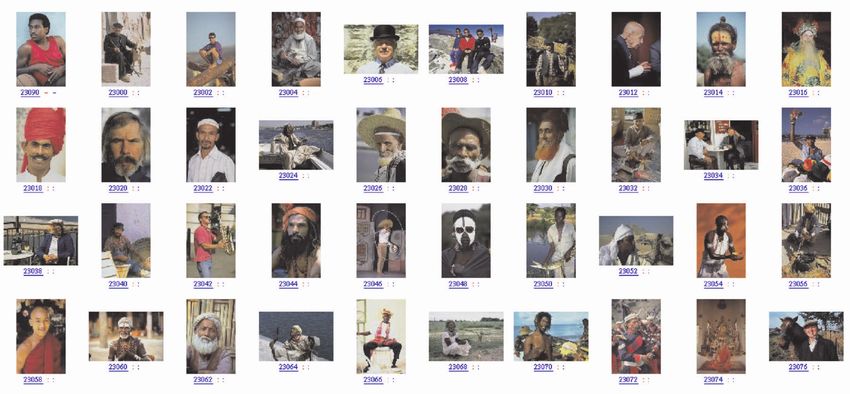
LI AND WANG: AUTOMATIC LINGUISTIC INDEXING OF PICTURES BY A STATISTICAL MODELING APPROACH                                     1077

Fig. 2. The architecture of the statistical modeling process.

2.2 Multiresolution Statistical Modeling                             higher-level statistical model of which the image clusters and
Fig. 2 illustrates the flow of the statistical modeling process of   profiling 2D MHMMs are components. We have not experi-
the system. We first manually develop a series of concepts to        mented with these approaches.
be trained for inclusion in the dictionary of concepts. For each
concept in this dictionary, we prepare a training set contain-       2.3 Statistical Linguistic Indexing
ing images capturing the concept. Hence, at the data level, a        The system automatically indexes images with linguistic
concept corresponds to a particular category of images. These        terms based on statistical model comparison. Fig. 3 shows the
images do not have to be visually similar. We also manually          statistical linguistic indexing process of the system. For a
prepare a short but informative description about any given          given image to be indexed, we first extract multiresolution
concept in this dictionary. Therefore, our approach has the          block-based features by the same procedure used to extract
potential to train a large collection of concepts because we do      features for the training images.
not need to manually create a description about each image in           To quantify the statistical similarity between an image
the training database.                                               and a concept, the likelihood of the collection of feature
   Block-based features are extracted from each training             vectors extracted from the image is computed under the
image at several resolutions. The statistical modeling process       trained model for the concept. All the likelihoods, along
does not depend on a specific feature extraction algorithm.          with the stored textual descriptions about the concepts, are
The same feature dimensionality is assumed for all blocks of         analyzed by the significance processor to find a small set of
pixels. A cross-scale statistical model about a concept is built     statistically significant index terms about the image. These
using training images belonging to this concept, each                index terms are then stored with the image in the image
characterized by a collection of multiresolution features. This      database for future keyword-based query processing.
model is then associated with the textual description of the
concept and stored in the concept dictionary.                        2.4 Major Advantages
   In the current work, we focus on building statistical models      Our system architecture has several major advantages:
using images that are precategorized and annotated at a
categorical level. Many databases contain images not initially         1.   If images representing new concepts or new images
categorized, for example, those discussed in [7], [8]. If each              in existing concepts are added into the training
image is annotated separately, there are a number of possible               database, only the statistical models for the involved
approaches to generating profiling models. A clustering                     concepts need to be trained or retrained. Hence, the
procedure can be applied to the collection of annotation                    system naturally has good scalability without invok-
words. A cluster of words can be considered as a concept.                   ing any extra mechanism to address the issue. The
Images annotated with words in the same cluster will be                     scalability enables us to train a relatively large
pooled to train a model. A detailed discussion on word                      number of concepts at once.
clustering for the purpose of autoannotation is provided in            2.   In our statistical model, spatial relations among
[8]. A more sophisticated approach involves clustering                      image pixels and across image resolutions are both
images and estimating a model using images in the same                      taken into consideration. This property is especially
cluster. The clustering of images and the estimation of models              useful for images with special texture patterns.
can be optimized in an overall manner based on a certain                    Moreover, the modeling approach enables us to
1078                                IEEE TRANSACTIONS ON PATTERN ANALYSIS AND MACHINE INTELLIGENCE,                VOL. 25,    NO. 9,    SEPTEMBER 2003

Fig. 3. The architecture of the statistical linguistic indexing process.

         avoid segmenting images and defining a similarity                 location at the higher resolution are referred to as child blocks.
         distance for any particular set of features. Likelihood           We will always assume such a “quad-tree” split in the sequel
         can be used as a universal measure of similarity.                 since the extension to other hierarchical structures is
                                                                           straightforward.
3      THE MODEL-BASED LEARNING                   OF   CONCEPTS                We first review the basic assumptions of the single
                                                                           resolution 2D HMM as presented in [15]. In the 2D HMM,
In this section, we present in detail a statistical image
                                                                           feature vectors are generated by a Markov model that may
modeling process that learns a dictionary of a large number
of concepts automatically. We describe here assumptions of                 change state once every block. Suppose there are M states,
the 2D MHMM modified from a model originally devel-                        the state of block ði; jÞ being denoted by si;j . The feature
oped for the purpose of image segmentation [13]. The                       vector of block ði; jÞ is ui;j . We use P ðÞ to represent the
model is aimed at characterizing the collection of training                probability of an event. We denote ðI 0 ; j0 Þ < ði; jÞ if i0 < i or
images, each in their entireties, within a concept.                        i0 ¼ i; j0 < j, in which case we say that block ði0 ; j0 Þ is before
                                                                           block ði; jÞ. The first assumption is that
3.1 Image Modeling
For the purpose of training the multiresolution model,                              P ðsi;j j contextÞ ¼ am;n;l ;
multiple versions of an image at different resolutions are                                     context ¼ fsi0 ;j0 ; ui0 ;j0 : ði0 ; j0 Þ < ði; jÞg;
obtained first. The original image corresponds to the highest
resolution. Lower resolutions are generated by successively                where m ¼ si1;j , n ¼ si;j1 , and l ¼ si;j . The second assump-
filtering out high-frequency information. Wavelet transforms               tion is that, given every state, the feature vectors follow a
[5] naturally provide low-resolution images in the low-                    Gaussian distribution. Once the state of a block is known, the
frequency band (the LL band).                                              feature vector is conditionally independent of information on
    To save computation, features are often extracted from                 other blocks. The covariance matrix s and the mean vector s
nonoverlapping blocks in an image. An element in an image is               of the Gaussian distribution vary with state s.
therefore a block rather than a pixel. Features computed from
one block at a particular resolution form a feature vector and
are treated as multivariate data in the 2D MHMM. The
2D MHMM aims at describing statistical properties of the
feature vectors and their spatial dependence. The numbers of
blocks in both rows and columns reduce by half successively
at each lower resolution. Obviously, a block at a lower
resolution covers a spatially more global region of the image.
As indicated by Fig. 4, a block at a lower resolution is referred
to as a parent block and the four blocks at the same spatial               Fig. 4. The image hierarchy across resolutions.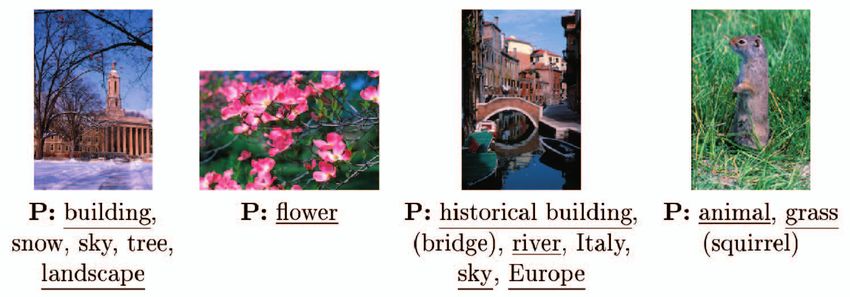
LI AND WANG: AUTOMATIC LINGUISTIC INDEXING OF PICTURES BY A STATISTICAL MODELING APPROACH                                                           1079

    The fact that only feature vectors are observable in a
given image accounts for the name “Hidden” Markov
Model. The state of a feature vector is conceptually similar
to the cluster identity of a vector in unsupervised clustering.
As with clustering, the state of a vector is not provided
directly by the training data and, hence, needs to be
estimated. In clustering, feature vectors are considered as
independent samples from a given distribution. In the 2D
HMM, feature vectors are statistically dependent through
the underlying states modeled by a Markov chain.
    For the MHMM, denote the set of resolutions by
R ¼ f1; . . . ; Rg, with r ¼ R being the finest resolution. Let
the collection of block indices at resolution r be
                                                                           Fig. 5. The hierarchical statistical dependence across resolutions.

       INðrÞ ¼ ði; jÞ : 0  i < w=2Rr ; 0  j < z=2Rr :
                                                                           assumed for a single resolution 2D HMM. The state transition
Images are represented by feature vectors at all the resolu-               probabilities, however, depend on the state of their parent
                        ðrÞ
tions, denoted by ui;j , r 2 R, ði; jÞ 2 INðrÞ . The underlying            block. To formulate these assumptions, denote the child
                                ðrÞ
state of a feature vector is si;j . At each resolution r, the set of       blocks at resolution r of block ðk; lÞ at resolution r  1 by
              ðrÞ ðrÞ       ðrÞ
states is f1 ; 2 ; . . . ; Mr g. Note that, as states vary across
resolutions, different resolutions do not share states.                    Dðk; lÞ ¼ fð2k; 2lÞ; ð2k þ 1; 2lÞ; ð2k; 2l þ 1Þ; ð2k þ 1; 2l þ 1Þg :
                                                                           D
    To structure statistical dependence among resolutions, a
first-order Markov chain is assumed across the resolutions.                According to the assumptions,
In particular, given the states at the parent resolution, the                      n                                                    o
                                                                                       ðrÞ                      ðr1Þ
states at the current resolution are conditionally indepen-                      P si;j : ði; jÞ 2 INðrÞ j sk;l : ðk; lÞ 2 INðr1Þ ¼
                                                                                      Y           n                                  o
dent of the other preceding resolutions, so that                                                    ðrÞ                        ðr1Þ
                                                                                                 P si;j : ði; jÞ 2 DDðk; lÞ j sk;l    ;
       n                            o     n                   o                            ðr1Þ
          ðrÞ                                ð1Þ                                 ðk;lÞ2IN
     P si;j : r 2 R; ði; jÞ 2 INðrÞ ¼ P si;j : ði; jÞ 2 INð1Þ
                                                                                        ðrÞ                     ðr1Þ
     Y
     R  n                                               o                  where P fsi;j : ði; jÞ 2 D  Dðk; lÞj sk;l g can be evaluated by
          ðrÞ                     ðr1Þ                                                                                    ðr1Þ
       P si;j : ði; jÞ 2 INðrÞ j sk;l : ðk; lÞ 2 INðr1Þ :                 transition probabilities conditioned on sk;l , denoted by
                                                                                    ðr1Þ
     r¼2                                                                   am;n;l ðsk;l Þ. We thus have a different set of transition
                                  ðrÞ                       ðrÞ            probabilities am;n;l for every possible state in the parent
In addition, given its state si;j , a feature vector ui;j at any
resolution is conditionally independent of any other                       resolution. The influence of previous resolutions is exerted
states and feature vectors. As the states are unobservable,                hierarchically through the probabilities of the states, which
during model estimation, different combinations of states                  can be visualized in Fig. 5. The joint probability of states and
need to be considered. An important quantity to compute                    feature vectors at all the resolutions in (1) is then derived as
is the joint probability of a particular set of states and the                n                                  o
                                                                                  ðrÞ ðrÞ
feature vectors. Based on the assumptions, we can                           P si;j ; ui;j : r 2 R; ði; jÞ 2 INðrÞ ¼
compute this probability by the following chain rule:                        n                            o Y
                                                                               ð1Þ ð1Þ
                                                                                                             R          Y
     n                                      o                               P si;j ; ui;j : ði; jÞ 2 INð1Þ
        ðrÞ   ðrÞ
    P si;j ; ui;j : r 2 R; ði; jÞ 2 INðrÞ ¼                                                                   r¼2              ðr1Þ
                                                                                                                    ðk;lÞ2IN
     n                             o                                        0                                                                         1
        ð1Þ   ð1Þ
    P si;j ; ui;j : ði; jÞ 2 INð1Þ                                             n                                 o       Y             n         o
     n                                                     o         ð1Þ    @P sðrÞ : ði; jÞ 2 D          ðr1Þ
                                                                                               Dðk; lÞ j sk;l
                                                                                                                                          ðrÞ    ðrÞ
                                                                                                                                       P ui;j j si;j A:
        ð2Þ   ð2Þ                     ð1Þ                                       i;j
    P si;j ; ui;j : ði; jÞ 2 INð2Þ j sk;l : ðk; lÞ 2 INð1Þ                                                       ði;jÞ2D
                                                                                                                            Dðk;lÞ
     n                                                           o
        ðRÞ    ðRÞ                      ðR1Þ
    P si;j ; ui;j : ði; jÞ 2 INðRÞ j sk;l      : ðk; lÞ 2 INðR1Þ :           To summarize, a 2D MHMM captures both the interscale
                                                                           and intrascale statistical dependence. The interscale depen-
At the coarsest resolution, r ¼ 1, feature vectors are                     dence is modeled by the Markov chain over resolutions. The
assumed to be generated by a single resolution 2D HMM.                     intra-scale dependence is modeled by the HMM. At the
At a higher resolution, the conditional distribution of a                  coarsest resolution, feature vectors are assumed to be
feature vector given its state is assumed to be Gaussian. The              generated by an 2D HMM. Fig. 6 illustrates the interscale
parameters of the Gaussian distribution depend upon the                    and intrascale dependencies modeled. At all the higher
state at the particular resolution.                                        resolutions, feature vectors of sibling blocks are also
   Given the states at resolution r  1, statistical dependence            assumed to be generated by 2D HMMs. The HMMs vary
among blocks at the finer resolution r is constrained to sibling           according to the states of parent blocks. Therefore, if the
blocks (child blocks descended from the same parent block).                next coarser resolution has M states, then there are,
Specifically, child blocks descended from different parent                 correspondingly, M HMMs at the current resolution.
blocks are conditionally independent. In addition, given the                  The 2D MHMM can be estimated by the maximum
state of a parent block, the states of its child blocks are                likelihood criterion using the EM algorithm. The computa-
independent of the states of their “uncle” blocks (nonparent               tional complexity of estimating the model depends on the
blocks at the parent resolution). State transitions among                  number of states at each resolution and the size of the
sibling blocks are governed by the same Markovian property                 pyramid grid. In our experiments, the number of resolutions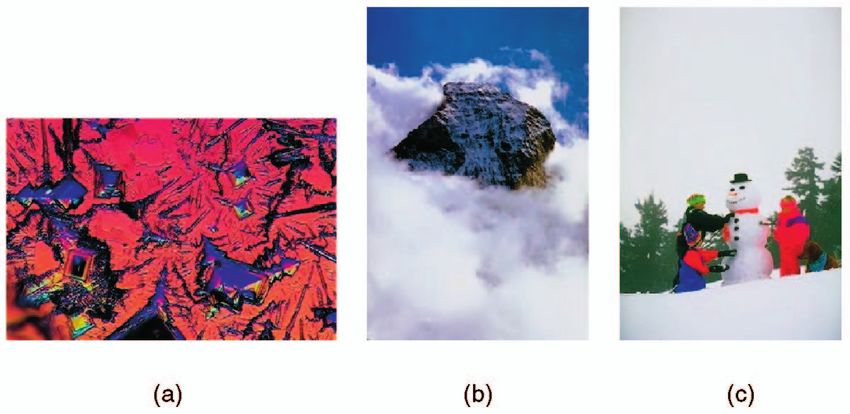
1080 IEEE TRANSACTIONS ON PATTERN ANALYSIS AND MACHINE INTELLIGENCE, VOL. 25, NO. 9, SEPTEMBER 2003
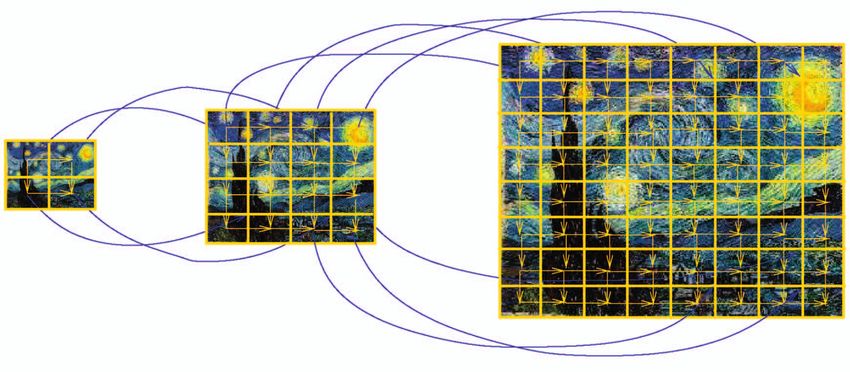
Fig. 6. In the statistical modeling process, spatial relations among image pixels and across image resolutions are both taken into consideration.
Arrows, not all drawn, indicate the transition probabilities captured in the statistical model.
is 3; the number of states at the lowest resolution is 3; and needs to be used to choose a subset of words. There are many
those at the two higher resolutions are 4. Details about the possibilities. A system can provide multiple choices for
estimation algorithm, the computation of the likelihood of an selecting words with only negligible increase of computa-
image given a 2D MHMM, and computational complexity are tional load, especially in comparison with the amount of
referred to [13]. computation needed to obtain likelihoods and rank them.
Inspired by hypothesis testing, we explore in detail a
particular scheme to choose words. Suppose, in the annota-
4 THE AUTOMATIC LINGUISTIC INDEXING OF tion of the k categories, a word appears j times. If we can reject
PICTURES the hypothesis that the k categories are chosen randomly
In this section, we describe the component of the system based on the number of times the word arises, we gain
that automatically indexes pictures with linguistic terms. confidence in that the k categories are chosen because of
For a given image, the system compares the image similarity with the query. To reject the hypothesis, we
compute the probability of the word appearing at least j
statistically with the trained models in the concept
times in the annotation of k randomly selected categories. A
dictionary and extracts the most statistically significant
small probability indicates it is unlikely that the word has
index terms to describe the image. For any given image, a
ðrÞ appeared simply by chance. Denote this probability by
collection of feature vectors at multiple resolutions fui;j ; r 2 P ðj; kÞ. It is given by
ðrÞ
R; ði; jÞ 2 IN g is computed as described in Section 3. We
ðrÞ mnm
regard fui;j ; r 2 R; ði; jÞ 2 INðrÞ g as an instance of a stochas- X k
tic process defined on a multiresolution grid. The similarity P ðj; kÞ ¼ Iði mÞ i nki
i¼j k
between the image and a category of images in the database
is assessed by the log likelihood of this instance under the X
k
m! ðn mÞ! k! ðn kÞ!
model M trained from images in the category, that is, ¼ Iði mÞ ;
i¼j
i! ðm iÞ! ðk iÞ! ðn m k þ iÞ! n!
n o
ðrÞ
log P ui;j ; r 2 R; ði; jÞ 2 INðrÞ j M : where IðÞ is the indicator function that equals 1 when the
argument is true and 0 otherwise, n is the total number of
A recursive algorithm [13] is used to compute the above log image categories in the database, and m is the number of
likelihood. After determining the log likelihood of the image image categories that are annotated with the given word.
belonging to any category, we sort the log likelihoods to find The probability P ðj; kÞ can be approximated as follows,
the few categories with the highest likelihoods. Suppose k top- using the binomial distribution if n; m >> k:
ranked categories are used to generate annotation words for
Xk Xk
the query. The selection of k is somewhat arbitrary. An k i k!
adaptive way to decide k is to use categories with likelihoods P ðj; kÞ ¼ p ð1 pÞki ¼ pi ð1 pÞki ;
i¼j
i i¼j
i!ðk iÞ!
exceeding a threshold. However, it is found that the range of
likelihoods computed from a query image varies greatly where p ¼ m=n is the percentage of image categories in the
depending on the category the image belongs to. A fixed database that are annotated with this word or, equivalently,
threshold is not useful. When there are a large number of the frequency of the word being used in annotation. A small
categories in the database, it is observed that choosing a fixed value of P ðj; kÞ indicates a high level of significance for a
number of top-ranked categories tends to yield relatively given word. We rank the words within the description of the
robust annotation. most likely categories according to their statistical signifi-
Words in the description of the selected k categories are cance. Most significant words are used to index the image.
candidates for annotating the query image. If a short Intuitively, assessing the significance of a word by P ðj; kÞ
description for the query is desired, a certain mechanism is attempting to quantify how surprising it is to see the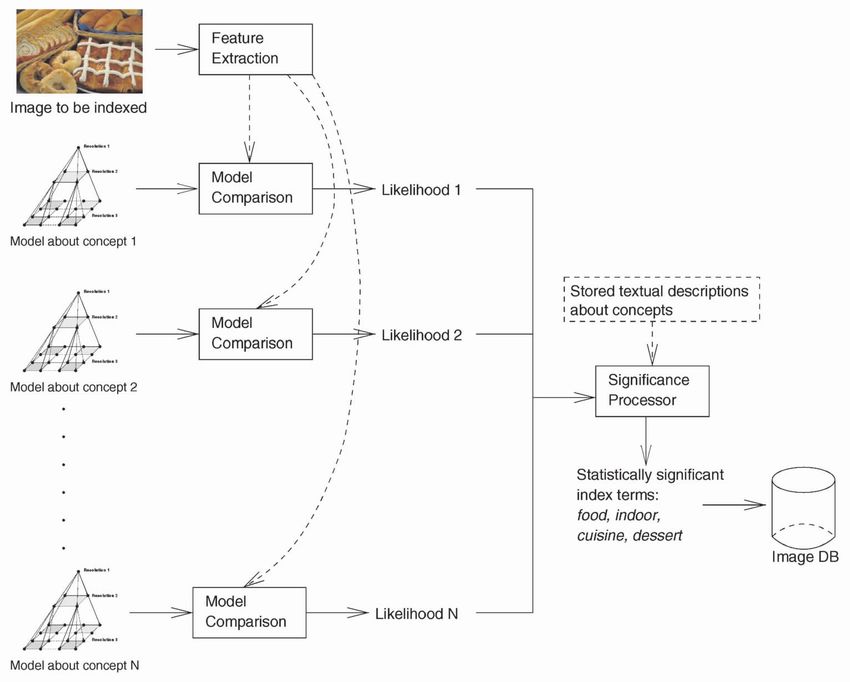
LI AND WANG: AUTOMATIC LINGUISTIC INDEXING OF PICTURES BY A STATISTICAL MODELING APPROACH                                                     1081

Fig. 7. Training images used to learn a given concept are not necessarily all visually similar. For example, these 40 images were used to train the
concept of Paris/France with the category description: “Paris, European, historical building, beach, landscape, water.”

Fig. 8. Training images used to learn the concept of male with the category description: “man, male, people, cloth, face.”

word. Words may have vastly different frequencies of being                 These images are stored in JPEG format with size 384  256 or
used to annotate image categories in a database. For                       256  384. The system was written in the C programming
instance, many more categories may be described by                         language and compiled on two Unix platforms: Linux and
“landscape” than by “dessert.” Therefore, obtaining the                    Solaris. In this section, we describe the training concepts and
word “dessert” in the top ranked categories matched to an                  show indexing results.
image is in a sense more surprising than obtaining “land-
                                                                           5.1 Training Concepts
scape” since the word “landscape” may have a good chance
of being selected even by random matching.                                 We conducted experiments on learning-based linguistic
   The proposed scheme of choosing words favors “rare”                     indexing with a large number of concepts. The system was
words. Hence, if the annotation is correct, it tends to                    trained using a subset of 60,000 photographs based on
provide relatively specific or interesting information about               600 CD-ROMs published by COREL Corporation. Typically,
the query. On the other hand, the scheme is risky since it                 each COREL CD-ROM of about 100 images represents one
avoids, to a certain extent, using words that fit a large                  distinct topic of interest. Images in the same CD-ROM are
number of image categories.                                                often not all visually similar. Fig. 7 shows the those images
                                                                           used to train the concept of Paris/France with the description:
                                                                           “Paris, European, historical building, beach, landscape,
5    EXPERIMENTS                                                           water.” Images used to train the concept male are shown in
To validate the methods we have described, we implemented                  Fig. 8. For our experiment, the dictionary of concepts contains
the components of the ALIP system and tested with a general-               all 600 concepts, each associated with one CD-ROM of
purpose image database including about 60,000 photographs.                 images.
1082 IEEE TRANSACTIONS ON PATTERN ANALYSIS AND MACHINE INTELLIGENCE, VOL. 25, NO. 9, SEPTEMBER 2003
TABLE 1
Examples of the 600 Categories and Their Descriptions
Every category has 40 training images.
We manually assigned a set of keywords to describe each 5.2 Categorization Performance in a Controlled
CD-ROM collection of 100 photographs. The descriptions of Database
these image collections range from as simple or low-level as To provide numerical results on the performance, we
“mushrooms” and “flowers” to as complex or high-level as evaluated the system based on a controlled subset of the
“England, landscape, mountain, lake, European, people, COREL database, formed by 10 image categories (African
people and villages, beach, buildings, buses, dinosaurs,
historical building” and “battle, rural, people, guard, fight,
elephants, flowers, horses, mountains and glaciers, food),
grass.” On average, 3.6 keywords are used to describe the each containing 100 pictures. In the next section, we provide
content of each of the 600 image categories. It took the authors categorization and annotation results with 600 categories.
approximately 10 hours to annotate these categories. In Because many of the 600 categories share semantic mean-
Tables 1 and 2, example category descriptions are provided. ings, the categorization accuracy is conservative for
While manually annotating categories, the authors made evaluating the annotation performance. For example, if an
efforts to use words that properly describe nearly all if not all image of the category with scenes in France is categorized
images in one category. It is possible that a small number of wrongly into the category with European scenes, the system
is still useful in many applications. Within this controlled
images are not described accurately by all words assigned to
database, we can assess annotation performance reliably by
their category. We view them as “outliers” introduced into categorization accuracy because the tested categories are
training for the purpose of estimating the 2D MHMM. In distinct and share no description words.
practice, outliers often exist for various reasons. There are We trained each concept using 40 images and tested the
ample statistical methods to suppress the adverse effect of models using 500 images outside the training set. Instead of
them. On the other hand, keeping outliers in training will annotating the images, the program was used to select the
testify to the robustness of a method. For the model we use, category with the highest likelihood for each test image. That
is, we use the classification power of the system as an
the number of parameters is small relative to the amount of
indication of the annotation accuracy. An image is considered
training data. Hence, the model estimation is not anticipated to be annotated correctly if the computer predicts the true
to be affected considerably by inaccurately annotated images. category the image belongs to. Although these image
We therefore simply use those images as normal ones. categories do not share annotation words, they may beLI AND WANG: AUTOMATIC LINGUISTIC INDEXING OF PICTURES BY A STATISTICAL MODELING APPROACH 1083
TABLE 2
Examples of the 600 Categories and Their Descriptions (cont.)
Fig. 9. The histogram of the numbers of words assigned to the test images
by our system. For each word in the annotation of the five matched
categories, a value indicating its significance is computed and thresholded
by 0.0649. A word with a value below the threshold is selected.
5.3 Categorization and Annotation Results
A statistical model is trained for each of the 600 categories of
images. Depending on the complexity of a category, the
training process takes 15 to 40 minutes of CPU time, with an
average of 30 minutes, on an 800 MHz Pentium III PC to
converge to a model. These models are stored in a fashion
similar to a dictionary or encyclopedia. The training process is
entirely parallelizable because the model for each concept is
estimated separately.
We randomly selected 4,630 test images outside the
training image database and processed these images by the
linguistic indexing component of the system. For each of
these test images, the computer program selected five
concepts in the dictionary with the highest likelihoods of
generating the image. For every word in the annotation of
the five concepts, the value indicating its significance, as
described in Section 4, is computed. The median of all these
Every category has 40 training images.
values is 0.0649. We use the median as a threshold to select
annotation words from those assigned to the five matched
semantically related. For example, both the “beach” and the concepts. Recall that a small value implies high significance.
“mountains and glaciers” categories contain images with Hence, a word with a value below the threshold is selected.
rocks, sky, and trees. Therefore, the evaluation method we The histogram of the numbers of words assigned to the test
use here only provides a lower bound for the annotation images is provided in Fig. 9. These numbers range from 1 to
14 with median 6. The unique image with only one word
accuracy of the system. Table 3 shows the automatic
assigned to it is shown in Fig. 10a. This image is automatically
classification result. Each row lists the percentage of images annotated by “fractal,” while the manual description of its
in one category classified to each of the 10 categories by the category contains two words: “fractal” and “texture.” There
computer. Numbers on the diagonal show the classification are two images annotated with as many as 14 words, which
accuracy for every category. are shown in Figs. 10b and 10c. For the first image, the manual
TABLE 3
Results of the Automatic Image Categorization Experiments
Each row lists the percentage of images in one category classified to each of the 10 categories by the computer. Numbers on the diagonal show the
classification accuracy for each category.1084 IEEE TRANSACTIONS ON PATTERN ANALYSIS AND MACHINE INTELLIGENCE, VOL. 25, NO. 9, SEPTEMBER 2003
Fig. 10. Three test images. (a) This image is annotated with one word by ALIP. (b) and (c) These two images are annotated with 14 words by ALIP.
TABLE 4
Comparison between the Image Categorization Performance of ALIP and that of a Random Selection Scheme
Accuracy is the percentage of test images whose true categories are included in top-ranked categories. ALIP requires substantially fewer categories
to achieve the same accuracy.
annotation contains “mountain,” “snow,” “landscape,” and categorization process and linguistic indexing process are
the automatically assigned words are “mountain,” “rockies,” of good accuracy.
“snow,” “ice,” “glacier,” “sky,” “ski,” “winter,” “water,” The accuracy of categorization is evaluated in the same
“surf,” “up,” “boat,” “ship,” and “no-fear.” The only word manner as described in Section 5.2. In particular, for each test
discarded by thresholding is “cloud,” which would be a good image, the category yielding the highest likelihood is
description of the image although not included in the manual identified. If the test image is included in this category, we
annotation. The value indicating its significance is 0.073, call it a “match.” The total number of matches for the 4,630 test
quite close to the threshold. Several words outside the images is 550. That is, an accuracy of 11.88 percent is achieved.
manual annotation in fact describe the image quite accu- In contrast, if random drawing is used to categorize the
rately, e.g., “rockies,” “glacier,” “sky.” This example shows images, the accuracy is only 0.17 percent. If the condition of a
that the computer annotation can sometimes be more specific “match” is relaxed to having the true category covered by the
than the manual annotation that tends to stay at a general highest ranked two categories, the accuracy of ALIP increases
level in order to summarize all the images in the category. For to 17.06 percent, while the accuracy for the random scheme
the second image, the manual annotation includes “season,” increases to 0.34 percent.
“landscape,” “autumn,” “people,” and “plant.” The word In Table 4, we list the percentage of images whose true
“autumn” used to annotate the category is not very categories are included in their corresponding top-ranked k
appropriate for this particular image. The automatically (k ¼ 1; 2; . . . ; 5) categories in terms of likelihoods computed
annotated words have no overlap with the manual annota- by ALIP. As a comparison, we computed the number of
tion. The word “people” is marginally discarded by thresh- categories required to cover the true category at the same
olding. Other words assigned to this image include “sport,” accuracy using random selection. When m categories are
“fitness,” and “fight.” randomly selected from 600 categories, the probability that
m
To quantitatively assess the performance, we first compute the true category is included in the m categories is 600
the accuracy of categorization for the randomly selected test (derived from sampling without replacement). Therefore, to
images and then compare the annotation system with a achieve an accuracy of 11.88 percent by the random scheme,
random annotation scheme. Although the ultimate goal of 72 categories must be selected. Table 4 shows details about
the comparison.
ALIP is to annotate images linguistically, presenting the
accuracy of image categorization helps to understand how To compare with the random annotation scheme, all the
the categorization supports this goal. Due to the overlap of words in the annotation of the 600 categories are pooled to
semantics among categories, it is important to evaluate the compute their frequencies of being used. The random scheme
linguistic indexing capability. Because ALIP’s linguistic selects words independently according to the marginal
indexing capability depends on a categorized training distribution specified by the frequencies. To compare with
database and a categorization process, the choice of annota- words selected by our system using the 0.0649 threshold, six
tion words for the training image categories may improve the words are randomly generated for each image. The number 6
usefulness of the training database. The experimental results is the median of the numbers of words selected for all the
we are to present here show that both ALIP’s image images by our system, hence considered as a fair value to use.LI AND WANG: AUTOMATIC LINGUISTIC INDEXING OF PICTURES BY A STATISTICAL MODELING APPROACH 1085
Fig. 11. The histograms of the coverage percentages obtained by the ALIP system with and without thresholding and the random scheme based on a
test set of 4,630 images.
The quality of a set of annotation words for a particular image for these 250 images, relying merely on models trained for
is evaluated by the percentage of manually annotated words other categories, the annotation result is at least as good as
that are included in the set, referred to as the coverage that of the large test set.
percentage. It is worth pointing out that this way of evaluating It takes an average of 20 minutes of CPU time to compute
the annotation performance is “pessimistic” because the all the likelihoods of a test image under the models of the
600 concepts. The computation is highly parallelizable
system may provide accurate words that are not included in
because processes to evaluate likelihoods given different
the manual annotation, as shown by previous examples. An
models are independent. The average amount of CPU time
intelligent system tends to be punished more by the criterion to compute the likelihood under one model is only two
in comparison with a random scheme because, among the seconds. We are planning to implement the algorithms on
words not matched with manually assigned ones, some may massively parallel computers and provide real-time online
well be proper annotation. For our system, the mean coverage demonstrations in the future.
percentage is 21.63 percent, while that of the random scheme is Automatic and manual annotation of the over 4,600 test
9.93 percent. If all the words in the annotation of the five images can be viewed on the Web.1 Fig. 12 shows some
matched concepts are assigned to a query image, the median computer indexing results of 21 randomly selected images
of the numbers of words assigned to the test images is 12. The outside the training database. Annotation results on four
mean coverage percentage is 47.48 percent, while that photos taken by the authors and hence not in the COREL
obtained from assigning 12 words by the random scheme is database are reported in Fig. 13. The method appears to be
highly promising for automatic learning and linguistic
17.67 percent. The histograms of the coverage percentages
indexing of images. Some of the computer predictions seem
obtained by our system with and without thresholding and
to suggest that one can control what is to be learned and what
the random scheme are compared in Fig. 11. is not by adjusting the training database of individual
One may suspect that the 4,630 test images, despite being concepts.
outside the training set, are rather similar to training images
in the same categories and, hence, are unrealistically well
annotated. We thus examine the annotation of 250 images 6 CONCLUSIONS AND FUTURE WORK
taken from five categories in the COREL database using only In this paper, we demonstrated our statistical modeling
models trained from the other 595 categories, i.e., no image in approach to the problem of automatic linguistic indexing of
the same category as any of the 250 images is used in training. pictures for the purpose of image retrieval. We used
The mean coverage percentages obtained for these images by categorized images to train a dictionary of hundreds of
our system with and without thresholding at 0.0649 are concepts automatically. Wavelet-based features are used to
23.20 percent and 48.50 percent, both slightly higher than the describe local color and texture in the images. After analyzing
corresponding average values for the previous 4,630 test all training images for a concept, a two-dimensional multi-
images. The mean coverage percentages achieved by ran- resolution hidden Markov model (2D MHMM) is created and
domly assigning six and 12 words to each image are
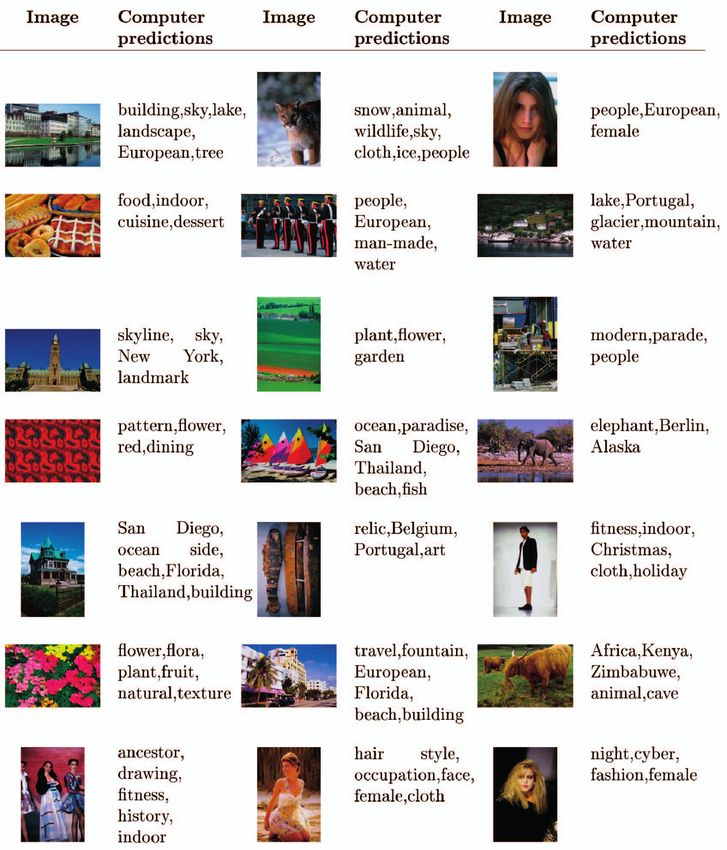
10.67 percent and 17.27 percent. It is thus demonstrated that, 1. http://wang.ist.psu.edu/IMAGE/alip.html.1086 IEEE TRANSACTIONS ON PATTERN ANALYSIS AND MACHINE INTELLIGENCE, VOL. 25, NO. 9, SEPTEMBER 2003 Fig. 12. Some annotations automatically generated by our computer-based linguistic indexing algorithm. The dictionary with 600 concepts was created automatically using statistical modeling and learning. Test images were randomly selected outside the training database. Fig. 13. Test results using photos not in the COREL collection. Statistical models learned from the COREL collection can be used to index other photographic images. These photos were taken by the authors. P: Photographer annotation. Words appeared in the annotation of the five matched categories are underlined. Words that in parentheses are not included in the annotation of any of the 600 training categories.
LI AND WANG: AUTOMATIC LINGUISTIC INDEXING OF PICTURES BY A STATISTICAL MODELING APPROACH                                                  1087

stored in a concept dictionary. Images in one category are        Conversations with Michael Lesk and Sally Goldman have
regarded as instances of a stochastic process that charac-        been very helpful. The authors would like to thank Oscar
terizes the category. To measure the extent of association        Firschein for making many suggestions on the initial manu-
between an image and the textual description of an image          script. The work was inspired in part by a collaboration
category, we compute the likelihood of the occurrence of the      between James Z. Wang and Martin A. Fischler. The Website
image based on the stochastic process derived from the            http://wang.ist.psu.edu provides more information related
category. We have demonstrated that the proposed methods          to this work. The authors would also like to acknowledge the
can be used to train models for 600 different semantic            comments and constructive suggestions from the reviewers
concepts and these models can be used to index images             and the associate editor.
linguistically.
   The major advantages of our approach are 1) models for
different concepts can be independently trained and               REFERENCES
retrained, 2) a relatively large number of concepts can be        [1]    K. Barnard and D. Forsyth, “Learning The Semantics of Words and
                                                                         Pictures,” Proc. Int’l Conf. Computer Vision, vol 2, pp. 408-415, 2001.
trained and stored, and 3) spatial relation among image           [2]    A. Berman and L.G. Shapiro, “Efficient Image Retrieval with
pixels within and across resolutions is taken into considera-            Multiple Distance Masures,” Proc. SPIE, vol. 3022, pp. 12-21, Feb.
tion with probabilistic likelihood as a universal measure.               1997.
   The current system implementation and the evaluation           [3]    R. Chellappa and A.K. Jain, Markov Random Fields: Theory and
                                                                         Applications. Academic Press, 1993.
methodology have several limitations.                             [4]    Y. Chen and J.Z. Wang, “A Region-Based Fuzzy Feature Matching
                                                                         Approach to Content-Based Image Retrieval,” IEEE Trans. Pattern
   .   We train the concept dictionary using only 2D images              Analysis and Machine Intelligence, vol. 24, no. 9, Sept. 2002.
       without a sense of object size. It is believed that the    [5]    I. Daubechies, Ten Lectures on Wavelets. Capital City Press, 1992.
       object recognizer of human beings is usually trained       [6]    R.L. Dobrushin, “The Description of a Random Field by Means of
       using 3D stereo with motion and a sense of object                 Conditional Probabilities and Conditions of Its Regularity,” Theory
                                                                         Probability Application, vol. 13, pp. 197-224, 1968.
       sizes. Training with 2D still images potentially limits    [7]    P. Duygulu, K. Barnard, and D. Forsyth, “Clustering Art,”
       the ability of accurately learning concepts.                      Computer Vision and Pattern Recognition, vol. 2, pp. 434-439, 2001.
   . As pointed out by one of the anonymous reviewers,            [8]    P. Duygulu, K. Barnard, N. de Freitas, and D. Forsyth, “Object
       the COREL image database is not ideal for training the            Recognition as Machine Translation: Learning a Lexicon for a
                                                                         Fixed Image Vocabulary,” Proc. European Conf. Computer Vision,
       system because of its biases. For instance, images in             vol. 4, pp. 97-112, 2002.
       some categories, e.g., “tigers,” are much more alike       [9]    D.A. Forsyth and J. Ponce, Computer Vision: A Modern Approach.
       than a general sampling of photographs depicting the              Prentice Hall, 2002.
       concept. On the other hand, images in some cate-           [10]   S. Geman and D. Geman, “Stochastic Relaxation, Gibbs Distribu-
       gories, e.g., “Asia,” are widely distributed visually,            tions, and the Bayesian Restoration of Images,” IEEE Trans. Pattern
                                                                         Analysis and Machine Intelligence, vol. 6, no. 6, pp. 721-741, Nov.
       making it impossible to train such a concept using                1984.
       only a small collection of such images. Until this         [11]   Q. Iqbal and J.K. Aggarwal, “Retrieval by Classification of Images
       limitation is thoroughly investigated, the evaluation             Containing Large Manmade Objects Using Perceptual Grouping,”
       results reported should be interpreted cautiously.                Pattern Recognition J., vol. 35, no. 7, pp. 1463-1479, 2002.
                                                                  [12]   R. Kindermann and L. Snell, Markov Random Fields and Their
   . For a very complex concept, i.e., when images                       Applications. Am. Math. Soc. 1980.
       representing it are visually diverse, it seems that        [13]   J. Li, R.M. Gray, and R.A. Olshen, “Multiresolution Image
       40 training images are insufficient for the computer              Classification by Hierarchical Modeling with Two Dimensional
       program to build a reliable model. The more complex               Hidden Markov Models,” IEEE Trans. Information Theory, vol. 46,
                                                                         no. 5, pp. 1826-41, Aug. 2000.
       the concept is, the more training images and CPU time
                                                                  [14]   J. Li and R.M. Gray, Image Segmentation and Compression Using
       are needed. This is similar to the learning process of a          Hidden Markov Models. Kluwer Academic, 2000.
       person, who, in general, needs more experience and         [15]   J. Li, A. Najmi, and R.M. Gray, “Image Classification by a Two
       longer time to comprehend more complex concepts.                  Dimensional Hidden Markov Model,” IEEE Trans. Signal Proces-
                                                                         sing, vol. 48, no. 2, pp. 517-33, Feb. 2000.
   In future work, we may improve the indexing speed of           [16]   T.P. Minka and R.W. Picard, “Interactive Learning Using a Society
the system by using approximation in the likelihood                      of Models,” Pattern Recognition, vol. 30, no. 3, p. 565, 1997.
computation. A rule-based system may be used to process           [17]   S. Ravela and R. Manmatha, “Image Retrieval by Appearance,”
the words annotated automatically to eliminate conflicting               Proc. SIGIR, pp. 278-285, July 1997.
                                                                  [18]   G. Sheikholeslami, S. Chatterjee, and A. Zhang, “WaveCluster: A
semantics. Moreover, besides assigning words to an image,                Multi-Resolution Clustering Approach for Very Large Spatial
weights can be given to the words in the mean time to                    Databases,” Proc. Very Large Date Bases Conf., pp. 428-439, Aug. 1998.
indicate the believed extent of description appropriateness.      [19]   J. Shi and J. Malik, “Normalized Cuts and Image Segmentation,”
Experiments with different applications such as biomedi-                 IEEE Trans. Pattern Analysis and Machine Intelligence, vol. 22, no. 8,
                                                                         pp. 888-905, Aug. 2000.
cine and art could be interesting.                                [20]   A.W.M. Smeulders, M. Worring, S. Santini, A. Gupta, and R. Jain,
                                                                         “Content-Based Image Retrieval at the End of the Early Years,”
                                                                         IEEE Trans. Pattern Analysis and Machine Intelligence, vol. 22, no. 12,
ACKNOWLEDGMENTS                                                          pp. 1349-1380, Dec. 2000.
                                                                  [21]   M. Unser, “Texture Classification and Segmentation Using
The material about the SIMPLIcity system was based upon                  Wavelet Frames,” IEEE Trans. Image Processing, vol. 4, no. 11,
work supported by the US National Science Foundation                     pp. 1549-1560, Nov. 1995.
under grant no. IIS-9817511 and, in part, by Stanford             [22]   J.Z. Wang, Integrated Region-Based Image Retrieval. Dordrecht:
University. Work on the ALIP system is supported by the                  Kluwer Academic, 2001.
                                                                  [23]   J.Z. Wang, J. Li, and G. Wiederhold, “SIMPLIcity: Semantics-
US National Science Foundation under grant no. IIS-0219272,              Sensitive Integrated Matching for Picture LIbraries,” IEEE Trans.
the Pennsylvania State University, the PNC Foundation, and               Pattern Analysis and Machine Intelligence, vol. 23, no. 9, pp. 947-963,
Sun Microsystems under grant EDUD-7824-010456-US.                        Sept. 2001.
1088 IEEE TRANSACTIONS ON PATTERN ANALYSIS AND MACHINE INTELLIGENCE, VOL. 25, NO. 9, SEPTEMBER 2003
[24] J.Z. Wang and M.A. Fischler, “Visual Similarity, Judgmental Jia Li received the BS degree in electrical
Certainty and Stereo Correspondence,” Proc. DARPA Image engineering from Xi’an Jiao Tong University in
Understanding Workshop, G. Lukes, ed., vol. 2, pp. 1237-1248, 1993, the MSc degree in electrical engineering
Nov. 1998. in 1995, the MSc degree in statistics in 1998,
[25] J.Z. Wang, G. Wiederhold, O. Firschein, and X.W. Sha, “Content- and the PhD degree in electrical engineering in
Based Image Indexing and Searching Using Daubechies’ Wave- 1999, all from Stanford University. She is an
lets,” Int’l J. Digital Libraries (IJODL), vol. 1, no. 4, pp. 311-328, assistant professor of statistics and by courtesy
1998. appointment in computer science and engineer-
[26] Q. Zhang, S.A. Goldman, W. Yu, and J.E. Fritts, “Content-Based ing at The Pennsylvania State University. She
Image Retrieval Using Multiple-Instance Learning,” Proc. Int’l worked as a research associate in the Computer
Conf. Machine Learning, 2002. Science Department at Stanford University in 1999. She was a
[27] S. Zhu and A.L. Yuille, “Region Competition: Unifying Snakes, researcher at the Xerox Palo Alto Research Center from 1999 to
Region Growing, and Bayes/MDL for Multiband Image Segmen- 2000. Her research interests include statistical classification and
tation,” IEEE Trans. Pattern Analysis and Machine Intelligence, modeling, data mining, bioinformatics, image processing, and image
vol. 18, no. 9, pp. 884-900, Sept. 1996. retrieval. She is a member of the IEEE.
James Z. Wang received the summa cum laude
bachelor’s degree in mathematics and computer
science from the University of Minnesota (1994),
the MSc degree in mathematics and the MSc
degree in computer science, both from Stanford
University (1997), and the PhD degree in
medical information sciences from the Stanford
University Biomedical Informatics Program and
Computer Science Database Group (2000).
Since 2000, he has been the holder of the
endowed PNC Technologies Career Development Professorship and an
assistant professor at the School of Information Sciences and
Technology at The Pennsylvania State University. He is also affiliated
with the Department of Computer Science and Engineering. He has
been a visiting scholar at Uppsala University in Sweden, SRI
International, IBM Almaden Research Center, and NEC Computer and
Communications Research Lab. He is a member of the IEEE.
. For more information on this or any other computing topic,
please visit our Digital Library at http://computer.org/publications/dlib.You can also read