Detecting Spammers on Twitter
←
→
Page content transcription
If your browser does not render page correctly, please read the page content below
Detecting Spammers on Twitter

                Fabrı́cio Benevenuto, Gabriel Magno, Tiago Rodrigues, and Virgı́lio Almeida
                            Computer Science Department, Universidade Federal de Minas Gerais
                                                 Belo Horizonte, Brazil
                                     {fabricio,    magno, tiagorm, virgilio}@dcc.ufmg.br

ABSTRACT                                                                them to spread the received information even more. In addi-
   With millions of users tweeting around the world, real               tion to be received by followers, tweets can also be retrieved
time search systems and different types of mining tools are             through search systems and other tools. With the emergence
emerging to allow people tracking the repercussion of events            of real time search systems and meme-tracking services, the
and news on Twitter. However, although appealing as mech-               repercussion of all kinds of events and news are beginning
anisms to ease the spread of news and allow users to discuss            to be registered with practically no delay between the cre-
events and post their status, these services open opportu-              ation and availability for retrieval of content. As example,
nities for new forms of spam. Trending topics, the most                 Google, Bing, Twitter and other meme-tracking services are
talked about items on Twitter at a given point in time, have            mining real time tweets to find out what is happening in the
been seen as an opportunity to generate traffic and revenue.            world with minimum delay [4].
Spammers post tweets containing typical words of a trend-                  However, although appealing as mechanisms to ease the
ing topic and URLs, usually obfuscated by URL shorteners,               spread of news and allow users to discuss events and post
that lead users to completely unrelated websites. This kind             their status, these services also open opportunities for new
of spam can contribute to de-value real time search services            forms of spam. For instance, trending topics, the most
unless mechanisms to fight and stop spammers can be found.              talked about items on Twitter at a given point in time,
   In this paper we consider the problem of detecting spam-             have been seen as an opportunity to generate traffic and
mers on Twitter. We first collected a large dataset of Twit-            revenue. When noteworthy events occur, thousands of users
ter that includes more than 54 million users, 1.9 billion links,        tweet about it and make them quickly become trending
and almost 1.8 billion tweets. Using tweets related to three            topics. These topics become the target of spammers that
famous trending topics from 2009, we construct a large la-              post tweets containing typical words of the trending topic,
beled collection of users, manually classified into spammers            but URLs that lead users to completely unrelated websites.
and non-spammers. We then identify a number of charac-                  Since tweets are usually posted containing shortened URLs,
teristics related to tweet content and user social behavior,            it is difficult for users to identify the URL content without
which could potentially be used to detect spammers. We                  loading the webpage. This kind of spam can contribute to
used these characteristics as attributes of machine learn-              reduce the value of real time search services unless mecha-
ing process for classifying users as either spammers or non-            nisms to fight and stop spammers can be found.
spammers. Our strategy succeeds at detecting much of the                   Tweet spammers are driven by several goals, such as to
spammers while only a small percentage of non-spammers                  spread advertise to generate sales, disseminate pornography,
are misclassified. Approximately 70% of spammers and 96%                viruses, phishing, or simple just to compromise system repu-
of non-spammers were correctly classified. Our results also             tation. They not only pollute real time search, but they can
highlight the most important attributes for spam detection              also interfere on statistics presented by tweet mining tools
on Twitter.                                                             and consume extra resources from users and systems. All in
                                                                        all, spam wastes human attention, maybe the most valuable
Keywords: spam, twitter, real time search, spammer, mi-                 resource in the information age.
croblogging, online social networks, machine learning.                     Given that spammers are increasingly arriving on Twit-
                                                                        ter, the success of real time search services and mining tools
                                                                        relies at the ability to distinguish valuable tweets from the
1.    INTRODUCTION                                                      spam storm. In this paper, we firstly address the issue of
  Twitter has recently emerged as a popular social system               detecting spammers on Twitter. To do it, we propose a 4-
where users share and discuss about everything, including               step approach. First, we crawled a near-complete dataset
news, jokes, their take about events, and even their mood.              from Twitter, containing more than 54 million users, 1.9
With a simple interface where only 140 character messages               billion links, and almost 1.8 billion tweets. Second, we cre-
can be posted, Twitter is increasingly becoming a system                ated a labeled collection with users “manually” classified as
for obtaining real time information. When a user posts a                spammers and non-spammers. Third, we conducted a study
tweet, it is immediately delivered to her followers, allowing           about the characteristics of tweet content and user behavior
                                                                        on Twitter aiming at understanding their relative discrim-
                                                                        inative power to distinguish spammers and non-spammers.
CEAS 2010 - Seventh annual Collaboration, Electronic messaging, Anti-   Lastly, we investigate the feasibility of applying a super-
Abuse and Spam Conference July 13-14, 2010, Redmond, Washington, US
vised machine learning method to identify spammers. We
found that our approach is able to correctly identify the
majority of the spammers (70%), misclassifying only 3.6%
of non-spammers. We also investigate different tradeoffs for
our classification approach namely, the attribute importance
and the use of different attribute sets. Our results show that
even using different subsets of attributes, our classification
approach is able to detect spammers with high accuracy. We
also investigate the detection of spam instead of spammers.
Although results for this approach showed to be compet-
itive, the spam classification is more susceptible to spam-
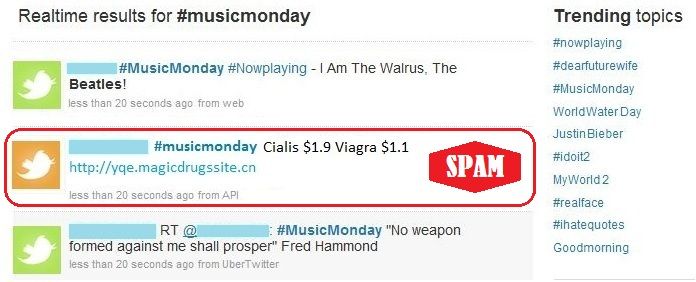
mers that adapt their strategies since it is restricted to a Figure 1: Ilustrative example of a search on Twitter
small and simple set of attributes related to characteristics for the hashtag #musicmonday
of tweets.
The rest of the paper is organized as follows. The next
of trending topics, hashtags, retweets, and anonymized user
section presents a background on Twitter and provides the
names. The second tweet is an example of a tweet spam,
definition of spam used along this work. Section 3 describes
since it contains a hashtag completely unrelated to the URL
our crawling strategy and the labeled collection built from
the tweet points to. In this paper, we consider as spam-
the crawled dataset. Section 4 investigates a set of user at-
mers on Twitter those users who post at least one tweet
tributes and their ability to distinguish spammers and non-
containing a URL considered unrelated to the tweet body
spammers. Section 5 describes and evaluates our strategies
text. Examples of tweet spam are: (i) a URL to a website
to detect spammers and Section 6 surveys related work. Fi-
containing advertisements completely unrelated to a hash-
nally, Section 7 offers conclusions and directions for future
tag on the tweet, and (ii) retweets in which legitimate links
work.
are changed to illegitimate ones, but are obfuscated by URL
shorteners.
2. BACKGROUND AND DEFINITIONS Although there are other forms of opportunistic actions
Twitter is an information sharing system, where users fol- in Twitter, not all of them can be considered as spam. As
low other users in order to receive information along the so- example, there are opportunistic users that follow a large
cial links. Such information consists of short text messages number of people in an attempt to be followed back and
called tweets. Relationship links are directional, meaning then disseminate their messages. Here we do not consider
that each user has followers and followees, instead of unidi- content received through the social links as spam since users
rectional friendship links. Tweets can be repeated through- are free to follow the users they want.
out the network, a process called re-tweeting. A retweeted
message usually starts with “RT @username”, where the @ 3. DATASET AND LABELED COLLECTION
sign represents a reference to the one who originally posted
the messages. Twitter users usually use hashtags (#) to In order to evaluate our approach to detect spammers on
identify certain topics. Hashtags are similarly to a tag that Twitter, we need a labeled collection of users, pre-classified
is assigned to a tweet in its own body text. into spammers and non-spammers. To the best of our knowl-
The most popular hashtags or key words that appear on edge, no such collection is publicly available. We then had
tweets become trending topics. Most of the trending top- to build one. Next, we describe the strategy used to collect
ics reflect shocking and breaking news or events that ap- Twitter in Section 3.1. We then discuss the process used
pear in the mass media. Among the most popular events in to select and manually classify a subset of spammers and
2009 that also became popular trending topics are Michael non-spammers in Section 3.2.
Jackson’s death, Iran election, and the emergence of the 3.1 Crawling twitter
British singer, Susan Boyle, on the TV show Britain’s Got
Talent [2]. In analyzing the characteristics of users in Twitter, ideally
However, the most popular hashtag recorded in 2009 is we would like to have at our disposal data for each existing
not related to news or events that appeared in the tradi- Twitter user, including their social connections, and all the
tional mass media. The hashtag #musicmonday is widely tweets they ever posted. So, to that end, we asked Twit-
used by users to weekly announce tips about music, songs, or ter to allow us to collect such data and they white-listed
concerts. Several users post what kind of song they are lis- 58 servers located at the Max Planck Institute for Software
tening to every Monday and add that hashtag so that others Systems (MPI-SWS), located in Germany1 . Twitter assigns
can search. Such hashtags are conventions created by users each user a numeric ID which uniquely identifies the user’s
that become largely adopted. As example, the first tweet in profile. We launched our crawler in August 2009 to collect
our dataset with this hashtag says: all user IDs ranging from 0 to 80 million. Since no single user
in the collected data had a link to a user whose ID is greater
What are you listening to? Tag it, #musicmonday “Come than 80 million, our crawler has inspected all users with an
Together”- The Beatles. account on Twitter. In total, we found 54,981,152 used ac-
counts that were connected to each other by 1,963,263,821
Figure 1 shows part of the results of a search on Twit- social links. We also collected all tweets ever posted by the
ter for the hashtag #musicmonday. The figure shows three collected users, which consists of a total of 1,755,925,520
tweets that appear as result and contains most of the ele- 1
Part of this work was done when the first author was vis-
ments we discussed here. We can note on the figure a list iting the MPI-SWStweets. Out of all users, nearly 8% of the accounts were set mers and 7,852 non-spammers. Since the number of non-
private, so that only their friends could view their tweets. spammers is much higher than the number of spammers, we
We ignore these users in our analysis. The link information randomly select only 710 of the legitimate users to include
is based on the final snapshot of the network topology at the in our collection, which corresponds to twice the number
time of crawling and we do not know when the links were of spammers. Thus, the total size of our labeled collection
formed. We plan to make this data available to the wider is 1,065 users. Since the user classification labeling process
community. For a detailed description of this dataset we relies on human judgment, which implies in reading a signif-
refer the user to our project homepage [3]. icantly high amount of tweets, we had to set a limit on the
number of users in our labeled collection. Among the forms
3.2 Building a labeled collection of spam found, our volunteers reported a number of web-
sites containing pornography, advertisements, phishing, and
Next, we describe the steps taken to build our labeled col-
even executable files. We plan to make our labeled collection
lection. There are three desired properties that need to be
available to the research community in due time.
considered to create such collection of users labeled as spam-
mers and non-spammers. First, the collection needs to have
a significant number spammers and non-spammers. Second, 4. IDENTIFYING USER ATTRIBUTES
the labeled collection needs to include, but not restricting to, Unlike common Twitter users, people who spam usually
spammers who are aggressive in their strategies and mostly aim at commercial intent (e.g., advertising) and belittlement
affect the system. Third, it is desirable that users are chosen of ideas and system reputation [17]. Since non-spammers
randomly and not based on their characteristics. and spammers have different goals in the system, we expect
In order to meet these three desired properties, we focus they also differ on how they behave (e.g., who they interact
on users that post tweets about three trending topics largely with, which frequency they interact, etc.) to achieve their
discussed in 2009. (1) the Michael Jackson’s death, (2) Su- purposes. Intuitively, we expect that non-spammers spend
san Boyle’s emergence, and (3) the hashtag “#musicmon- more time interacting with other users, doing actions like
day”. Table 1 summarizes statistics about the number of replying, retweeting, posting status without URL, etc. In
tweets we have in our dataset as well as the number of unique order to verify this intuition, we looked at the characteris-
users that spread these tweets. We obtained a key date for tics of the users of the labeled collection. We analyze a large
the event related to Susan Boyle and Michael Jackson; this set of attributes that reflect user behavior in the system as
either corresponds to the date when the event occurred was well as characteristics of the content posted by users, aiming
widely reported in the traditional mass media (TV and news at investigating their relative discriminatory power to dis-
papers) until the last day they appear in our data. For the tinguish one user class from the other. We considered two
#musicmonday we used all tweets with the hashtag. Fig- attribute sets, namely, content attributes and user behavior
ure 2(a) shows an example of the daily frequency of tweets attributes, discussed next.
about #musicmonday accross a two month period. We can
note a clearly week pattern with strong peaks on Mondays. 4.1 Content attributes
The weekly popularity of this hashtag made it become a Content attributes are properties of the text of tweets
popular topic accross most of 2009 and the most popular in posted by users, which capture specific properties related
terms of number of tweets. On the other hand, news and to the way users write tweets. Given that users usually
events have a different pattern with most of the popular- post several tweets, we analyze tweet content characteristics
ity concentrated around the days of the event. Figure 2(b) based on the maximum, minimum, average, and median of
shows peaks on events related to Michael Jackson’s death the following metrics: number of hashtags per number of
and Figure 2(c) shows peaks around Susan Boyle’s perfor- words on each tweet, number of URLs per words, number
mance on the TV show. Table 1 summarizes statistics about of words of each tweet, number of characters of each tweet,
the amount of data used for each event. number of URLs on each tweet, number of hashtags on each
By choosing these events, we include spammers that are tweet, number of numeric characters (i.e. 1,2,3) that appear
aggressive in their strategies and target trending topics. Aim- on the text, number of users mentioned on each tweet, num-
ing at capturing the other two desired properties, we ran- ber of times the tweet has been retweeted (counted by the
domly selected users among the ones that posted at least one presence of ”RT @username” on the text). We also consid-
tweet containing a URL with at least one key work described ered the fraction of tweets with at least one word from a
in Table 1. Then, we developed a website to help volunteers popular list of spam words [1], the fraction of tweets that
to manually label users as spammers or non-spammers based are reply messages, and the fraction of tweets of the user
on their tweets containing #keywords related to the trend- containing URLs. In total, we have 39 attributes related to
ing topics. In order to minimize the impact of human error, content of the tweets.
two volunteers analyzed each user in order to independently Next, we look into three characteristics of the tweet con-
label her or him as spammer or non-spammer. In case of tent that can differ spammers from non-spammers. Figure 3
tie (i.e., each volunteer chooses a class), a third indepen- shows the cumulative distribution function (CDF) for three
dent volunteer was heard. Each user was classified based on content attributes: fraction of tweets containing URLs, frac-
majority voting. Volunteers were instructed to favor non- tion of tweets that contains spam words, and average num-
spammers in case of doubt. For instance, if one was not ber of words that are hashtags on the tweet. We notice from
confident that a tweet was unrelated to music, she should Figure 3 (a) that spammers do post a much higher fraction of
consider it to be non-spammer. The volunteers agreed in tweets with URLs, compared to non-spammers. Naturally,
almost 100% of the analyzed tweets, which reflects a high spammers also post a much larger portion of their tweets
level of confidence to this human classification process. containing spam words than non-spammers, as we can see on
In total, 8,207 users were labeled, including 355 spam- Figure 3 (b). For example, 39% of the spammers posted allTopic Period Keywords Tweets Users
#musicmonday Dec 8,2008—Sep 24,2010 #musicmonday 745,972 183,659
Boyle April 10—Sep 24,2010 “Susan Boyle”, #susanboyle 264,520 146,172
Jackson Jun 25—Sep 24,2010 “Michael Jackson”, #michaeljackson, #mj 3,184,488 1,232,865
Table 1: Summary information of three events considered to construct the labeled collection
80K 700K 25K
Daily number of tweets
Daily number of tweets
Daily number of tweets
20K
60K 500K
15K
40K
300K 10K
20K
5K
100K
0 0
Jul/01 Aug/01 Sep/01 Jun/20 Jul/20 Aug/20 Apr/11 Jun/11 Aug/11
Time (days) Time (days) Time (days)
(a) #musicmonday (b) Michael Jackson (c) Susan Boyle
Figure 2: Daily number of tweets for the three events analyzed
their tweets containing spam words, whereas non-spammers of the user account. Spammers usually have new accounts
typically do not post more than 4% of their tweets contain- probably because they are constantly being blocked by other
ing spam word. This huge discrepancy also reflects the early users and reported to Twitter. Lastly, we look at the number
stage of the spamming process on Twitter. Although a single of tweets posted by the followees of the spammers. Figure 4
mechanisms like a spam word mechanism could filter most (c) shows that non-spammers receive a much large amount
of the spam tweets posted today, such metric can be easily of tweets from their followees in comparison with spammers.
manipulated by spammers. The last attribute we analyze is Some spammers do not even follow other users and just focus
the average fraction of hashtags per tweet posted per user. on quickly post spamming after the account is created.
Figure 3 (c) shows the CDF for this metric. As expected, Other metrics such as the number of times the user was
spammers post a higher fraction of hashtags per tweet. We mentioned by other users and number of times the user was
noted that in our labeled collection some spammers post a replied can be useful to differentiate spammers and promot-
large number of popular hashtags, spanning a large number ers, since they capture the notion of influence of the users
of different trending topics within a single tweet. In general, in the Twitter network [11].
the analysis of these attributes show that characteristics of
the tweet content have potential to differentiate spammers
from non-spammers.
5. DETECTING SPAMMERS
In this section, we investigate the feasibility of applying
a supervised learning algorithm along with the attributes
4.2 User behavior attributes discussed in the previous section for the task of detecting
User attributes capture specific properties of the user be- spammers on Twitter. In this approach, each user is rep-
havior in terms of the posting frequence, social interactions, resented by a vector of values, one for each attribute. The
and influence on the Twitter network. We considered the algorithm learns a classification model from a set of previ-
following metrics as user attributes: number of followers, ously labeled (i.e., pre-classified) data, and then applies the
number of followees, fraction of followers per followees, num- acquired knowledge to classify new (unseen) users into two
ber of tweets, age of the user account, number of times the classes: spammers and non-spammers. Note that, in this
user was mentioned, number of times the user was replied paper, we created a labeled collection. In a practical sce-
to, number of times the user replied someone, number of fol- nario, labeled data may be obtained through various initia-
lowees of the user’s followers, number tweets receveid from tives (e.g., volunteers who help marking spam, professionals
followees, existence of spam words on the user’s screename, hired to periodically manually classify a sample of users,
and the minimum, maximum, average, and median of the etc). Our goal here is to assess the potential effectiveness
time between tweets, number of tweets posted per day and of the proposed approach as a first effort towards detecting
per week. In total, we have 23 attributes about the user spammers.
behavior. We continue by presenting, in Section 5.1, the metrics
Next, we show in detail three characteristics of user be- used to evaluate our experimental results. Section 5.2 de-
havior: the number of followers per number of followees, scribes the classification algorithm, i.e., the classifier, and
the age of the user account, and the number of tweets re- the experimental setup used.
ceived. Figure 4 shows the CDF for these attributes. We can
clearly note by Figure 4 (a) that spammers have a high ratio 5.1 Evaluation metrics
of followers per followees in comparison with non-spammers. To assess the effectiveness of our classification strategies
Spammers try to follow a large number of users as attempt we use the standard information retrieval metrics of recall,
to be followed back, which does not happen for most of the precision, Micro-F1, and Macro-F1 [30]. The recall (r) of a
cases. This behavior makes the fraction of followers per fol- class X is the ratio of the number of users correctly classified
lowees very small for spammers. Figure 4 (b) shows the age to the number of users in class X. Precision (p) of a class X1 1 1
Non−spammers
0.9 Spammers
0.8 0.8 0.8
0.7
0.6 0.6 0.6
CDF
CDF
CDF
0.5
0.4 0.4 0.4
0.3
0.2 0.2 0.2
Non−spammers Non−spammers 0.1
Spammers Spammers
0 0 0
0 0.2 0.4 0.6 0.8 1 0 0.2 0.4 0.6 0.8 1 10−4 10−3 10−2 10−1 100 101
Fraction of tweets with URLs Fraction of tweets with spam word Hashtags per tweet (average)
(a) Fraction of tweets containing URLs (b) Fraction of tweets with spam words (c) Average number of hashtags per
tweet
Figure 3: Cumulative distribution functions of three content attributes
1 1 1
Spammers
Non−spammers
0.8 0.8 0.8
0.6 0.6 0.6
CDF
CDF
CDF
0.4 0.4 0.4
0.2 0.2 0.2
Spammers Spammers
Non−spammers Non−spammers
0 0 0
0.04 0.2 1 5 25 125 0 200 400 600 800 1000 1200 100 101 102 103 104 105 106 107 108
Number of followers per number of followees Account age (days) Number of tweets received
(a) Fraction of followers per followees (b) Age of the user account (c) Number of tweets received
Figure 4: Cumulative distribution functions of three user behavior attributes
is the ratio of the number of users classified correctly to the the class distribution is very skewed, as in our case, to verify
total predicted as users of class X. In order to explain these the capability of the classifier to perform well in the smaller
metrics, we will make use of a confusion matrix [20], illus- classes.
trated in Table 2. Each position in this matrix represents
the number of elements in each original class, and how they 5.2 The classifier and the experimental setup
were predicted by the classification. In Table 2, the preci- We use a Support Vector Machine (SVM) classifier [19],
sion (pspam ) and the recall (rspam ) indices of class spammer which is a state-of-the-art method in classification and ob-
are computed as pspam = a/(a + c) and rspam = a/(a + b). tainned the best results among a set of classifiers tested. The
goal of a SVM is to find the hyperplane that optimally sep-
Predicted arates with a maximum margin the training data into two
Spammer Non-spammer
True Spammer a b portions of an N-dimensional space. A SVM performs clas-
Non-spammer c d sification by mapping input vectors into an N -dimensional
space, and checking in which side of the defined hyperplane
Table 2: Example of confusion matrix the point lies. We use a non-linear SVM with the Radial
Basis Function (RBF) kernel to allow SVM models to per-
The F1 metric is the harmonic mean between both preci- form separations with very complex boundaries. The im-
sion and recall, and is defined as F 1 = 2pr/(p+r). Two vari- plementation of SVM used in our experiments is provided
ations of F1, namely, micro and macro, are usually reported with libSVM [13], an open source SVM package that allows
to evaluate classification effectiveness. Micro-F1 is calcu- searching for the best classifier parameters using the training
lated by first computing global precision and recall values data, a mandatory step in the classifier setup. In particular,
for all classes, and then calculating F1. Micro-F1 considers we use the easy tool from libSVM, which provides a series of
equally important the classification of each user, indepen- optimizations, including normalization of all numerical at-
dently of its class, and basically measures the capability of tributes. For experiments involving the SVM J parameter
the classifier to predict the correct class on a per-user basis. (discussed in Section 5.3), we used a different implementa-
In contrast, Macro-F1 values are computed by first calculat- tion, called SVM light, since libSVM does not provide this
ing F1 values for each class in isolation, as exemplified above parameter. Classification results are equal for both imple-
for spammers, and then averaging over all classes. Macro-F1 mentations when we use the same classifier parameters.
considers equally important the effectiveness in each class, The classification experiments are performed using a 5-
independently of the relative size of the class. Thus, the two fold cross-validation. In each test, the original sample is
metrics provide complementary assessments of the classifi- partitioned into 5 sub-samples, out of which four are used
cation effectiveness. Macro-F1 is especially important when as training data, and the remaining one is used for testingthe classifier. The process is then repeated 5 times, with 100
each of the 5 sub-samples used exactly once as the test data, Spammers as spammers
90 Non as spammers
thus producing 5 results. The entire 5-fold cross validation
was repeated 5 times with different seeds used to shuffle the 80
Percentage (%)
original data set, thus producing 25 different results for each 70
test. The results reported are averages of the 25 runs. With 60
95% of confidence, results do not differ from the average in 50
more than 5%. 40
5.3 Basic classification results 30
Table 3 shows the confusion matrix obtained as the re- 20
sult of our experiments with SVM. The numbers presented 10
are percentages relative to the total number of users in each 0
class. The diagonal in boldface indicates the recall in each 0 0.5 1 1.5 2 2.5 3 3.5 4 4.5 5
class. Approximately, 70% of spammers and 96% of non- SVM parameter (j)
spammers were correctly classified. Thus, only a small frac-
tion of non-spammers were erroneously classified as spam- Figure 5: Impact of varying the J parameter
mers.
A significant fraction (almost 30%) of spammers was mis-
classified as non-spammers. We noted that, in general, these give priority to one class (e.g., spammers) over the other
spammers exhibit a dual behavior, sharing a reasonable num- (e.g., non-spammers) by varying its J parameter2 [24].
ber of non-spam tweets, thus presenting themselves as non- Figure 5 shows classification results when we vary the pa-
spammers most of the time, but occasionally some tweet rameter J. We can note that increasing J leads to a higher
that was considered as spam. This dual behavior masks percentage of correctly classified spammers (with diminish-
some important aspects used by the classifier to differentiate ing returns for J > 0.3), but at the cost of a larger fraction of
spammers from non-spammers. This is further aggravated misclassified legitimate users. For instance, one can choose
by the fact that a significant number of non-spammers post to correctly classify around 43.7% of spammers, misclassi-
their tweets to trending topics, a typical behavior of spam- fying only 0.3% non-spammers (J = 0.1). On the other
mers. Although the spammers our approach was not able hand, one can correctly classify as much as 81.3% of spam-
to detect are occasional spammers, an approach that allow mers (J = 5), paying the cost of misclassifying 17.9% of
one to choose to detect even occasional spammers could be legitimate users. The best solution to this tradeoff depends
of interest. In Section 5.4, we discuss an approach that al- on the system’s objectives. For example, a system might
lows one to trade a higher recall of spammers at a cost of be interested in sending an automatic warning message to
misclassifying a larger number of non-spammers. all users classified as spammers, in which case they might
prefer to act conservatively, avoiding sending the message
Predicted to legitimate users, at the cost of reducing the number of
Spammer Non-spammers
correctly predicted spammers. In another situation, a sys-
True Spammer 70.1% 29.9%
Non-spammer 3.6% 96.4% tem may prefer to filter any spam content and then detect
a higher fraction of spammers, misclassifying a few more le-
Table 3: Basic classification results gitimate users. It should be stressed that we are evaluating
the potential benefits of varying J. In a practical situation,
As a summary of the classification results, Micro-F1 value the optimal value should be discovered in the training data
is 87.6, whereas per-class F1 values are 79.0 and 91.2, for with cross-validation, and selected according to the system’s
spammers and non-spammers, respectively, resulting in an goals.
average Macro-F1 equal to 85.1. The Micro-F1 result in-
dicates that we are predicting the correct class in 87.6% of 5.5 Importance of the attributes
the cases. Complementarily, the Macro-F1 result shows that In order to verify the ranking of importance of these at-
there is a certain degree of imbalance for F1 across classes, tributes we use two feature selection methods available on
with more difficulty for classifying spammers. Comparing Weka [27]. We assessed the relative power of the 60 se-
with a trivial baseline classifier that chooses to classify every lected attributes in discriminating one user class from the
single user as non-spammer, we obtain gains of about 31.4% others by independently applying two well known feature
in terms of Micro-F1, and of 112.8% in terms of Macro-F1. selection methods, namely, information gain and χ2 (Chi
Squared) [31]. Since results for information gain and χ2 are
5.4 Spammer detection tradeoff very similar and both methods ranked 10 attributes in com-
Our basic classification results show we can effectively mon among the top 10, we omitted results for information
identify spammers, misclassifying only a small fraction of gain. Table 4 presents the 10 most important attributes for
non-spammers. However, even the small fraction of misclas- the χ2 method.
sified non-spammers could not be suitable for a detection We can note that two of the most important attributes are
mechanism that apply some sort of automatic punishment the fraction of tweets with URLs and the average number
to users. Additionally, one could prefer identifying more 2
The J parameter is the cost factor by which training er-
spammers at the cost of misclassifying more non-spammers. rors in one class outweigh errors in the other. It is useful,
This tradeoff can be explored using a cost mechanism, when there is a large imbalance between the two classes, to
available in the SVM classifier. In this mechanism, one can counterbalance the bias towards the larger one.Position χ2 ranking
1 fraction of tweets with URLs Micro F1
2 age of the user account 100 Micro F1 baseline
Macro F1
3 average number of URLs per tweet 90 Macro F1 baseline
4 fraction of followers per followees
80
5 fraction of tweets the user had replied
Percentage
6 number of tweets the user replied 70
7 number of tweets the user receive a reply 60
8 number of followees 50
9 number of followers 40
10 average number of hashtags per tweet
30
Table 4: Ranking of the top 10 attributes 20
10
0
All 1−10 11−20 21−30 31−40 41−50 51−62
of URLs per tweet. Although these attributes are redun- 2
Subset of features from Χ ranking
dant, the importance of them highlight an interesting as-
pect of spammers. Spammers are most interested in spread-
ing advertisements that usually points to an website istead Figure 6: Classification results with groups of
of spreading rumors or an specific piece of message. Thus, ranked attributes according to the χ2 feature selec-
spammers usually post URLs whereas non-spammers post a tion algorithm
number of status updates without URLs. We can also note
that spammers are usually associated with new accounts.
Thus, ignore tweets from very new accounts on results of We compare results with a baseline classifier that considers
search or mining tools can be a nice strategy to avoid spam. all users as non-spammers, for each such range. In terms of
Micro-F1, our classification provides gains over the baseline
Tweet content User behavior for the first two subsets of attributes, whereas significant
Top 10 4 6
gains in Macro-F1 are obtained for all attribute ranges, but
Top 20 10 10
Top 30 17 13 the last one (the 10 worst attributes). This confirms the
Top 40 23 17 results of our attribute analysis that shows that even low-
Top 50 31 19 ranked attributes have some discriminatory power. In prac-
Top 62 39 23 tical terms, significant improvements over the baseline are
possible even if not all attributes considered in our experi-
Table 5: Number of attributes at top positions in ments can be obtained.
the χ2 ranking
5.7 Detecting tweets instead of users
Table 5 summarizes the results, showing the number of Our approach for the spam problem on Twitter focuses
attributes from each set (tweet content and user behavior) on the detection of spammers instead of tweets containing
in the top 10, 20, 30, 40, 50 and 62 most discriminative spam. The detection of the spam itself can be useful for
attributes according to the ranking produced by χ2 . Note filtering spam on real time search whereas the detection of
that, both content attributes and user behavior attributes spammers is more associated with the detection of existent
appear balanced along the entire rank. Given that content spam accounts. Once a spammer is detected, it is natural to
attributes are easy to be changed by spammers, such ho- suspend her account or even block IP addresses temporarily
mogeneity means that attributes that are not so easy to be to prevent spammers from continuing posting spam with
manipulated by spammers could be used instead. new accounts.
Once we have understood the importance of the attributes Here, we briefly investigate an approach to detect spam in-
used, we now turn to investigate whether competitive effec- stead of the spammers. We consider the following attributes
tiveness can be reached with fewer attributes or different for each tweet: number of words from a list of spam words,
sets of attributes. number of hashtags per words, number of URLs per words,
number of words, number of numeric characters on the text,
5.6 Reducing the attribute set number of characters that are numbers, number of URLs,
The detection of spammers on Twitter is a form of ad- number of hashtags, number of mentions, number of times
versarial fight between spammers and anti-spammers mech- the tweet has been replied (counted by the presence of “RT
anisms. In the long term, it is expect that spammers will @username” on the text), and lastly we verified if the tweet
evolve and adapt to anti-spammers strategies (i.e. using was posted as a reply.
fake accounts to forge some attributes) [12]. Consequently, Table 6 shows the resulting confusion matrix obtained
some attributes may become less important whereas others from the SVM classifier when we use as labeled collection,
may acquire importance with time. Thus, it is important the tweets classified as spam and non-spam. We can note
to understand if different sets of attributes could lead our that approximately 78.5% of spam and 92.5% of the non-
approach to accurate classification results. spam tweets were correctly classified. Although we are able
Next, we compute the classification results considering dif- to misclassify less spam in comparison to our basic clas-
ferent subsets of 10 attributes that occupy contiguous po- sification of spammers, about 7.5% of the non-spam tweets
sitions in the ranking (i.e., the first top 10 attributes, the were classified as spam. This happens because for the spam-
next 10 attributes, etc) are used. Figure 6 shows Micro-F1 mer detection problem, some user present a dual behavior, a
and Macro-F1 values for the basic classification for the χ2 . problem that we do not have with the classification of tweets.However, when users post non-spam tweets containing sus- senders for each communication. Our approach is comple-
pect content, i.e. spam words, more than two hashtags, etc., mentary to Ostra, since we focused on dynamically detecting
the classifier can make mistakes. the originators of spam messages on real time search and Os-
In terms of accuracy (Micro F1), results for both classifi- tra is focused on making the life of originators of messages
cation strategies are very similar: 87.2% for spam detection harder as a form to prevent the problem.
and 87.6% for spammer detection. Given that the metrics There has been a few concurrent work that reported the
used for the classification of spam are based only on the existence of spam on Twitter. Kuak et al. [21] has reported
tweet content, they could be more easily manipulated by spam on the twitter data they collected. In order to filter
spammers. Although it is useful to have simple forms of spam and proceed with their analysis, they filter tweets from
spam detection in real time search systems, other techniques users who have been on Twitter for less than a day as well as
are equally important. In a scenario where spammers evolve tweets that contain three or more trending topics. Indeed,
their detection strategies and manipulate tweet content to in our work we have observed that these two characteristics
make it look like a common tweet, simple detection schemes represent important attributes to different spammers from
would fail. non-spammers. However, our strategy uses a larger set of
other attributes and a machine learning technique instead
Predicted of fixed thresholds. Yard et al. [32] studied the behavior of
Spam Non-spam
a small group of spammers, finding that they exhibit very
True Spam 78.5% 21.5%
Non-spam 92.5% 7.5% different behavior from non-spammers in terms of posting
tweets, replying tweets, followers, and followees. However,
Table 6: Detection of spam instead of spammers they study the behavior of a different form of attack, where
users automatically follow a number of other users expecting
In Table 7 we show the results for detection of spammers reciprocity. Similarly, Wang [26] collected thousands users
without considering any metric related to the tweet content. on Twitter and used classification to distinguish the suspi-
We can note that even removing all attributes related to the cious behaviors from normal ones. In this paper, we focus
content of tweets, we are still able to find spammer accounts on spammers that affect search considering a near-complete
with reasonable accuracy (84.5%), using only the attributes dataset from Twitter as well as a manually built collection
related to user behavior. of spammers and non-spammers. More important, we lever-
age our study about the characteristics of users and propose
Predicted a spammer detection mechanism.
Spammer Non-spammers
True Spammer 69.7% 30.3%
Non-spammer 4.3% 95.7%
Table 7: Impact on spammer detection results when
removing attributes related to tweets 7. CONCLUSIONS AND FUTURE WORK
In this paper we approached the problem of detecting
spammers on Twitter. We crawled the Twitter site to ob-
tain more than 54 million user profiles, all their tweets and
6. RELATED WORK links of follower and followees. Based on this dataset and us-
Spam has been observed in various applications, including ing manual inspection, we created a labeled collection with
e-mail [9], Web search engines [14], blogs [25], videos [7, 8], users classified as spammers or non-spammers. We provided
and opinions [18]. Consequently, a number of detection and a characterization of the users of this labeled collection,
combating strategies have been proposed [16,22,29]. Partic- bringing to the light several attributes useful to differentiate
ularly, there has been a considerable number of efforts that spammers and non-spammers. We leverage our characteri-
rely on machine learning to detect spam. Castillo et al. [10] zation study towards a spammer detection mechanism. Us-
proposed a framework to detect Web spamming which uses ing a classification technique, we were able to correctly iden-
a classification approach and explore social network met- tify a significant fraction of the spammers while incurring in
rics extracted from the Web graph. Similarly, Benevenuto a negligible fraction of misclassification of legitimate users.
et al. [6] approached the problem of detecting spammers We also investigate different tradeoffs for our classification
on video sharing systems. By using a labeled collection of approach and the impact of different attribute sets. Our re-
users manually classified, they applied a hierarchical ma- sults show that even with different subsets of attributes, our
chine learning approach to differentiate opportunistic users approach is able to detect spammers with high accuracy. We
from the non-opportunistic ones in video sharing systems. also investigate the feasibility of detecting spam instead of
Classification has also showed to be efficient to detect image- spammers. Although results for this approach showed to be
based email that contains spam [5, 28]. competitive, the spammer classification uses a much larger
Another interesting approach to prevent spam consists of set of attributes and is more robust to spammers that adapt
white-listing users so that each user specifies a list of users their spamming strategies.
who they are willing to receive content from. “RE” [15] is a We envision three directions towards which our work can
white-listing system for email based on social links that al- evolve. First, we intend to explore other refinements to the
lows emails between friends and friends-of-friends to bypass proposed approach such as the use of different classification
standard spam filters. Socially-connected users provide se- methods. Second, we plan to increase and improve our la-
cure attestations for each others’ email messages while keep- beled collection in a collaborative manner, including tweets
ing users’ contacts private. More recently, Mislove et al. [23] with other popular hashtags. Finally, we aim at investigat-
propose Ostra, a mechanism that imposes an upfront cost to ing other kinds of attacks on Twitter.Acknowledgments approaches and future challenges. IEEE Internet
We sincerely thank Krishna P. Gummadi for his valuable Computing, 11, 2007.
comments and suggestions. [18] N. Jindal and B. Liu. Opinion spam and analysis. In
Int’l Conference on Web Search and Web Data Mining
(WSDM), 2008.
8. REFERENCES [19] T. Joachims. Text categorization with support vector
[1] List of spam words. machines: Learning with many relevant features. In
http://codex.wordpress.org/Spam Words. European Conference on Machine Learning (ECML),
[2] Top twitter trends in 2009. http://blog.twitter. 1998.
com/2009/12/top-twitter-trends-of-2009.html. [20] R. Kohavi and F. Provost. Glossary of terms. Special
[3] Twitter dataset homepage. Issue on Applications of Machine Learning and the
http://twitter.mpi-sws.org. Knowledge Discovery Process, Machine Learning, 30,
[4] Google Adds Live Updates to Results, The New York 1998.
Times, December 2009. http://nyti.ms/cnszI5. [21] H. Kwak, C. Lee, H. Park, and S. Moon. What is
[5] H. Aradhye, G. Myers, and J. Herson. Image analysis twitter, a social network or a news media? In Int’l
for efficient categorization of image-based spam World Wide Web Conference (WWW), 2010.
e-mail. In Int’l Conference on Document Analysis and [22] Y. Lin, H. Sundaram, Y. Chi, J. Tatemura, and
Recognition (ICDAR), 2005. B. Tseng. Detecting splogs via temporal dynamics
[6] F. Benevenuto, T. Rodrigues, V. Almeida, J. Almeida, using self-similarity analysis. ACM Transactions on
and M. Gonçalves. Detecting spammers and content the Web (TWeb), 2, 2008.
promoters in online video social networks. In Int’l [23] A. Mislove, A. Post, K. Gummadi, and P. Druschel.
ACM Conference on Research and Development in Ostra: Leverging trust to thwart unwanted
Information Retrieval (SIGIR), 2009. communication. In Symposium on Networked Systems
[7] F. Benevenuto, T. Rodrigues, V. Almeida, J. Almeida, Design and Implementation (NSDI’08), 2008.
M. Gonçalves, and K. Ross. Video pollution on the [24] K. Morik, P. Brockhausen, and T. Joachims.
web. First Monday, 15(4), April 2010. Combining statistical learning with a knowledge-based
[8] F. Benevenuto, T. Rodrigues, V. Almeida, J. Almeida, approach - a case study in intensive care monitoring.
and K. Ross. Video interactions in online video social In Int’l Conference on Machine Learning (ICML),
networks. ACM Transactions on Multimedia 1999.
Computing, Communications and Applications [25] A. Thomason. Blog spam: A review. In Conference on
(TOMCCAP), 5(4):1–25, 2009. Email and Anti-Spam (CEAS), 2007.
[9] P. Calais, D. Pires, D. Guedes, J. W. Meira, [26] A. Wang. Don’t follow me: Spam detection in twitter.
C. Hoepers, and K. Steding-Jessen. A campaign-based In Int’l Conference on Security and Cryptography
characterization of spamming strategies. In (SECRYPT), 2010.
Conference on e-mail and anti-spam (CEAS), 2008. [27] I. Witten and E. Frank. Data Mining: Practical
[10] C. Castillo, D. Donato, A. Gionis, V. Murdock, and machine learning tools and techniques. Morgan
F. Silvestri. Know your neighbors: Web spam Kaufmann, 2005.
detection using the web topology. In Int’l ACM [28] C. Wu, K. Cheng, Q. Zhu, and Y. Wu. Using visual
SIGIR, 2007. features for anti-spam filtering. In IEEE Int’l
[11] M. Cha, H. Haddadi, F. Benevenuto, and Conference on Image Processing (ICIP), 2005.
K. Gummadi. Measuring User Influence in Twitter: [29] Y. Xie, F. Yu, K. Achan, R. Panigrahy, G. Hulten,
The Million Follower Fallacy. In Int’l AAAI and I. Osipkov. Spamming botnets: Signatures and
Conference on Weblogs and Social Media (ICWSM). characteristics. In ACM SIGCOMM, 2008.
[12] F. Douglis. On social networking and communication [30] Y. Yang. An evaluation of statistical approaches to
paradigms. IEEE Internet Computing, 12, 2008. text categorization. Information Retrival, 1, 1999.
[13] R. Fan, P. Chen, and C. Lin. Working set selection [31] Y. Yang and J. Pedersen. A comparative study on
using the second order information for training svm. feature selection in text categorization. In Int’l
Journal of Machine Learning Research (JMLR), 6, Conference on Machine Learning (ICML), 1997.
2005. [32] S. Yardi, D. Romero, G. Schoenebeck, and D. Boyd.
[14] D. Fetterly, M. Manasse, and M. Najork. Spam, damn Detecting spam in a Twitter network. First Monday,
spam, and statistics: Using statistical analysis to 15(1), 2010.
locate spam web pages. In Int’l Workshop on the Web
and Databases (WebDB), 2004.
[15] S. Garriss, M. Kaminsky, M. Freedman, B. Karp,
D. Mazières, and H. Yu. Re: Reliable email. In
USENIX Conference on Networked Systems Design &
Implementation (NSDI), 2006.
[16] Z. Gyöngyi, H. Garcia-Molina, and J. Pedersen.
Combating web spam with trustrank. In Int’l.
Conference on Very Large Data Bases (VLDB), 2004.
[17] P. Heymann, G. Koutrika, and H. Garcia-Molina.
Fighting spam on social web sites: A survey ofYou can also read