2019 Sustainable Community Indicators - Oil Sands Community Alliance Nichols Applied Management Inc - Oil Sands ...
←
→
Page content transcription
If your browser does not render page correctly, please read the page content below
2019 Sustainable Community Indicators
Submitted to:
Oil Sands Community Alliance
Submitted by:
Nichols Applied Management Inc.
Management and Economic Consultants

August 2019
Table of Contents
1.    Introduction ........................................................................................................... 2
      1.1      Background............................................................................................. 2
      1.2      2019 Update ........................................................................................... 2
      1.3      Data Limitations ...................................................................................... 2
2.    Summary of Findings ............................................................................................ 3
3.    Demographics ....................................................................................................... 9
      3.1      Population Growth Rate .......................................................................... 9
      3.2      Population by Age and Sex .................................................................. 10
      3.3      Population Migration ............................................................................. 11
4.    Housing ............................................................................................................... 13
      4.1      House Prices ........................................................................................ 13
      4.2      Housing Starts ...................................................................................... 15
      4.3      Housing Affordability Measure 1 (General) ........................................... 17
      4.4      Housing Affordability Measure 2 (Fixed Income) .................................. 19
      4.5      Housing Availability............................................................................... 21
5.    Education ............................................................................................................ 23
      5.1      Educational Attainment ......................................................................... 23
      5.2      Average Class Size .............................................................................. 25
      5.3      Accountability Pillar Survey Results...................................................... 27
6.    Health Services ................................................................................................... 29
      6.1      Physicians per 10,000 Population......................................................... 29
      6.2      Length of Stay in Emergency Department ............................................ 31
7.    Labour Force....................................................................................................... 33
      7.1      Labour Force by Industry ...................................................................... 33
      7.2      Labour Market Participation and Unemployment Rates ........................ 34
      7.3      Average Work Commute Time.............................................................. 36
8.    Economy ............................................................................................................. 37
      8.1      Business Bankruptcies ......................................................................... 37
      8.2      Percentage Change in Number of Business Establishments ................ 39
9.    Cost of Living ...................................................................................................... 40
      9.1      Affordability (Median Income) ............................................................... 40
      9.2      Affordability (Modest Income) ............................................................... 42
10.   Transportation ..................................................................................................... 44
      10.1     Traffic Collision Rates ........................................................................... 44
11.   Community .......................................................................................................... 46
      11.1     Crime Rates .......................................................................................... 46
      11.2     Donations ............................................................................................. 48
      11.3     Voter Participation ................................................................................ 50
      11.4     Recreation Features ............................................................................. 52
      11.5     Entertainment Facilities ........................................................................ 53
      11.6     Childcare Spaces.................................................................................. 54
      11.7     Ethnic Origin ......................................................................................... 56
      11.8     Access to Assisted Living ..................................................................... 58
12.   References.......................................................................................................... 59
1. Introduction
1.1 Background
The Sustainable Community Indicators were developed initially through a multi-stakeholder process that began in June 2003. Representatives of a number
of stakeholders, including the Regional Municipality of Wood Buffalo (Wood Buffalo) and the Regional Issues Working Group (RIWG) reviewed over 1,000
potential indicators, and in an iterative process selected 21 indicators to measure the quality of life in the Wood Buffalo region, identify pressure points, and
track progress to sustainability. These indicators were first presented in detailed and summary reports published in January 2006 and then subsequently
updated in 2011 and 2015 at the request of the Oil Sands Community Alliance (OSCA).
1.2 2019 Update
The Wood Buffalo region has recently undergone significant changes, including both the 2016 Horse River wildfire and the recent dampening of activity in
the oil sands industry, the main driver for the local economy. The 2019 update is timely, in that it can provide a picture of how the region has changed in
light of recent events.
Identifying appropriate and effective ways of measuring a community’s wellbeing remains a pertinent discussion in the Wood Buffalo region. With a view to
further contributing to this discussion, OSCA has commissioned an update of the sustainable community indicators last presented in 2015. These
indicators reflect the social and economic pillars of community sustainability. They cover such topics as: demographics, housing, education, health
services, labour force, economy, cost of living, transportation, and community. This update includes those indicators outlined in the 2006, 2011, and 2015
reports, as well as several other indicators added at the request of OSCA. Measuring a community’s wellbeing is an especially complicated and broad
undertaking and it is recognized that there are other potential indicators.
This document captures the key findings of the 2019 update exercise. For most indicators, it offers visual snapshots of indicator performance for the most
recent year for which data is available, as well as over time for Fort McMurray / the Wood Buffalo region and comparator communities (most often Grande
Prairie and Medicine Hat), against a baseline of most often Edmonton or the province as a whole. Along with key findings for each indicator, the report
offers additional insights and observations to better understand the results (i.e., the story behind the findings), where possible.
1.3 Data Limitations
It is important to note that often the most recent information available relates to data collected one or more years ago. As such, the indicator data is
representative of social and economic conditions prevailing at that time and not necessarily indicative of conditions in 2019. This is especially important as
the Wood Buffalo region and comparator communities included in this report experience periodic fluctuations in economic and social conditions.
Community Indicators 2019 Report 22. Summary of Findings
The community indicators presented in this report provide a mixed picture of the quality of life in Fort McMurray and the Wood Buffalo region, highlighting
both strengths and weaknesses. Where recent data is available (i.e. 2017 and 2018), the indicator results capture many of the impacts from the 2016
Horse River and the oilsands industry slowdown. Consideration of current results within the context of historical trends is also provided for many indicators
and helps to illustrate how the community has changed from previous periods (e.g. the major growth period of the early to mid 2000s). Some of the
indicator findings conform to popular expectations, while other findings contradict those expectations.
The following provides a high-level summary of key indicator findings for each indicator category. Additional detail and findings can be found in Sections 4
to 11 of this report.
Indicator Category: Indicators:
Population Growth Rate
Demographics
Population by Age and Sex
Population Migration
Key Findings
Although the Federal Census shows an average annual regional growth rate of 1.8% between 2011 and 2016, the average masks underlying year-
to-year fluctuations in population. A more recent population estimate can be found in the 2018 municipal census which shows the first population
decline in the region in the past two decades. Based on municipal census results, this decline was the largest among comparator communities,
although it should be noted that some communities only have municipal census results to 2016.
Net migration to the Wood Buffalo region has fluctuated considerably over the years, from as high as roughly 6% in 2006 to as low as approximately
-6% in 2015. Because of these fluctuations, net migration of residents to the Wood Buffalo region was consistently higher than elsewhere in Alberta
to 2012, and then consistently lower than elsewhere in Alberta from 2014 to present day. These fluctuations are mostly the result of rapid expansion
of the local economy followed by rapid contraction, driven by the oil sands industry.
Ample work opportunities over the past two decades have attracted relatively young workers to the region, helping to keep Wood Buffalo’s median
age below that of other comparator communities. Despite the relatively young population, the median age in the Wood Buffalo region has increased
in recent years, from 31.7 in 2011 to 33.1 in 2016. During this timeframe the region has seen a decrease in the number of people aged 15 to 29.
The availability of high paying employment opportunities in occupations largely dominated by men helps to explain the higher proportion of males in
Fort McMurray (54%) as compared to other communities (46%-51%).
Community Indicators 2019 Report 3Indicator Category: Indicators:
House prices Cost of housing to income (fixed
Housing income)
Housing starts
Housing availability
Cost of housing to income (general)
Key Findings
Although the average house price in Fort McMurray has declined steadily in recent years – from a high of roughly $765,000 in 2014 to
approximately $571,00 in 2018 – prices remain above those in comparator communities. The drop in house prices, and associated erosion in home
equity, is a concern for many current homeowners. Even so, the relatively high costs of home ownership in Fort McMurray continue to adversely
impact the community’s competitive position in attracting workers and their families.
Housing starts for the Wood Buffalo region have fluctuated over the past decade but remain well below levels seen in the mid-2000s. In more recent
years, housing starts as a percentage of the total housing stock in the Wood Buffalo region were below all comparators in 2016, then rose to a rate
well above all comparators in 2017, before finally declining back to being roughly in line with other comparators in 2018. The spike in housing starts
for Fort McMurray in 2017 reflects the rebuilding efforts in the community following the 2016 wildfire.
Taking into consideration income levels in each community:
o rental housing in Fort McMurray was relatively more affordable in 2016 than in comparator communities. The affordability of rental housing in
Fort McMurray improved slightly between 2007 and 2013 due to relatively stable rental rates coupled with increasing income levels. From 2013
to 2016, the relative affordability of rental housing in Fort McMurray improved considerably, largely due to declining rental rates.
o the affordability of home ownership in Fort McMurray is worse than in either the Cities of Grande Prairie or Medicine Hat, but better than in the
City of Edmonton. The affordability of housing in Fort McMurray has consistently improved since 2008, largely as a result of increasing incomes
in the 2008 to 2014 period and then decreasing house prices in the 2014 to 2016 period.
For households with low to modest fixed incomes, rental housing is consistently less affordable in Fort McMurray in 2018 than in Edmonton and
other communities. However, for these same households, rental housing in Fort McMurray is more affordable in 2018 as compared to 2007.
The availability of rental and owned housing in the Wood Buffalo region has improved considerably and is now higher than in comparator
communities.
Community Indicators 2019 Report 4Indicator Category: Indicators:
Educational attainment
Education Average class size
Accountability pillar survey results
Key Findings
The proportion of the population in the Wood Buffalo region with trades certification decreased, while the proportion with university credentials
increased over the 2006 to 2016 timeframe. This could be a reflection of shifts in the oil sands sector from construction to operations, thereby
increasing the number of occupations in the local economy requiring a university credential
Although all selected communities have similar class sizes (kindergarten to grade 3), Fort McMurray had the lowest average class size in 2017 at
approximately 19 students. Average kindergarten to grade 3 class size in Fort McMurray has fluctuated somewhat over time but has been generally
comparable to the provincial average.
High school completion rates in Fort McMurray are higher than or comparable to most selected comparators. However, the percentage of students
transitioning from high school to post-secondary, within six years of entering grade 10, is lower than in Medicine Hat and Edmonton, and lower than
the provincial average.
The proportion of students meeting the acceptable PAT (Provincial Achievement Test) standard in Fort McMurray is above that of most comparators
but similar to that of the City of Edmonton.
Indicator Category: Indicators:
Physicians per 10,000 population
Health Services
Length of stay in emergency department
Key Findings
At the end of 2018, Fort McMurray had approximately 12 physicians per 10,000 population, which is less than that of the Cities of Edmonton,
Medicine Hat and Grande Prairie. Although Fort McMurray has relatively fewer physicians per-capita, it should be noted that:
o the number of physicians in a community is a reflection of a number of factors including the nature and breadth of health services, such as
specialty services, and is not entirely indicative of the relative access to primary health services.
o there is some data which points to improving access to primary care physician services in Fort McMurray (e.g. an increase in the number of
physicians in the region over the past five years, several physicians at the Wood Buffalo Primary Care Network accepting new patients).
As of early 2017, patients discharged from the emergency department at the Northern Lights Regional Health Centre in Fort McMurray spent, on
average, less time waiting than patients at emergency departments in comparator communities. In fact, for a number of years the Northern Lights
Regional Health Centre in Fort McMurray has consistently had shorter average wait times than emergency departments in comparator communities.
Average wait times at the Northern Lights Regional Health Centre have also been decreasing over time.
Community Indicators 2019 Report 5Indicator Category: Indicators:
Labour force by industry
Labour Force
Labour market rates
Average work commute time
Key Findings
Not surprisingly, roughly 30% of Fort McMurray’s resident workforce is in the oil and gas industry, as compared to the provincial average of just six
percent. Nearly half of Fort McMurray’s resident workforce is in just three industries: oil and gas (30%), construction (10%), and retail (8%).
As of 2016, the labour force participation rate in the Wood Buffalo region is comparable to or higher than in comparator communities, while the
unemployment rate is lower in Wood Buffalo than comparator communities. More recent information (i.e. 2017 and 2018) for census agglomerations
that encompass the comparator communities and surrounding areas suggest that the Wood Buffalo region continues to have higher labour force
participation and lower unemployment rates than its comparators.
A higher proportion of commuters commute more than 15 minutes in the City of Edmonton than in Fort McMurray; however, Fort McMurray’s
proportion is significantly higher than that of the Cities of Grande Prairie and Medicine Hat, and slightly higher than that of the province overall. This
is largely the result of commutes to project sites and facilities which exist outside Fort McMurray. For example, roughly 1 in 5 commuters living in
Fort McMurray have an average daily work commute of 60 minutes or more, well above all other comparators, including Edmonton (5%).
Indicator Category: Indicators:
Bankruptcies
Economy
Number of business establishments
Key Findings
Bankruptcies declined significantly in all communities since 2009, before rising slightly after 2014 in most communities. From 2010 to 2018, Fort
McMurray has had a bankruptcy rate that is relatively comparable to, or lower than, most selected communities and the provincial average.
The number of active business establishments in the Wood Buffalo region has dropped by 20% between 2015 and 2018, the largest drop among all
other comparators including the provincial average. All comparators suffered a drop in number of business establishments during the 2015-2018
period, with the exception of Grande Prairie. This decrease is mostly attributable to challenging economic conditions which has led to a decrease in
the number of business establishments in many communities across Alberta, including in Wood Buffalo. Business establishments in the Wood
Buffalo region would also have been impacted by the 2016 Horse River wildfire.
Community Indicators 2019 Report 6Indicator Category: Indicators:
Affordability (median income)
Cost of Living
Affordability (modest income
Key Findings
The affordability of the Wood Buffalo region relative to comparator communities implies that many census families in the Wood Buffalo region are
earning incomes that are more than high enough to compensate for the relatively high cost of living in the region. For couples earning the median
income, the Wood Buffalo region has consistently been more affordable over time than comparator communities. This also generally holds true for
median income lone-parent families and non-family persons and relates mostly to incomes being higher in Fort McMurray than in comparator
communities. These findings are based on the median income and do not relate to census families earning less than the median income.
For lone-parent families earning relatively modest incomes, the Wood Buffalo region was slightly more affordable in 2016 than the City of Grande
Prairie, but less affordable than the Cities of Edmonton and Medicine Hat. The affordability of the Wood Buffalo region for modest income earning
lone-parent families in 2016 is roughly on par with what it was in 2007. This is also true for modest income earning couple families and non-family
persons.
Indicator Category: Indicators:
Traffic collision rates
Transportation
Key Findings
Collision rates on Highway 63, both north and south of Fort McMurray, are below the provincial averages for primary highways. Since about 2007,
collision rates have been declining along a number of segments of Highway 63. The effect of the completion of the Highway 63 twinning project,
combined with traffic safety measures taken by industry, and reduced traffic volumes along some segments of Highway 63, has translated to lower
collision rates in recent years, resulting in a welcome change to a long-term issue for residents in the region and a priority for the provincial
government.
Community Indicators 2019 Report 7Indicator Category: Indicators:
Crime rates Entertainment index
Community
Donations Childcare spaces
Voter participation Ethnic origin
Recreation features Access to assisted living facilities
Key Findings
Historically, the overall crime rate in Fort McMurray has been substantially higher than in the Cities of Edmonton and Medicine Hat as well as the
province overall but similar to that in the City of Grande Prairie. However, Fort McMurray’s crime rate has been declining steadily since about 2008
and is now well below that of the City of Grande Prairie and more in line with crime rates in other comparator communities and the province overall.
Since 2012, donations in the Wood Buffalo region have remained below that of the Cities of Edmonton and Medicine Hat and the provincial average
but have generally remained on par with the City of Grande Prairie. Donations have increased in the 2016 to 2017 timeframe, possibly as a result of
permanent residents donating to non-profit organizations to address impacts of the 2016 wildfire.
Voter participation rates in the Wood Buffalo region have been increasing both provincially and municipally in recent years; however, they generally
remain below that of comparator districts and communities including the province overall.
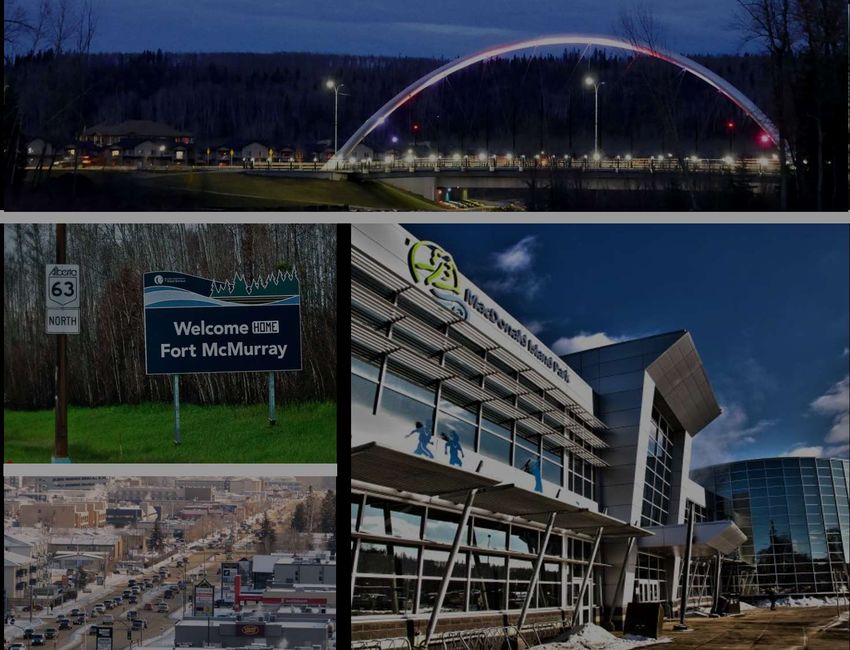
The MacDonald Island facility has over half a million square feet of interior space (excluding the municipal library), representing about 7.1 square
feet on a per capita basis. Compared to the population served, the facility size is roughly 1.5 times larger than the Eastlink Centre in Grande Prairie
and over 2.5 times larger than the Family Leisure Centre in Medicine Hat. The MacDonald Island was built as a flagship facility and it is truly that –
providing residents with ample and varied sport, recreation and meeting space.
Fort McMurray offers fewer food and beverage establishments, as well as gambling and racing facilities, on a per capita basis as compared to the
selected communities. However, Fort McMurray does offer a similar amount of amusement, cinema, spectator sports establishments on a per capita
basis as compared to most of the selected communities. It’s important to note that although this indicator provides a relative comparison of the
number of establishments, it does not consider other factors such as the quality of these establishments (i.e., size, age, condition).
The demand for childcare spaces relative to the available supply for both age groups in Fort McMurray have declined since 2015, reflecting
increases in the supply of regulated spaces and decreases in demand resulting from a reduced population. However, in the 0 to 5 age group, Fort
McMurray remains the highest of all the comparator communities. In the 6 to 12 age group, Fort McMurray is higher only than Edmonton and
Medicine Hat, remaining below the ratio for Grande Prairie and the province overall.
The Wood Buffalo region has relatively fewer people with a European ethnic origin and relatively more people with a North American (non-
Indigenous) ethnic origin than the comparator communities.
Fort McMurray has the lowest total assisted living units per 1,000 population 65 years and over out of all the selected comparator communities. A
long-awaited purpose-built continuing care facility for Fort McMurray (The Willow Square Continuing Care Centre) is set to open in the fall of 2019.
The addition of the facility will substantially increase the assisted living units available in the community.
Community Indicators 2019 Report 83. Demographics
3.1 Population Growth Rate
INDICATOR DEFINITION: The population growth rate indicator
Population Growth, Federal Census Results
presents annual population growth rates for Fort McMurray, the
Average Annual Regional Municipality of Wood Buffalo (i.e. Wood Buffalo), and other
2016 Federal Census
Community Growth Rate (2011 to comparator communities based on the most recent federal and
Results
2016) municipal census results.
Fort McMurray 66,573 1.9% KEY FINDINGS:
Federal Census: The population growth rate in Fort McMurray and
Wood Buffalo 71,589 1.8%
the Wood Buffalo region was higher than that of the City of Medicine
Grande Prairie (City) 63,166 2.6% Hat, but lower than that of the City of Grande Prairie, the City of
Medicine Hat (City) 63,260 1.1% Edmonton and of Alberta overall.
Municipal Census: The population growth rate in Fort McMurray
Edmonton (City) 932,546 2.8%
and the Wood Buffalo region is lower than that of all the comparator
Alberta 4,067,175 2.2% communities.
Source: Statistics Canada 2016 Census
UNDERSTANDING THE RESULTS: The 2018 municipal census for
Population Growth, Municipal Census Results the Wood Buffalo region shows the first population decline in the region
in the past two decades (RMWB 2018). The areas which showed the
Most Recent Municipal
Average Annual Growth largest population decline from 2015 to 2018 are three neighborhoods
Community Municipal Census
Rates which were significantly impacted by the 2016 wildfire (RMWB 2018).
Census Results1
Based on municipal census results, the decline in Fort McMurray’s
Fort McMurray 2018 73,974 2015-2018 period: -2.7% population was the largest among comparator communities, although it
Wood Buffalo 2018 77,094 2015-2018 period: -2.9% should be noted that some communities only have municipal census
results to 2016.
Grande Prairie
2018 69,088 2015-2018 period: 0.3% Although the Federal Census shows an average annual regional growth
(City)
rate of 1.8% between 2011 and 2016, the average masks underlying
Medicine Hat year-to-year fluctuations in population. In addition, the 2016 Federal
2015 63,018 2012-2015 period: 1.0%
(City) Census does not take into account the more recent changes in
Edmonton (City) 2016 899,447 2014-2016 period: 1.2% population resulting from the 2016 Horse River wildfire.
Source: AMA 2019a; Note: Population for Fort McMurray and Wood Buffalo includes
the permanent and resident shadow populations.
Community Indicators 2019 Report 93.2 Population by Age and Sex
INDICATOR DEFINITION: This indicator provides a breakdown by age
Population by Age and Sex, 2016
and sex of the population of the Wood Buffalo region and other comparator
Community Median Age % Male % Female communities in Alberta, as well as the province as a whole.
Wood Buffalo (CA) 33.1 54% 46% KEY FINDINGS: The population of the Wood Buffalo region is younger
than the population of all comparator communities except Grande Prairie,
Grande Prairie (CA) 31.9 51% 49% and it has a higher proportion of males than all comparator communities
Medicine Hat (CA) 40.1 49% 51% (including Grande Prairie).
Edmonton (CMA) 36.3 50% 50% UNDERSTANDING THE RESULTS: Ample work opportunities over the
past two decades have attracted relatively young workers to the region,
Alberta 36.7 50% 50%
helping to keep Wood Buffalo’s median age below that of other comparator
Source: Statistics Canada 2016 Census. Notes: CA is Census Area and CMA is
Census Metropolitan Area. Numbers may not add due to rounding. communities. The availability of high paying employment opportunities in
occupations largely dominated by men helps to explain the higher
proportion of males in Fort McMurray as compared to other communities.
Despite the relatively young population, the median age in the Wood
Buffalo region has increased in recent years, from 31.7 in 2011 to 33.1 in
2016. During this timeframe the region has seen a decrease in the number
of people aged 15 to 29. The proportion of males remained at 54% from
2011 to 2016. These estimates relate to the permanent population as
enumerated in the Federal Census. It does not include the region’s non-
permanent (i.e. shadow) population.
Community Indicators 2019 Report 103.3 Population Migration
Population Migration, 2015 to 2017
Wood Buffalo region (CD 16) | Grande Prairie region (CD 19) | Edmonton CMA | Alberta
2%
1%
Proportion of net migration
0%
-1%
-2%
-3%
-4%
-5%
-6%
-7%
2015 2016 2017
Source: Statistics Canada 2019a, b. Notes: CD is Census Division, CMA is Census Metropolitan Area. Migration data is for the period from July 1 to June 30, whereas
population data is for January 1 to December 31. Net migration calculations exclude residents living in temporary accommodations (i.e., work camps, hotels).
INDICATOR DEFINITION: The migration indicator provides an estimate of net migration from inside and outside of Canada to Wood Buffalo and other
selected regions of Alberta. Net migration considers immigration, interprovincial migration, and intra-provincial migration. Note: Annual migration data is
available from Statistics Canada at the level of Census Metropolitan Area and Census Division.
KEY FINDINGS: Net migration of residents (excluding those living in temporary accommodations) to the Wood Buffalo region has been negative and
consistently lower than elsewhere in Alberta for the last few years. Net migration to Wood Buffalo has increased, from approximately -6% in 2015 to -2%
in 2017
UNDERSTANDING THE RESULTS: The recent contraction of the oil and gas industry has reduced the number of jobs available in the Wood Buffalo
region, which in turn has meant more people are leaving the community than are moving into the community. Net migration to Wood Buffalo remains
negative in 2017, but is higher than preceding years, likely because the bulk of out migration related to poor economic conditions already occurred in the
2015 to 2016 period.
Community Indicators 2019 Report 11Population Migration, Historical Trend
Wood Buffalo region (CD 16) | Grande Prairie region (CD 19) | Edmonton CMA | Alberta
8%
6%
Proportion of net migration
4%
2%
0%
-2%
-4%
-6%
-8%
2006 2007 2008 2009 2010 2011 2012 2013 2014 2015 2016 2017
Source: Statistics Canada 2019a, b. Notes: CD is Census Division, CMA is Census Metropolitan Area. Migration data is for the period from July 1 to June 30, whereas
population data is for January 1 to December 31. Net migration calculations exclude residents living in temporary accommodations (i.e., work camps, hotels).
THE HISTORICAL TREND: Net migration of residents to the Wood Buffalo region was consistently higher than elsewhere in Alberta to 2012, and then
consistently lower than elsewhere in Alberta from 2014 to present day. Net migration to the Wood Buffalo region has fluctuated considerably over the
years, from as high as roughly 6% in 2006 to as low as approximately -6% in 2015.
Over the past decade, rapid expansion of the local economy followed by a rapid contraction, driven by the oil sands industry, has created fluctuations in
population migration to the Wood Buffalo region.
Community Indicators 2019 Report 124. Housing
4.1 House Prices
Average Single-Family Dwelling Price, 2018
$700,000
$600,000
Average house price
$500,000
$400,000
$300,000
$200,000
$100,000
$0
Fort McMurray Edmonton Grande Prairie Medicine Hat
Source: FMREB 2019a, MHREB 2019a, RAE 2019a, GPAAR 2019.
INDICATOR DEFINITION: The housing indicator provides the price of an average single-family dwelling in selected communities.
KEY FINDINGS: The price of a single-family home in Fort McMurray in 2018 was higher than all other comparators.
UNDERSTANDING THE RESULTS: Although house prices are higher in Fort McMurray, incomes are also higher, as shown in section 4.3, helping to
offset the relatively higher housing costs for some households.
Community Indicators 2019 Report 13Average House Prices, Historical Trend
Wood Buffalo | Grande Prairie | Medicine Hat | Edmonton
$900,000
$800,000
$700,000
Average house price
$600,000
$500,000
$400,000
$300,000
$200,000
$100,000
$0
2007 2008 2009 2010 2011 2012 2013 2014 2015 2016 2017 2018
Source: FMREB 2019a, FMREB 2019b, MHREB 2019a, MHREB 2019b, RAE 2019a, RAE 2019, GPAAR 2019.
THE HISTORICAL TREND: The price of a home in Fort McMurray has been higher than all other comparators for more than a decade. Although
average house price has been declining steadily since 2014, it remains above prices in comparator communities. On one hand, the recent drop in house
prices, and associated erosion in home equity, is a concern for many current homeowners. On the other hand, the relatively high costs of home
ownership continue to adversely impact the community’s relative competitiveness in attracting workers and their families.
Community Indicators 2019 Report 144.2 Housing Starts
Housing Starts as a Proportion of Total Housing Stock, 2016 to 2018
Wood Buffalo | Grande Prairie | Medicine Hat | Edmonton | Alberta
8%
Housing starts as a proportion of total
7%
6%
housing stock
5%
4%
3%
2%
1%
0%
2016 2017 2018
Source: CMHC 2019a, Statistics Canada 2016.
INDICATOR DEFINITION: The housing starts indicator provides an estimate of the number of residential buildings for which construction has begun
(i.e., when concrete has been poured) as a proportion of the total housing stock.
KEY FINDINGS: Housing starts as a percentage of the total housing stock in the Wood Buffalo region were below all comparators in 2016, then rose to
a rate well above all comparators in 2017, before finally declining back to being roughly in line with other comparators in 2018.
UNDERSTANDING THE RESULTS: Although housing starts are generally indicative of construction activity in a region, the spike in housing starts for
Fort McMurray in 2017 reflects the rebuilding efforts in the community following the 2016 wildfire.
Community Indicators 2019 Report 15Housing Starts as a Proportion of Total Housing Stock, Historical Trend
Wood Buffalo | Grande Prairie | Medicine Hat | Edmonton | Alberta
14%
Housing starts as a proportion of total
12%
10%
housing stock
8%
6%
4%
2%
0%
2006 2007 2008 2009 2010 2011 2012 2013 2014 2015 2016 2017 2018
Source: CMHC 2019a, Statistics Canada 2016.
THE HISTORICAL TREND: Housing starts for the Wood Buffalo region have fluctuated over the past decade but remain well below levels seen in the
mid-2000s. Starts as a proportion of total housing stock in Fort McMurray have generally been in line with other comparator communities, including the
province as a whole, except for highs in both 2007 and 2017.
Community Indicators 2019 Report 164.3 Housing Affordability Measure 1 (General)
See following page for indicator definition and more fulsome description of the results.
One Bedroom Apartment (Rental) Affordability Index Single-Family Dwelling (Ownership) Affordability Index
(Edmonton 2007=100) (Edmonton 2007=100)
Fort McMurray | Grande Prairie | Medicine Hat | Edmonton Fort McMurray | Grande Prairie | Medicine Hat | Edmonton
200 180
180 160
Ownership affordability index
160
Rental affordability index
140
140
120
120
100
100
80
80
60
60
40 40
20 20
0 0
2007 2008 2009 2010 2011 2012 2013 2014 2015 2016 2007 2008 2009 2010 2011 2012 2013 2014 2015 2016
Source: Statistics Canada 2019c, CMHC 2019a. Note: The higher the value, the Source: Statistics Canada 2019c, GoA 2019, AMA 2019b, FMREB 2019a, MHREB
more affordable the cost of housing is compared to Edmonton. 2019a, RAE 2019a, GPAAR 2019. Note: The higher the value, the more affordable
the cost of housing is compared to Edmonton.
KEY FINDINGS: As of 2016, rental housing in Fort McMurray is relatively KEY FINDINGS: Although the affordability of home ownership in Fort
more affordable than in the comparator communities. The affordability of McMurray is worse than in either the Cities of Grande Prairie or Medicine
rental housing in Fort McMurray improved slightly between 2007 and 2013 Hat, it is better than in the City of Edmonton. Housing affordability in Fort
due to relatively stable rental rates coupled with increasing income levels. McMurray has consistently improved since 2008, largely as a result of
From 2013 to 2016, the relative affordability of rental housing in Fort increasing incomes in the 2008 to 2014 period and then decreasing house
McMurray improved considerably, largely due to declining rental rates. prices in the 2014 to 2016 period.
Community Indicators 2019 Report 17INDICATOR DEFINITION: The One Bedroom Apartment and Single Family Dwelling Affordability indices are relative measures of housing affordability,
based on the proportion of families – couple families, lone-parent families and non-family persons (individuals) – earning less than the required income
to obtain housing of that type in Fort McMurray and comparator communities. The indices track changes in relative affordability within and between
communities, using the average Edmonton rental and ownership costs in 2007 as the respective index reference.
Income level thresholds are based on the income required to rent an average one-bedroom apartment or own an average single-family dwelling and
stay within the widely accepted housing cost-to-income ratio of 30%. With respect to housing costs:
For rental housing, costs are based on average rental rates as reported by the Canada Mortgage and Housing Company (CMHC). CMHC rates are
based on all rental units captured in their annual survey, representing a mix of services and amenities, such as heat, power, water and parking that
may be included or excluded, depending on the property manager.
For home ownership, costs are based on the average annual sale price for single family homes, average monthly carrying costs (assuming a 10%
down payment, 20-year amortization period, and a 5-year fixed term at competitive interest rates), and average monthly property taxes and utility
costs.
UNDERSTANDING THE RESULTS:
Information for this indicator is only available to 2016 as that is the most recent year for which taxfiler data is available from Statistics Canada. With
respect to more recent changes in dwelling costs:
In 2018 the average rent for a one-bedroom apartment in Fort McMurray was $1,233, roughly equal to that in 2016 ($1,251).
In 2018 the average sale price for a single-family dwelling in Fort McMurray was $571,579, a drop of roughly 13% since 2016. The lack of
post-2016 income data precludes the updating of this indicator to reflect recent developments in the Fort McMurray owned housing market.
However, the drop in housing prices suggest that the affordability of single-family dwellings has improved, assuming incomes have
remained largely comparable to 2016 levels.
Even with recent decreases in average rental rates and house prices in Fort McMurray, they are still among the highest for major centres in Alberta.
For example, in 2018 the average rental rate for a one-bedroom apartment and the price of a single-family house were 21% and 28% higher than in
Edmonton, respectively. Even so, when median income levels are considered, the affordability of rental and ownership housing in Fort McMurray
remains better than in Edmonton.
Rental rates in northern communities with resource-based economies, such as Fort McMurray and Grande Prairie, are typically more volatile than
rates in communities elsewhere in the province, such as Edmonton and Medicine Hat. All four communities, however, demonstrate similar price
trends for home ownership.
Community Indicators 2019 Report 184.4 Housing Affordability Measure 2 (Fixed Income)
Average Apartment Rent as a Proportion of Modest Income, 2016 to 2018
Wood Buffalo | Grande Prairie | Medicine Hat | Edmonton
50%
45%
40%
35%
Proportion
30%
25%
20%
15%
10%
5%
0%
2016 2017 2018
Source: CMHC 2019a
INDICATOR DEFINITION: The cost of housing to income indicator is a measure of housing affordability for residents with relatively modest income
based on the percentage of a $40,000 per year income required to rent an average apartment in Fort McMurray and other comparator communities over
time. A household income of $40,000 has been selected as a ‘representative income’ for households with a modest income. For reference, median
household income in Alberta in 2015 was $93,835.
KEY FINDINGS: For households with modest incomes, rental housing is consistently less affordable in Fort McMurray than in Edmonton and other
communities, representing between 40% and 45% of an income of $40,000 over the past few years.
Community Indicators 2019 Report 19Average Apartment Rent as a Proportion of Modest Income, Historical Trend
Wood Buffalo | Grande Prairie | Medicine Hat | Edmonton
70%
60%
50%
Proportion
40%
30%
20%
10%
0%
2007 2008 2009 2010 2011 2012 2013 2014 2015 2016 2017 2018
Source: CMHC 2019a
THE HISTORICAL TREND: For residents living on modest incomes, rental housing in Fort McMurray is more affordable in 2018 as compared to 2007.
Rental rates in the Wood Buffalo region declined from 2014 to 2016 and have remained at an average of approximately $1,400 per month to 2018. This
has reduced the differential between Wood Buffalo and the comparator communities.
Not all Fort McMurray residents benefit from relatively higher-earning opportunities or housing allowances as a means of offsetting relatively high
housing costs. Modest-income residents (e.g., workers employed in the service sector, lone-parent, and single-income households) are under particular
pressure to find affordable accommodation.
Despite decreasing in recent years, the price of housing in Fort McMurray remains a challenge to recruiting and retaining staff, especially in sectors
where wage rates are relatively low, such as social services and the service sector. Housing costs also disproportionately affect vulnerable groups in the
region, such as single mothers and those with low levels of engagement in the labour market.
Community Indicators 2019 Report 204.5 Housing Availability
Rental Vacancy Rate Index (Edmonton 2007=100), 2016 to Owned Housing Availability Index (Edmonton 2007=100),
2018 2016 to 2018
Wood Buffalo | Grande Prairie | Medicine Hat | Edmonton Wood Buffalo | Grande Prairie | Medicine Hat | Edmonton
1,800 1,000
1,600 900
Rental vacancy rates index
Active listings/sales index
1,400 800
700
1,200
600
1,000
500
800
400
600
300
400 200
200 100
0 0
2016 2017 2018 2016 2017 2018
Source: CMHC 2019a Source: FMREB 2019a, FMREB 2019b, RAE 2019a, MHREB 2019a, MHREB
2019b, RAE 2019b, GPAAR 2019.
INDICATOR DEFINITION: The Rental Vacancy Rate Index is a relative measure of the availability of rental housing based on a comparison of rental
vacancy rates in Fort McMurray and comparator communities over time with Edmonton in 2007. The Owned Housing Availability Index is a relative
measure of the availability of owned housing in Fort McMurray and comparator communities over time with Edmonton in 2007. The availability of owned
housing is based on a supply/demand ratio determined from MLS data from various Alberta real estate boards.
KEY FINDINGS: The availability of both owned and rental housing in Fort McMurray has increased in recent years and is relatively higher than in
comparator communities.
UNDERSTANDING THE RESULTS: Improvements in owned housing availability in Fort McMurray in recent years is the result both of an increase in
active listings and a decrease in the number of sales. Rental vacancy rates in Fort McMurray have also increased in recent years, reaching 22% in
2018, higher than all other comparators.
Community Indicators 2019 Report 21Rental Vacancy Rate Index (Edmonton 2007=100), Historical Owned Housing Availability Index (Edmonton 2007=100),
Trend Historical Trend
Wood Buffalo | Grande Prairie | Medicine Hat | Edmonton
Wood Buffalo | Grande Prairie | Medicine Hat | Edmonton
1,600
2,500
1,400
Active listings/sales index
Rental vacancy rate index
2,000 1,200
1,000
1,500
800
1,000 600
400
500
200
0
0
2007 2008 2009 2010 2011 2012 2013 2014 2015 2016 2017 2018
2007 2008 2009 2010 2011 2012 2013 2014 2015 2016 2017 2018
Source: FMREB 2019a, FMREB 2019b, RAE 2019a, MHREB 2019a, MHREB
Source: CMHC 2019a
2019b, RAE 2019b, GPAAR 2019.
THE HISTORICAL TREND: The availability of rental and owned housing in the Wood Buffalo region has improved considerably and is now much
higher than in comparator communities. The largest increases for the availability of both rental and owned housing since 2007 have occurred in the
Wood Buffalo region.
Community Indicators 2019 Report 225. Education
5.1 Educational Attainment
Proportion of Population with an Apprenticeship or Trades Proportion of Population with a University Certificate, Diploma
Certificate or Diploma, 2016 or Degree, 2016
18% 35%
16%
30%
14%
25%
12%
Proportion
Proportion
10% 20%
8% 15%
6%
10%
4%
5%
2%
0% 0%
Wood Grande Medicine Alberta Edmonton Edmonton Alberta Wood Grande Medicine
Buffalo Prairie Hat Buffalo Prairie Hat
Source: Statistics Canada 2016 Source: Statistics Canada 2016
INDICATOR DEFINITION: This indicator presents the proportion of the population (aged 25 to 64) with either: an apprenticeship, trade certificate or
diploma; or, a university certificate, diploma or degree.
KEY FINDINGS: The Wood Buffalo region has a higher percentage of persons with trades certification than all other comparator communities. The
Wood Buffalo region has a higher percentage of persons with university credentials than the City of Medicine Hat and the City of Grande Prairie, but a
lower percentage than that of the City of Edmonton and the province overall.
UNDERSTANDING THE RESULTS: The relatively higher proportion of persons with trades certification in the Wood Buffalo region is reflective of the
engagement of the regional labour force in the oil sands industry and the educational requirements for many positions within the industry.
Community Indicators 2019 Report 23Proportion of Population with an Apprenticeship or Trades Proportion of Population with a University Certificate, Diploma
Certificate or Diploma, Historical Trend or Degree, Historical Trend
Wood Buffalo | Grande Prairie | Medicine Hat | Edmonton | Alberta Wood Buffalo | Grande Prairie | Medicine Hat | Edmonton | Alberta
35% 35%
30% 30%
25% 25%
Proportion
Proportion
20% 20%
15% 15%
10% 10%
5% 5%
0% 0%
2006 2011 2016 2006 2011 2016
Source: Statistics Canada 2006, 2011 and 2016. Note: Data is only available for Source: Statistics Canada 2006, 2011 and 2016. Note: Data is only available for
census years. census years.
THE HISTORICAL TREND: The proportion of the population in the Wood Buffalo region with trades certification decreased, while the proportion with
university credentials increased over the 2006 to 2016 timeframe. This could be a reflection of shifts in the oil sands sector from construction to
operations, thereby increasing the number of occupations in the local economy requiring a university credential.
Community Indicators 2019 Report 245.2 Average Class Size
Average Class Size, Kindergarten to Grade 3, 2017
25
Average class size (K to 3)
20
15
10
5
0
Edmonton Grande Prairie Alberta Medicine Hat Fort McMurray
Source: Alberta Education 2019
INDICATOR DEFINITION: This indicator presents the average class size for each community for all kindergarten to grade 3 classes. The kindergarten
to grade 3 group was chosen as this is the group that most benefits from having smaller class sizes and is a focus of the province’s recent class size
initiative (Auditor General of Alberta 2018).
KEY FINDINGS: Although all selected communities have similar class sizes, Fort McMurray had the lowest average class size in 2017 at approximately
19 students.
UNDERSTANDING THE RESULTS: The province has noted that smaller class sizes can positively impact learning outcomes, especially at younger
grades. Funding for and monitoring of class sizes has been an initiative since 2004. The target of 17 students for the kindergarten to grade 3 group has
not yet been reached for any of the comparator communities (Auditor General of Alberta 2018).
Community Indicators 2019 Report 25Average Class Size, Kindergarten to Grade 3, Historical Trend
Fort McMurray | Grande Prairie | Medicine Hat | Edmonton | Alberta
24
22
Average class size (K to 3)
20
18
16
14
12
10
2011 2012 2013 2014 2015 2016 2017
Source: Alberta Education 2019. Notes: The y-axis does not begin at zero in order to show more detail in the variability between communities.
THE HISTORICAL TREND: As shown above, average kindergarten to grade 3 class sizes for the selected comparators have typically ranged between
roughly 18 and 22 students. Average kindergarten to grade 3 class size in Fort McMurray has fluctuated somewhat over time but has been generally
comparable to the provincial average.
Community Indicators 2019 Report 265.3 Accountability Pillar Survey Results
Percentage of Students Completing High School Within Three Percentage of Students Transitioning from High School to
Years of Entering Grade 10 Post-Secondary Within Six Years of Entering Grade 10
2011 to 2013 | 2015 to 2017 | 2018 2011 to 2013 | 2015 to 2017 | 2018
90% 70%
80%
High school completion rate
60%
70%
50%
Transition rate
60%
50% 40%
40% 30%
30%
20%
20%
10%
10%
0% 0%
Fort Grande Medicine Hat Edmonton Alberta Fort Grande Medicine Hat Edmonton Alberta
McMurray Prairie McMurray Prairie
Source: FMPSD 2018, FMCSD 2018, GP No. 2357 2018, GP Catholic 2018, MH Source: FMPSD 2018, FMCSD 2018, GP No. 2357 2018, GP Catholic 2018, MH
No. 76 2018, MH Catholic 2018, Edmonton No. 7 2018, Edmonton Catholic 2018. No. 76 2018, MH Catholic 2018, Edmonton No. 7 2018, Edmonton Catholic 2018.
INDICATOR DEFINITION: This indicator measures the percentage of INDICATOR DEFINITION: This indicator measures the percentage of
students who complete high school within three years of entering grade students who have enrolled in a post-secondary program within six years
10. of entering grade 10.
KEY FINDINGS: High school completion rates have generally improved KEY FINDINGS: Transition rates are variable from year-to-year. The
over time for all selected communities. Although Fort McMurray shows one transition rate in Fort McMurray increased from the 2011 to 2013 period to
of the smallest increases over time, its rate is still higher than or the 2015 to 2017 period, but then declined in 2018. The transition rate in
comparable to most selected comparators. Fort McMurray is similar to the City of Grande Prairie, but lower than all
other comparator communities including the provincial average.
UNDERSTANDING THE RESULTS: The accountability pillar survey is completed by each school jurisdiction in the province each year and is used to
measure progress over time. Recent changes in Fort McMurray’s accountability pillar survey results is likely influenced by a number of factors, including
changing economic conditions in the region, the impact of the 2016 wildfire, and the relative availability of post-secondary opportunities.
Community Indicators 2019 Report 27Percent of Students Meeting Acceptable Provincial Standards Percent of Students Meeting Excellent Provincial Standards
2011 to 2013 | 2015 to 2017 | 2018 2011 to 2013 | 2015 to 2017 | 2018
90% 25%
80%
70% 20%
PAT acceptable
PAT excellent
60%
15%
50%
40%
10%
30%
20% 5%
10%
0% 0%
Fort Grande Medicine Hat Edmonton Alberta Fort Grande Medicine Hat Edmonton Alberta
McMurray Prairie McMurray Prairie
Source: FMPSD 2018, FMCSD 2018, GP No. 2357 2018, GP Catholic 2018, MH Source: FMPSD 2018, FMCSD 2018, GP No. 2357 2018, GP Catholic 2018, MH
No. 76 2018, MH Catholic 2018, Edmonton No. 7 2018, Edmonton Catholic 2018. No. 76 2018, MH Catholic 2018, Edmonton No. 7 2018, Edmonton Catholic 2018.
INDICATOR DEFINITION: This indicator shows the percentage of INDICATOR DEFINITION: This indicator shows the percentage of
students who achieve the acceptable standard on grades 3, 6 and 9 students who achieve the excellent standard on grades 3, 6 and 9
Provincial Achievement Tests (PATs) overall for all subjects. Provincial Achievement Tests (PATs) overall for all subjects.
KEY FINDINGS: The proportion of students meeting the acceptable PAT KEY FINDINGS: The proportion of students meeting the excellent PAT
standard in Fort McMurray is above that of most comparators but similar to standard in Fort McMurray is roughly similar to the province overall, lower
that of the City of Edmonton. Fort McMurray’s rate has declined from the than the City of Edmonton, and above the Cities of Grande Prairie and
2011 to 2013 period to 2018. Medicine Hat. Fort McMurray’s rate has been variable over time declining
from the 2011 to 2013 period to the 2015 to 2017 period, and then
increasing in 2018.
UNDERSTANDING THE RESULTS: The accountability pillar survey is completed by each school jurisdiction in the province each year and is used to
measure progress over time. Recent changes in Fort McMurray’s accountability pillar survey results is likely influenced by a number of factors, including
changing economic conditions in the region and the impact of the 2016 wildfire.
Community Indicators 2019 Report 286. Health Services
6.1 Physicians per 10,000 Population
Physicians per 10,000 Population by Community, October 1, 2018 to December 31, 2018
45
40
Physicians per 10,000 population
35
30
25
20
15
10
5
0
Edmonton Medicine Hat Grande Prairie Fort McMurray
Source: CPSA 2018a.
INDICATOR DEFINITION: This indicator presents the number of physicians per 10,000 population for selected communities.
KEY FINDINGS: At the end of 2018, Fort McMurray had approximately 12 physicians per 10,000 population, which is less than that of the Cities of
Edmonton, Medicine Hat and Grande Prairie.
UNDERSTANDING THE RESULTS: The recruitment and retention of health care professionals and support staff is a challenge experienced by health
care facilities across the country that is intensified in northern communities, often due to their remote location, limited supply of housing options, and
higher cost of living.
It should be noted that the number of physicians in a community is a reflection of a number of factors including the nature and breadth of health
services, including specialty services, and is not entirely indicative of the relative access to primary health services. For example, the relatively high
number of physicians per capita in Edmonton is at least partially attributable to the city being a centre for many province-wide services (e.g. specialists).
Community Indicators 2019 Report 29Physicians per 10,000 Population by Health Care Zone, Historical Trend
North Zone | Central Zone | Alberta
30.0
Physicians per 10,000 population
25.0
20.0
15.0
10.0
5.0
0.0
2003 2004 2005 2006 2007 2008 2009 2010 2011 2012 2013 2014 2015 2016 2017
Source: CPSA 2018b.
Notes: Community-specific data is only available for 2018. The historical trend is only available by health care zone. The Wood Buffalo Region is in the North Zone.
THE HISTORICAL TREND: The number of physicians per 10,000 population in the North Zone, which encompasses the Wood Buffalo region, has
remained below that of the Central Zone, which encompasses the City of Edmonton, as well as the provincial average for over 15 years.
While health staffing issues remain a concern in the North Zone, improvements have been made in recent years, reaching approximately 11 physicians
per 10,000 population in 2015 and remaining at that level to 2017.
Although the physician count data for Fort McMurray and comparator communities is not readily publicly available on a consistent basis over time, there
is some data which points to improving access to primary care physician services in Fort McMurray. Specifically:
According to the College of Physicians and Surgeons of Alberta (CPSA), there were 87 physicians practicing in Fort McMurray as of late 2018, an
increase of over 20% from 68 physicians in 2013 (CPSA 2013, 2018a).
According to the Wood Buffalo Primary Care Network website, there are 10 physicians accepting new patients as of May 2019, up slightly from nine
physicians in 2013 (WBPCN 2013, 2019).
Community Indicators 2019 Report 306.2 Length of Stay in Emergency Department
Average Length of Stay in the Emergency Department for Discharged Patients (2016/17)
4.0
3.5
Average Length of Stay (hours)
3.0
2.5
2.0
1.5
1.0
0.5
0.0
Edmonton Medicine Hat Lethbridge Grande Prairie Fort McMurray
Source: AHS 2015, 2016, 2017.
Note: The data relates to the following emergency departments: Northern Lights Regional Health Centre (Fort McMurray); Chinook Regional Hospital (Lethbridge);
Queen Elizabeth II Hospital (Grande Prairie); Medicine Hat Regional Hospital (Medicine Hat); and average of emergency departments across Edmonton Zone
(Edmonton).
INDICATOR DEFINITION: The average patient’s length of time (hours) in the emergency department from the time a patient is assessed by a nurse
until the time they are discharged. This is calculated as the median length of stay which means that 50 per cent of patients stay in the emergency
department this length of time or less.
KEY FINDINGS: As of early 2017, patients discharged from the emergency department at the Northern Lights Regional Health Centre in Fort McMurray
spent, on average, less time waiting than patients at emergency departments in Edmonton, Medicine Hat, Grande Prairie, and Lethbridge. In fact,
performance reporting from Alberta Health Services indicates that the Northern Lights Regional Health Centre had the shortest length of stay for
discharged patients across all 17 of the busiest emergency departments in Alberta (AHS 2017).
UNDERSTANDING THE RESULTS: See Historical Trend below
Community Indicators 2019 Report 31You can also read