Central American Bank for Economic Integration Office of the Chief Economist - BCIE
←
→
Page content transcription
If your browser does not render page correctly, please read the page content below
Central American Bank for Economic Integration
Office of the Chief Economist

                                                 1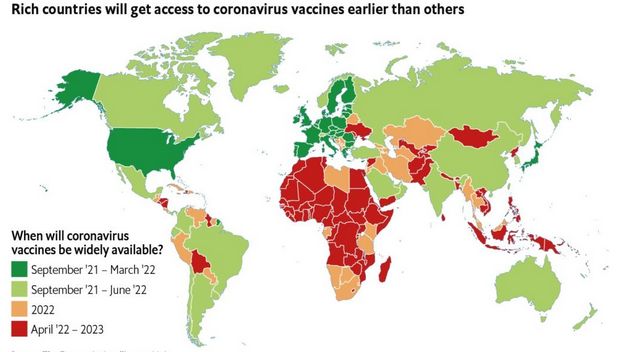
Central American Bank for Economic Integration
Office of the Chief Economist

The economic situation report presents a broad analysis of the world's macroeconomic performance and a
focused analysis of the Central American region. The report was prepared under the leadership of Florencia T.
Castro-Leal PhD Chief Economist of CABEI. Research and drafting were carried out by Miguel Ángel Medina
Fonseca (Economist) and Carmen Elisa Méndez (Junior Economist), the revision was overseen by Armando
Enrique Navarrete (Principal Economist) and CABEI Secretariat provided the English translation service. The
content of this publication is the responsibility of the authors and does not necessarily reflect the official position
of CABEI.

                                                                                                                     2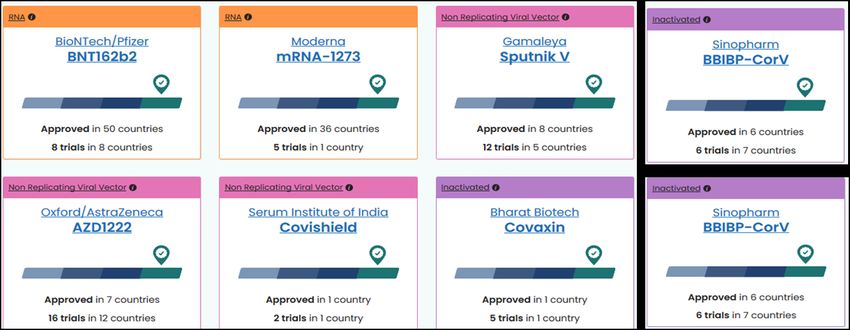
Central American Bank for Economic Integration
Office of the Chief Economist

                                                                        CONTENTS

I.     VACCINATION AGAINST COVID-19 IS MAKING PROGRESS BUT HERD IMMUNITY WILL BE ACHIEVED
       AFTER 2021 ..................................................................................................................................................... 4

II.    WORLD ECONOMY PRESENTS POSITIVE ECONOMIC PROSPECTS FOR 2021 .............................................. 10

III. CENTRAL AMERICA PRESERVES MOMENTUM WHILE FISCAL CHALLENGES PERSIST ................................. 17

ANNEX 1. FOREIGN CURRENCY LONG-TERM SOVEREIGN DEBT RATING ........................................................... 23

REFERENCES ......................................................................................................................................................... 24

                                                                                                                                                                       3
Central American Bank for Economic Integration
 Office of the Chief Economist

                                  MONTHLY ECONOMIC SITUATION REPORT
                                            JANUARY 2021

I. VACCINATION AGAINST COVID-19 IS MAKING PROGRESS BUT HERD IMMUNITY WILL BE
   ACHIEVED AFTER 2021

 The second wave of COVID-19 is registering mixed results around the world in 2021. The virus has infected
 more than 95.8 million people (about 1.2% of the world population), of which 68.4 million have recovered and
 2.0 million have lost their lives, with a mortality rate of 2.1%.

 The American and European continents have the highest number of confirmed cases globally, with 40.5% and
 28.9% as of January 18. The United States (U.S.) is the most affected country, registering more than 150,000 new
 cases per day since mid-November; on January 8, 2021, it peaked at more than 308,000 daily cases.

 The six countries with the highest number of confirmed cases are Brazil, Russia, France, The United States, India,
 and the United Kingdom, representing 55.9% of total cases. The first three are showing an upward infection
 curve, while the remaining contagion is slowing.

 Figure 1. New daily cases of COVID-19 in the world (7-day rolling average)

 Source: Our World in Data with information of de Johns Hopkins University CSSE COVID-19 as of January 18, 2021.
 https://ourworldindata.org/coronavirus

                                                                                                                   4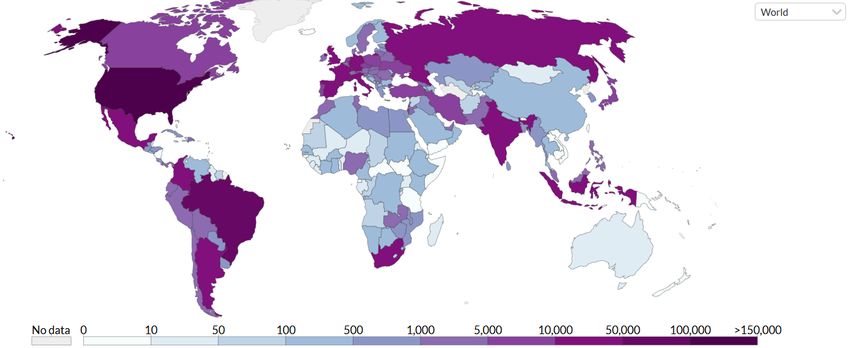
Central American Bank for Economic Integration
Office of the Chief Economist

Graph 1. Evolution of daily-confirmed cases of COVID-19 in the world's most affected countries.

 Source: Office of the Chief Economist with information from Johns Hopkins University, Coronavirus Resource Center as of January 18,
2021 https://coronavirus.jhu.edu/data/new-cases

Latin America and the Caribbean region show heterogeneous results. While in Brazil, Colombia, Peru, Mexico,
Chile, Guatemala, El Salvador, Honduras, and the Dominican Republic, new cases are increasing, others such as
Argentina, Belize, Nicaragua, Costa Rica, and Panama remain constant or with downward trends.

Central American confirmed cases exceed one million people. More than 715,000 patients have recovered,
20,082 registered deaths with a mortality rate of 2.0%, lower than that of the rest of the world. Nevertheless,
there are variations at the country level, which may be due to underreporting the number of confirmed cases
associated with asymptomatic people.

.

                                                                                                                                  5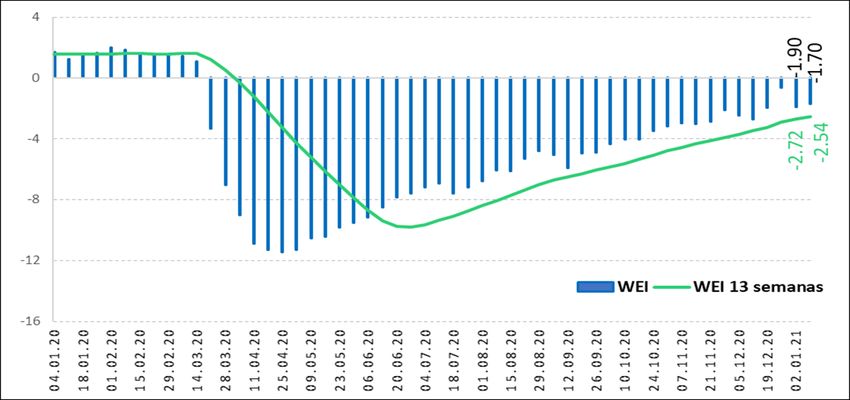
Central American Bank for Economic Integration
Office of the Chief Economist

Graph 2. Cumulative confirmed cases, number of deaths and mortality rate (number of persons and percentage).

Source: Office of the Chief Economist with Woldometers COVID-19 Coronavirus Pandemic information as of January 18, 2021.
https://coronavirus.jhu.edu/data/new-caseshttps://www.worldometers.info/coronavirus/#countries

Eight COVID-19 vaccines were approved in recent weeks. The Pfizer / BioNTech and Moderna vaccines were
registered in 50 and 36 countries, respectively, making them the most widely approved in the world. CABEI
partner countries have focused on three vaccines: Pfizer / BioNTech has been approved by Argentina, Colombia,
Costa Rica, Spain, Mexico, and Panama; AstraZeneca / Oxford for Argentina, El Salvador, Mexico and the
Dominican Republic; and Sputnik V de Gamaleya for Argentina.

Figure 2. Vaccines approved throughout the world.

Source: COVID-19 Vaccine Tracker as of January 18, 2021. https://covid19.trackvaccines.org/vaccines/

                                                                                                                      6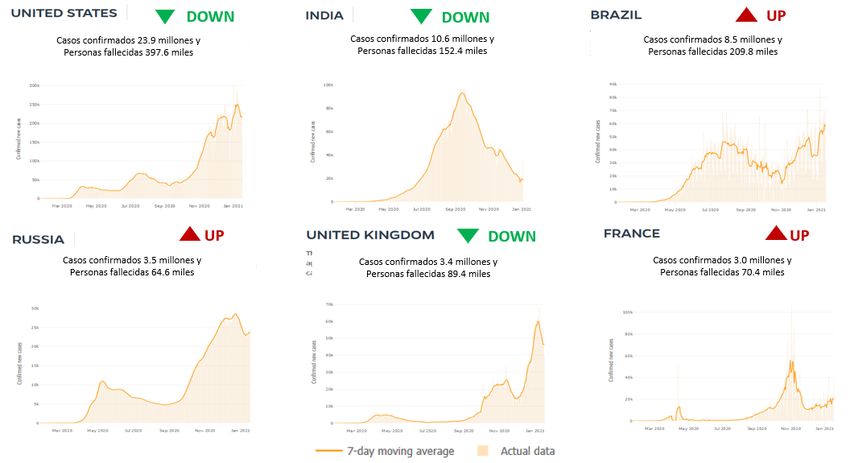
Central American Bank for Economic Integration
Office of the Chief Economist

Israel is one of the leading countries implementing the vaccination plan. 2.16 million Pfizer shots were
administered as of January 18, 2021, corresponding to almost 25% of its population; reports show a 50%
reduction in infections. Rapid vaccination was due to an agreement between the pharmaceutical company and
Israel. The country would give Pfizer access to several medical databases on people receiving the dose, thus
becoming a "laboratory."

The vaccine information provided by Johnson and Johnson's has raised expectations. Preliminary findings
indicate that a single injection generates more neutralizing antibodies than a single dose of other COVID-19
vaccines. While others depend on a two-dose regime.

The Norwegian Medicines Agency warned that vaccines against Covid-19 with mRNA technology could be fatal
for a population group. People over 80 years of age and terminally ill may be at risk of side effects (fever and
nausea) and fatal outcomes with the application of Covid-19 vaccines developed with mRNA technology. After
23 deaths of older people were registered shortly after receiving the vaccination.

The United Kingdom reported a variant strain of a more contagious COVID-19 virus, which has spread to at
least 33 countries worldwide. On December 14, 2020, U.K. authorities informed the World Health Organization
of a new variant strain of SARS-CoV-2. They also imposed containment measures at the end of December and
early January. Meanwhile, several countries worldwide reacted to this situation by imposing travel restrictions
to the United Kingdom. Preliminary analysis available of the strain indicates the following1:

    -   The presence of 14 mutations defines this.
    -   It can spread more easily among people as this variant is more contagious than the previous viruses in
        circulation and represents an estimated increase of 40% to 70% in transmissibility.

    -   Studies are underway to verify the efficacy of the approved vaccines to the variant strain. Preliminary
        results indicate that the Pfizer/BioNTech vaccine could be effective against the new variants in the United
        Kingdom and South Africa, according to a study conducted by scientists from Pfizer and the University of
        Texas Medical Branch (UTMB)2 of the United States.

    -   No significant differences in hospitalization or death rates were found. It does not cause a more severe
        illness or an increase in mortality3.

The pandemic is expected to end in the United States in the second half of 2021. The United States could reach
the pandemic's epidemiological end (herd immunity) in the third or fourth quarter of 2021. In this regard,
President-elect Joe Biden will implement a strategy that includes: i) expanding eligibility to vaccinate more

1
  Organización Mundial de la Salud. (21 de diciembre 2020). Cepa variante del SARS-CoV-2 – Reino Unido.
  https://www.who.int/csr/don/21-december-2020-sars-cov2-variant-united-kingdom/es/.
2 Pfizer Inc. (January 8, 2021). An In Vitro Study Shows Pfizer-BioNTech COVID-19 Vaccine Elicits Antibodies that Neutralize SARS-CoV-2

  with a Mutation Associated with Rapid Transmission. https://www.pfizer.com/news/press-release/press-release-detail/vitro-study-
  shows-pfizer-biontech-covid-19-vaccine-elicits.
3 Science Alert. (1 January 2021). New Coronavirus Variant Now in US And UK Doesn't Cause More Severe Illness.

  https://www.sciencealert.com/new-coronavirus-variant-now-in-us-and-uk-doesn-t-cause-more-severe-illness-says-study.

                                                                                                                                      7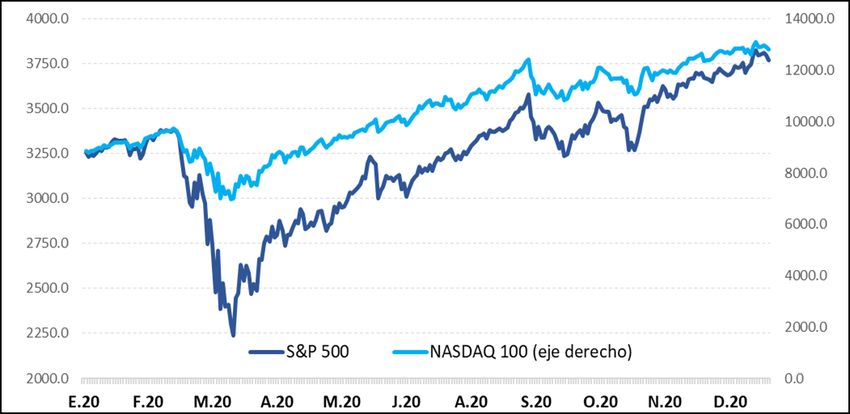
Central American Bank for Economic Integration
Office of the Chief Economist

people; ii) creating more vaccination sites; iii) increasing the supply and distribution of vaccines; iv) mobilizing
more staff to support the vaccination effort; and v) launching a campaign of public education aimed at those
who hesitate to get vaccinated. The main goal is to ensure equitable access to the vaccine throughout the
country.

However, important questions remain concerning vaccines, such as long-term safety, timely and effective
distribution, and public acceptance. The main factors that will determine when herd immunity is reached are4:

       -    The approval of the vaccine for use in minors.
       -    Information on reducing disease transmission from inoculated persons.
       -    The determination of the seroprevalence (percentage of the population that has developed antibodies
            against COVID-19), given that some geographical areas of the country would be closer to collective
            immunity than others.
       -    The result of the studies on how long the immunity would last.
       -    The problems of manufacture and supply that, although clear, have yet to be overcome.

In other countries, the epidemiological end of COVID-19 could be achieved after 2021, as vaccines will not be
available in the quantities required in the coming months. There are bleak prospects that Latin America and
the Caribbean and Central America will have mass access to the vaccine by 2021. According to The Economist
Intelligence Unit, the South American largest economies will obtain massive access to the COVID-19 vaccine and
the rest of LAC in 2022. The worst-case scenario could extend to 2023 in some Central American and Caribbean
countries due to restrictions on vaccine production and distribution. Also, access to the vaccine will be difficult,
as developed countries rush to acquire enough quantities and poorer countries struggle to secure funding. As a
result, vaccination in middle-income and developing countries will take longer, and large-scale inoculation is not
expected to occur before 2022.

4   McKinsey Company. (23 November 2020). When will the COVID-19 pandemic end? https://www.mckinsey.com/industries/healthcare-
    systems-and-services/our-insights/when-will-the-covid-19-pandemic-end.

                                                                                                                            8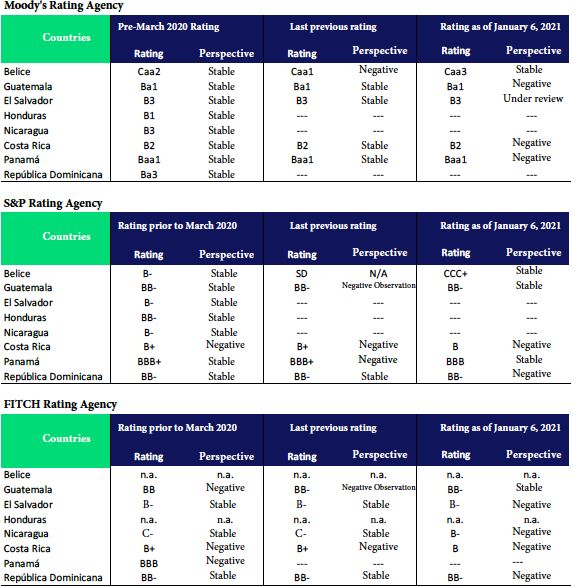
Central American Bank for Economic Integration
Office of the Chief Economist

Figure 3. Estimated dates of mass access to COVID-19 vaccines in the world

Source: The Economist Intelligence Unit. (December 18, 2020). Rich countries will get access to coronavirus vaccines earlier than others.
https://www.eiu.com/n/rich-countries-will-get-access-to-coronavirus-vaccines-earlier-than-others/

WHO experts warn that COVID-19 will not disappear with the vaccine. The most likely scenario is that the
pathogen causing COVID-19 disease will become another endemic virus and pose a very low level of threat in
the context of a global vaccination program.

                                                                                                                                       9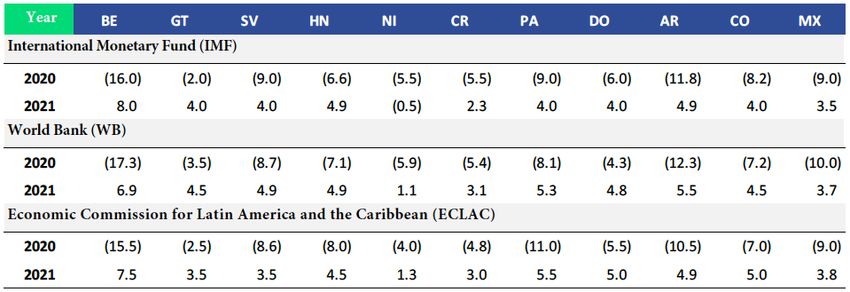
Central American Bank for Economic Integration
Office of the Chief Economist

II. WORLD ECONOMY PRESENTS POSITIVE ECONOMIC PROSPECTS FOR 2021

World economic output is expected to rebound in 2021. According to the International Monetary Fund (IMF)
latest estimates, the world's economy will start to recover in 2021, and positive expectations are due to the
approval of at least eight COVID-19 vaccines. This will allow shortening the estimated period to achieve collective
immunity in most developed countries. However, it is essential to note that about 70% of the world's countries
would not reach their pre-crisis GDP levels by 2021 and will not recover from the GDP decline observed in 2020.
China would be the only large economy that will register economic growth in 2020, with 2.3%, a figure that
includes the growth of 6.5% in the last quarter of 2020.

Graph 3. International Monetary Fund forecasts of economic growth in 2020 and 2021 (percentages)

Source: Office of the Chief Economist with information from the International Monetary Fund, World Economic Outlook Database, April,
June and October 2020 https://www.imf.org/en/Publications/WEO

Graph 4. Proportion of countries in the world and LAC that recover pre-crisis GDP in each year (percentages)

Note: According to the availability of information, the world contains 192 countries and Latin America and the Caribbean 32.
Source: Office of the Chief Economist with information from the International Monetary Fund, World Economic Outlook Database,
October 2020. https://www.imf.org/en/Publications/WEO/weo-database/2020/October.

                                                                                                                                 10
Central American Bank for Economic Integration
Office of the Chief Economist
Tourism was one of the most affected activities during 2020 due to travel restrictions imposed in most
countries worldwide. International arrivals worldwide fell -72% in the first ten months of 2020, the worst year
ever recorded so far. According to the most recent data from the World Tourism Organization (WTO),
destinations received 900 million fewer international tourists between January and October, compared to the
same period in 2019, amounting to losses of $935 billion, a figure ten times greater than during 2008- 2009
financial crisis. The WTO predicts that tourist arrivals could fall between -70% and -75% by December 2020,
which would mean a decline in world tourism to 1990 levels, with one billion fewer arrivals and an approximate
loss of USD 1.1 billion in revenue5.
Graph 5. Number of cumulative arrivals as of October and per month by geographical area (year-on-year variation,
percentages)
Source: Office of the Chief Economist with information from the World Tourism Organization.
World merchandise trade continued to show signs of recovery during the third quarter of 2020, although at
the countries level mixed results were achieved in October 2020. Merchandise exports decreased -4.0% year-
on-year in the third quarter of 2020, which represented an improvement over the -21% drop recorded in the
previous quarter. Recovery was associated with the easing of mobility measures in the world's major economies.
However, since October, second and third waves of COVID-19 were experienced worldwide, which generated
mixed results in exports performance. Meanwhile, China and Japan registered year-on-year growth of 11.0%
and 3.0%, respectively, the Republic of Korea and the European Union fell back by -4.0%6.
5
World Tourism Organization. (December 17th, 2020). Tourism falls back to 1990 levels with a drop in arrivals of more
than 70%. https://www.unwto.org/es/news/el-turismo-retrocede-a-niveles-de-1990-con-una-caida-en-llegadas-del-mas-
del-70.
6
World Trade Organization. (December 4th, 2020). Latest data on trade developments.
https://www.wto.org/spanish/res_s/statis_s/latest_trends_s.htm
11Central American Bank for Economic Integration
Office of the Chief Economist
The United States showed signs of slower economic recovery by the end of 2020. The weekly economic index7
registered a drop of -1.70% in the week that ended on January 9, 2021. Likewise, the 13-week moving average
variation of this index registered -2.54%, linking the last 28 weeks with records of minor falls, which would
reaffirm the upward trend of economic activity in this country.
Graph 6. Weekly economic index of the United States (weekly variation, percentages).
Source: Lewis, Daniel J., Mertens, Karel, and Stock, James H., Weekly Economic Index, January 18, 2021.
https://www.newyorkfed.org/research/policy/weekly-economic-index.
Meanwhile, other economic indicators show mixed evidence of slower recovery of the U.S. economy in 2020
last months, the following stand out:
- The total unemployment rate remained constant and that of Latinos rose slightly as of December 2020,
after both rates fell for seven consecutive months until November 2020.
- The industrial production rate rose marginally in November 2020, maintaining a relatively stable
performance in recent months.
- New orders for durable goods and capital goods remain on the rise and have linked the last seven months
to higher values until November 2020, which is related to the sustained upturn in international trade.
7
The Weekly Economic Index (WEI) is an index of ten daily and weekly indicators of real economic activity, scaled to align
with the four-quarter GDP growth rate. It represents the common component of a series covering consumer, labor
market and production behavior.
12Central American Bank for Economic Integration
Office of the Chief Economist
- Finally, the business confidence index has risen successively in the last six months, and the consumer
confidence index fell in November and has remained relatively constant in the last four months, around a
value of 99.0.
Graph 7. USA: Total and Latino unemployment (percent). Graph 8. USA and Euro Zone: Industrial Production Index.
Graph 9. USA: New orders for durable and capital goods (USD Graph 10. USA: Business and Consumer Confidence Indices
billions)
Source: Office of the Chief Economist with information from the U.S. Bureau Labor of Statistics; Federal Reserve Bank of St. Louis and
the Organization for Economic Co-operation and Development.
Under this scenario, the United States maintains an accommodative monetary policy and its policy rate
between 0.0% and 0.25%. The Federal Reserve has maintained this rate since March 15, 2020, as a
countercyclical measure. Meanwhile, year-on-year inflation was 1.16% in November, falling for the second
month in a row, reflecting the slowdown in aggregate demand due to the acceleration of COVID-19 infections
and the reestablishment of mobility restrictions.
13Central American Bank for Economic Integration
Office of the Chief Economist
The United States' political situation poses essential considerations for the Biden Administration, which seeks
to break with the structural patterns that characterized the domestic and foreign policies of President Donald
Trump. Americans are waiting for changes to be made by the new president, whose inauguration ceremony was
held on January 20, amid one of the most controversial social and political contexts of recent decades. President
Trump's allegations about the transparency of the election process and its results fueled social unrest that led
to the Capitol building's storming on January 6, 2021, with President Trump first acknowledging his defeat at the
polls the next day through a video posted on his Twitter account. Following this event, the Federal Bureau of
Investigation is on the trail of those responsible for bringing them to justice. At the same time, President Trump
could face a second impeachment process by being singled out as the instigator. After the riots, the financial
markets remained calm and confident in the political institutions after the Republican recognition of the election
results. Faced with this scenario, the Biden Administration must seek a balance between strategic dialogue to
promote national unity and measures to reestablish democratic order, without this implying a deepening of the
fractures in U.S. society.
On the other hand, in Argentina, Colombia and Mexico, monetary policy rates remained stable in December,
with lower inflation recorded in November 2020. Policy rates in Colombia and Mexico have remained at the
lowest levels of the year, 1.75% and 4.25%, respectively, while Argentina kept its rate at 38.00%. In the case of
Argentina, the rate was reduced on March 10; in Colombia, the most recent monetary policy decision was on
September 28, cutting the rate by a quarter of a percentage point; and in Mexico, the last movement of the
target rate was on September 25, cutting 25 basis points. On the other hand, Colombia registered lower inter-
annual inflation in November of 1.49%, remaining below its inflation target of 3.00%. In Mexico, year-on-year
inflation also fell in the same month, to 3.33%, very close to its 3.00% inflation target. Finally, in Argentina,
inflation was 35.8% in November, the lowest since August 2018.
The stock markets reached historic highs in the last month of 2020. The major stock market indices, S&P500
and NASDAQ100, traded higher during December 2020. The economic recovery expected in 2021 explains much
of the upward potential of the stock. The start of the COVID-19 vaccination campaign, the Federal Reserve's
accommodative monetary policy and the government's fiscal stimulus will continue to drive the revival of activity
by creating a more benign environment for corporate earnings growth. However, there is a risk of a temporary
correction in the stock market in the short term due to the surge in COVID-19 cases in the United States8.
8
Daily FX. Bullish year on the stock market: The S&P 500 soars 16% while the Dow Jones increases 7%. (December 30th,
2020). https://www.dailyfx.com/espanol/analisis_del_mercado/analisis_diario/2020/12/30/Ano-alcista-en-la-bolsa-el-
SP-500-se-dispara-un-16-mientras-que-el-Dow-Jones-trepa-un-7.html.
14Central American Bank for Economic Integration
Office of the Chief Economist
Graph 11. Selected stock market indexes.
Source: Office of the Chief Economist with information from the Federal Reserve Bank of St. Louis
International prices of the main commodities continue to show mixed behavior. The oil price rose 14.5% in
December to USD 47.5 a barrel, although at the end of the year, it was far below the December 2019 price of
USD 59.8. On January 5, 2021, OPEC, Russia and other major producers agreed to adjust quotas so that a
reduction by Saudi Arabia would lead to modest increases in the shares of Russia and Kazakhstan. With this
news, Brent exceeded USD 53 per barrel, while WTI exceeded USD 50 per barrel. On the other hand, the price
of gold remains at high levels, with an average annual return of around 25.6% as of December 2020.
Graph 12. WTI oil price and Gold (USD per barrel; USD troy ounce).
70 2200
60 2000
1858.4
50 1800
47.1
40 1600
30 1400
20 1200
Petroleo WTI Oro (eje derecho)
10 1000
Jan-19
Feb-19
Mar-19
Apr-19
Jun-19
Jul-19
Aug-19
Sep-19
Oct-19
Dec-19
Jan-20
Feb-20
Mar-20
Apr-20
Jun-20
Jul-20
Aug-20
Sep-20
Oct-20
Dec-20
May-19
Nov-19
May-20
Nov-20
Source: Office of the Chief Economist with information from COMMODITIES MARKETS, World Bank
https://www.worldbank.org/en/research/commodity-markets
15Central American Bank for Economic Integration
Office of the Chief Economist
The coffee price registered a monthly variation of 4.2% in December 2020, which allowed it to reach the same
level of 2019; the banana price rose to November and registered a 0.4% change to December 2019. Finally, sugar
and palm oil closed higher in 2020, while beef and shrimp registered double-digit declines.
Table 1. International prices of main Central American export goods.
Price Variation
Product Unit of
Measurment December 2020 Monthly Interanual
Arabica coffee USD/kg 3.5 4.2 0.0
Banana USD/kg 1.2 1.8 0.4
Beef USD/kg 4.4 0.1 -20.9
Palm oil USD/MT1 978.6 6.6 27.1
Shrimp USD/kg 11.7 1.3 -16.2
Sugar USD/kg 0.6 -3.1 9.3
Note: 1/M.T. is a metric ton.
Source: Office of the Chief Economist with information from COMMODITIES MARKETS, World Bank
https://www.worldbank.org/en/research/commodity-markets
16Central American Bank for Economic Integration
Office of the Chief Economist
III. CENTRAL AMERICA PRESERVES MOMENTUM WHILE FISCAL CHALLENGES PERSIST
Latin America and the Caribbean is the region hardest hit in the developing world by the COVID-19 crisis.
According to the last Economic Commission for Latin America and the Caribbean (ECLAC) report, the region faced
the worst economic crisis in the last 120 years during 2020. However, positive economic output is expected in
2021, yet pre-crisis GDP level will only be achieved by 2024. Prevailing uncertainty anticipates a possible
downward correction of the 2021 forecast, linked to the risks of the pandemic's resurgence, the agility to
produce and distribute vaccines and the capacity to maintain fiscal and monetary stimuli to support aggregate
demand and the productive sector.
According to recent forecasts by the leading international organizations in Central America, Guatemala would
be the only country that would reach pre-crisis GDP level by 2021. The World Bank also predicts that the
Dominican Republic would also be returning to pre-crisis GDP levels in 2021.
Table 2. Forecasts of economic growth in Central America (percentages).
Source: International Monetary Fund, World Economic Outlook Database, October 2020. https://www.imf.org/en/Publications/WEO/weo-
database/2020/October. The World Bank. Semiannual Report of the Latin America and the Caribbean Region: The Cost of Staying Healthy,
October 2020. https://www.worldbank.org/en/region/lac/publication/el-costo-de-mantenerse-sano. Economic Commission for Latin
America and the Caribbean Preliminary Overview of the Economies of Latin America and the Caribbean 2020. December 2020.
https://www.cepal.org/es/publicaciones/46501-balance-preliminar-economias-america-latina-caribe-2020.
The region's economic recovery was consolidated in the last months of 2020. The monthly index of economic
activity (IMAE by its Spanish acronym) shows a trend towards economic recovery for all countries, with smaller
falls in economic activity each month or, in Guatemala's case, the first positive numbers since the beginning of
the crisis. In this regard, Guatemala registered an interannual variation of the IMAE of 1.1% as of October 2020,
Honduras -4.2%, the Dominican Republic -5.8% and Costa Rica -6.6%. Nicaragua, El Salvador and Panamá
registered -0.4%, -7.0% and -29.9% to September 2020, respectively. The strongest contractions have been
observed by economic activity, especially in hotels and restaurants, transportation, construction, mining and
quarrying, commerce, and electrical energy. In the manufacturing industry's specific case, the evidence is mixed,
falling in Guatemala, El Salvador and Costa Rica, while it rises in Honduras and Nicaragua.
17Central American Bank for Economic Integration
Office of the Chief Economist
Graph 13. Year-on-year variation of IMAE in Central American countries (cycle trend, percentages)
10.0 10.0 5.0
1.1
0.0 0.0 -0.3 -0.3 -0.4
-5.0 -2.5
-4.5 -4.2
-10.0 -10.0 -6.4 -7.0 -7.3 -7.0 -6.8 -6.4 -6.6 -5.8
-9.5
-15.0
-20.0 -20.0
-30.0 -30.0
-25.0
GTM SLV HND NIC GTM SLV HND
CRI PAN DOM NIC CRI PAN
-40.0 -40.0
-30.1 -29.9 DOM
Jan-19
Jul-19
Nov-19
Jan-20
Jul-20
Aug-19
Jun-19
Oct-19
Aug-20
Jun-20
Oct-20
Mar-19
Mar-20
May-20
May-19
Feb-19
Sep-19
Feb-20
Sep-20
Dec-19
Apr-19
Apr-20
-35.0
Aug-20 Sep-20 Oct-20
Source: Office of the Chief Economist with SECMCA information. http://www.secmca.org/secmcadatos/
Unemployment rates in 2020 are still higher than in 2019 but continue falling. In Costa Rica the unemployment
rate was 21.9% (the expanded9 unemployment rate was 23.5%) in the moving quarter ending in October 2020,
9.7 percentage points higher than the previous year. According to the classification by gender, it was estimated
that unemployment for the male population was 16.5% and for the female population 30.0%10. On the other
hand, the variation in the number of contributors to social security (last month available in each country divided
by the value of February), fell in the Dominican Republic -12.9%.11 and Costa Rica -3.7%12 in November; in el
Salvador -5.2% as of October 13 and in Guatemala -3.8% in September14. In most countries, there was a smaller
drop than in the last two or three months, except for the Dominican Republic which showed a slight increase.
Recent decisions by monetary authorities keep interest rates low and constant in all countries. Central banks
in the region kept policy rates unchanged in January. On the other hand, year-on-year inflation in the Dominican
Republic (5.55%) was above the inflation target range in December for the fourth consecutive month.
Meanwhile, Guatemala (4.82%) and Honduras (4.01%) remained within the target range of tolerance. Costa Rica
below the lower limit with 0.89%, Nicaragua registered low inflation 2.93% and El Salvador observed negative
year-on-year inflation for the seventeenth consecutive month.
9
Percentage that includes the unemployed population in conjunction with the discouraged population outside the available labor force
relative to the expanded labor force (incorporates into the labor force the discouraged population outside the available labor force).
10
National Institute of Statistics and Census of Costa Rica. Continuous Employment Survey, rolling quarter June-July-August 2020.
October 2020. https://www.inec.cr/encuestas/encuesta-continua-de-empleo.
11 Superintendence of Pensions of the Dominican Republic.
12 Costa Rican Social Security Fund.
13 Salvadoran Institute of Social Security. September Situation Report.
https://www.transparencia.gob.sv/institutions/isss/documents/estadisticas.
14 Ministry of Economy of Guatemala. Weekly Economic Report. September 30, 2020.
https://www.mineco.gob.gt/dae-an%C3%A1lisis-macroecon%C3%B3mico.
18Central American Bank for Economic Integration
Office of the Chief Economist
Graph 14. Central bank MPRs (percentages). Graph 15. Year-on-year inflation (percentages).
8
8
GTM HND NIC CRI DOM 6
5.55
6 4.82
4 4.01
2.93
4 4.00 2
0.89
3.00 0 -0.09
2
1.75
-2
-2.25
0.75
0 -4
GTM SLV HND NIC CRI PAN DOM
Oct-18
Oct-19
Oct-20
Jun-18
Jun-19
Jun-20
Jul-18
Jul-19
Jul-20
Jan-18
Feb-18
Sep-18
Sep-19
Aug-18
Nov-18
Jan-19
Feb-19
Aug-19
Nov-19
Jan-20
Feb-20
Aug-20
Sep-20
Nov-20
Jan-21
Mar-18
Mar-19
Mar-20
May-18
Dec-18
May-19
Dec-19
May-20
Dec-20
Apr-18
Apr-19
Apr-20
Jan-18
Nov-18
Jan-19
Nov-20
Jun-18
Jul-18
Oct-18
Jun-19
Jul-19
Nov-19
Jan-20
Oct-19
Jun-20
Jul-20
Oct-20
Dic-20
Feb-18
Aug-18
Sep-18
Feb-19
Aug-19
Sep-19
Feb-20
Aug-20
Sep-20
Mar-18
Mar-19
May-19
Mar-20
May-18
May-20
Dec-18
Dec-19
Apr-18
Apr-19
Apr-20
Source: Office of the Chief Economist with SECMCA information. http://www.secmca.org/secmcadatos/
Exports registered a greater dynamism in the last months of 2020. Most countries experienced a change in
trend, which is associated with the greater dynamism of international trade. However, according to the latest
information available, exports are still below the previous year levels, with Panama -23.3% as of August, the
Dominican Republic -9.0% as of September and El Salvador -18.8% as of October being the most affected.
Meanwhile, monthly exports are registering their first growth since the pandemic began in the region, in El
Salvador and Costa Rica in September and October, and in Guatemala, Honduras and the Dominican Republic in
September.
Graph 16. Cumulative exports Graph 17. Monthly exports
(year-on-year variation, percentage). (year-on-year variation, percentages).
20 20 14.1
GTM SLV HND
6.1
10
CRI PAN DOM 2.3 4.53.2
0
0 0.3 -0.3
-0.3 -20
-10 -9.0
-40
-20 -18.8
-23.3
-60
-30
GTM SLV HND CRI PAN DOM
-40 -80
Jan-20 Feb-20 Mar-20 Apr-20 May-20 Jun-20 Jul-20 Aug-20 Sep-20 Oct-20 Jan-20 Feb-20 Mar-20 Apr-20 May-20 Jun-20 Jul-20 Aug-20 Sep-20 Oct-20
Source: Office of the Chief Economist with SECMCA information. http://www.secmca.org/secmcadatos/
19Central American Bank for Economic Integration
Office of the Chief Economist
Imports show less dynamism, indicating a heterogeneous recovery among different sectors. Imports in most
countries show no signs of recovery, perhaps associated with lower demand for inputs from non-trade-related
economic activities and final demand that has yet to rise. In short, imports have fallen by a greater magnitude
than exports, which is reflected in the smaller trade deficits achieved in all region countries compared to the
same period last year. This could be linked to a lower rate of public and private investment, which could slow
the prospects for economic growth in 2021.
Graph 18. Accumulated imports Graph 19. Monthly imports
(year-on-year variation, percentage). (year-on-year variation, percentage).
20 20
GTM SLV HND
CRI PAN DOM
10
0
0 -5.3 -7.6-7.1
-10.8
-20 -14.3
-10 -9.1
-11.2
-17.1 -15.7 -40
-20 -19.8
-60
-30
-35.0 GTM SLV HND CRI PAN DOM
-40 -80
Jan-20 Feb-20 Mar-20 Apr-20 May-20 Jun-20 Jul-20 Aug-20 Sep-20 Oct-20 Jan-20 Feb-20 Mar-20 Apr-20 May-20 Jun-20 Jul-20 Aug-20 Sep-20 Oct-20
Source: Office of the Chief Economist with SECMCA information. http://www.secmca.org/secmcadatos/
Graph 20. Cumulative trade balance (millions of dollars)
Source: Office of the Chief Economist with SECMCA information. http://www.secmca.org/secmcadatos/
20Central American Bank for Economic Integration
Office of the Chief Economist
Remittances showed resilience during the crisis and were the first external variable to react positively.
According to the latest information available, accumulated remittances in Guatemala, El Salvador, Honduras,
Nicaragua and the Dominican Republic show positive year-on-year variations. In the case of the Dominican
Republic it is the fifth month with positive data, Guatemala reports four months, El Salvador two months, in
Honduras October was the first month, and in the case of Nicaragua this variable slowed down in 2020 but never
registered a negative variation. Given the above, in these countries accumulated remittances are above 2019
levels.
Graph 21. Accumulated Remittances Graph 22. Accumulated Remittances
(year-on-year variation, percentages). (millions of dollars).
25
7500 7500 7500
20
5000 5000 5000
15
13.0 2500 2500 2500
10
9.4 0 0 0
5 5.1 Oct-19 Oct-20 Oct-19 Oct-20 Oct-19 Oct-20
2.6 GTM 8,747.60 9,193.30 SLV 4,639.80 4,759.70 HND 4,563.30 4,609.10
0 1.0
-5
7500 7500
-10 5000
5000
-15 2500 2500
Nov-19
Mar-19
Mar-20
Jan-19
Jan-20
Aug-19
Aug-20
Apr-19
Apr-20
Dec-19
May-19
Oct-19
May-20
Oct-20
Feb-19
Jun-19
Sep-19
Feb-20
Jun-20
Sep-20
Jul-19
Jul-20
0 0
Sep-19 Sep-20 Oct-19 Oct-20
GTM SLV HND NIC DOM NIC 1,227.40 1,342.70 DOM 5,873.20 6,639.40
Source: Office of the Chief Economist with SECMCA information. http://www.secmca.org/secmcadatos/
The economic crisis continues to affect fiscal accounts and remain one of the region's greatest challenges for
2021. Central government total income has fallen in all countries, however, in El Salvador the trend has reversed
since June, while the Dominican Republic has manages smaller losses since July. This, combined with increased
spending in most countries, generates a larger fiscal deficit, financed by budget reallocation and new debt, the
latter of which has increased by 15 to 20 percentage points in 5 of the 7 countries in the region.
Graph 23. Central government: accumulated income Graph 24. Central government: accumulated expenses
(year-on-year variation, percentages). (year-on-year variation, percentages).
40 40
33.9
30 30 26.6
GTM SLV HND NIC CRI PAN DOM
20 20
14.7 13.0
10 10
Oct-20 Oct-20 Ago-20 Ago-20 Oct-20 Sep-20 Sep-20 0.1 Sep-20
0 0
(4.9) (2.3) (1.8) (3.3)
-10 (6.2) -10
Oct-20 Oct-20 Ago-20 Ago-20 Oct-20 Sep-20
(11.8) (11.3)
-20 -20
(19.7)
-30 -30
(26.9)
GTM SLV HND NIC CRI PAN DOM
-40 -40
Source: Office of the Chief Economist with SECMCA information. http://www.secmca.org/secmcadatos/
21Central American Bank for Economic Integration
Office of the Chief Economist
Graph 25. Central government: total debt Graph 26. Central government: total debt structure (year-
on-year variation, percentages). (percentages).
GTM SLV HND NIC
GTM SLV HND NIC CRI PAN DOM
13%
20.2 20.1
19.1 34%
43% 41%
57% 59%
66% 87%
15.2 15.3
CRI PAN DOM CA
19%
7.0 23% 30%
44%
56%
3.4 81% 70%
77%
Oct-20 Oct-20 Sep-20 Jun-20 Oct-20 Oct-20 Sep-20 Deuda externa
Note: The debt structure in Graph 26 refers to the last available month detailed in Graph 25.
Source: Office of the Chief Economist with SECMCA information http://www.secmca.org/secmcadatos/
Central bank international reserves increased in all countries. The smaller trade deficit, the growing flows of
remittances and the higher external public debt have contributed to a more significant accumulation of foreign
currency in the economy and eventually higher net international reserves. These remain at an adequate level
with respect to import coverage, a variable that should be taken with caution given the sharp drop in imports
observed in 2020.
Graph 27. Net International Reserves (NIR) Graph 28. NIR coverage on imports
(millions of dollars). (number of months of import).
20,000
GTM SLV HND NIC 18,314.8 GTM SLV HND NIC CRI PAN DOM
CRI PAN DOM 12.1
16,000
10.9
12,000
10,046.510,751.7 7.8
6.3 6.5
8,000 7,809.2
7,760.4
4.3
3.6
4,000 3,689.9
2,781.0
0
May-19
Jul-19
Apr-19
Nov-19
Apr-20
May-20
Jul-20
Nov-20
Mar-19
Mar-20
Oct-19
Aug-19
Aug-20
Oct-20
Dec-19
Jun-20
Jun-19
Feb-19
Sep-19
Feb-20
Sep-20
Jan-19
Jan-20
Sep-20 Oct-20 Sep-20 Abr-19 Ago-20 Ago-20 Sep-20
Source: Office of the Chief Economist with SECMCA information http://www.secmca.org/secmcadatos/
Sovereign debt ratings were downgraded for most Central American countries during 2020 due to
deteriorating fiscal accounts. Moody's downgraded debt rating or outlook for the five Central American
countries was assessed from March 2020 to January 6, 2021. Three countries were not assessed during this
period. In the rating agency S&P the results were similar; from the five countries evaluated to four, it lowered
the rating or perspective, maintained the rating and perspective to Guatemala, and three countries were not
evaluated. Finally, of the six countries evaluated by Fitch, five received a rating or perspective reduction, and
one was not evaluated in this period. The details of the risk ratings for each country are attached in Annex 1.
22Central American Bank for Economic Integration
Office of the Chief Economist
ANNEX 1. FOREIGN CURRENCY LONG-TERM SOVEREIGN DEBT RATING
Source: Trading Economics. https://tradingeconomics.com/guatemala/rating.
23Central American Bank for Economic Integration
Office of the Chief Economist
REFERENCES
Board of Governors of the Federal Reserve System. (2021, Enero). Open Market Operations. Retrieved from
https://www.federalreserve.gov/monetarypolicy/openmarket.htm.
Costa Rican Social Security Fund. (2021). Retrieved from https://www.ccss.sa.cr/est_epts
Economic Commission for Latin America and the Caribbean. (2020, December). Preliminary Overview of the
Economies of Latin America and the Caribbean 2020. Santiago, Chile. Retrieved from
https://www.cepal.org/es/publicaciones/46501-balance-preliminar-economias-america-latina-caribe-
2020.
COVID-19 Vaccine Tracker. (2021, January). Retrieved from https://covid19.trackvaccines.org/vaccines/
European Centre for Disease Prevention and Control. (2021, January). Retrieved from Weekly COVID-19 country
overview.: https://qap.ecdc.europa.eu/public/extensions/COVID-19/COVID-19.html#global-overview-
tab.
Federal Reserve Bank of St. Louis. (2021, January 5). Retrieved from
https://fred.stlouisfed.org/series/NASDAQ100. https://fred.stlouisfed.org/series/SP500
IMF. (2000). World Economic Outlook Database. Retrieved from https://www.imf.org/en/Publications/WEO
National Institute of Statistics and Census of Costa Rica. (2021, Enero). Continuous Employment Survey, rolling
quarter August-September-October 2020. Retrieved from https://www.inec.cr/encuestas/encuesta-
continua-de-empleo.
Salvadoran Institute of Social Security. (2021, Enero). Retrieved from ISeptember Situation Report:
https://www.transparencia.gob.sv/institutions/isss/documents/estadisticas.
Johns Hopkins University, Coronavirus Resource Center. (2021, January). Retrieved from
https://coronavirus.jhu.edu/data/new-cases
Lewis, D. J. (2021, January 5). Weekly Economic Index. New York, United States. Retrieved from
https://www.newyorkfed.org/research/policy/weekly-economic-index.
Ministry of Economy of Guatemala. (2021, Enero). Weekly Economic Report. Retrieved from Weekly Economic
Report: https://www.mineco.gob.gt/dae-an%C3%A1lisis-macroecon%C3%B3mico
World Tourism Organization. (2020). Tourism falls back to 1990 levels with a drop in arrivals of more than 70%.
Retrieved from https://www.unwto.org/es/news/el-turismo-retrocede-a-niveles-de-1990-con-una-
caida-en-llegadas-del-mas-del-70.
Our World in Data. (2021, January). Coronavirus COVID-19 cases. Retrieved from
https://ourworldindata.org/coronavirus
Pfizer Inc. (2021, January 8). An In Vitro Study Shows Pfizer-BioNTech COVID-19 Vaccine Elicits Antibodies that
Neutralize SARS-CoV-2 with a Mutation Associated with Rapid Transmission. Retrieved from
https://www.pfizer.com/news/press-release/press-release-detail/vitro
24Central American Bank for Economic Integration
Office of the Chief Economist
Executive Secretariat of the Central American Monetary Council. (2021, Enero). SECMCADATOS. Retrieved
from http://www.secmca.org/simafir.html
SIPEN. (2021, Enero). Superintendence of Pensions. Retrieved from
https://www.sipen.gob.do/index.php/estadisticas/estadistica-previsional
The Economist Intelligence Unit. (2020, December 18). Rich countries will get access to coronavirus vaccines
earlier than others. Retrieved from https://www.eiu.com/n/rich-countries-will-get-access-to-
coronavirus-vaccines-earlier-than-others/
The World Bank. (2020, October). Semiannual Report of the Latin America and the Caribbean Region: The Cost
of Staying Healthy. Retrieved from https://www.worldbank.org/en/region/lac/publication/el-costo-de-
mantenerse-sano.
The World Bank. (2021, January). COMMODITIES MARKETS. Retrieved from
https://www.worldbank.org/en/research/commodity-markets
Trading Economics. (2021, January 6). Retrieved from https://tradingeconomics.com/dominican-
republic/rating
U.S. Bureau of Labor Statistics. (2021, January). Labor Force Statistics from the Current Population Survey.
Retrieved from https://data.bls.gov/timeseries/lns14000000.
https://data.bls.gov/timeseries/LNS14000009.
University of Oxford. (2021, January). Coronarivus Government Response Tracker. Retrieved from
https://www.bsg.ox.ac.uk/research/research-projects/coronavirus-government-response-tracker
Worldometer COVID-19 Coronavirus Pandemic. (2021, January). Retrieved from
https://www.worldometers.info/coronavirus/#countries
25You can also read