NIWA Group Half Year Report - G.41
←
→
Page content transcription
If your browser does not render page correctly, please read the page content below
G.41

                  NIWA
  Group Half Year Report
For the period ended 31 December 2020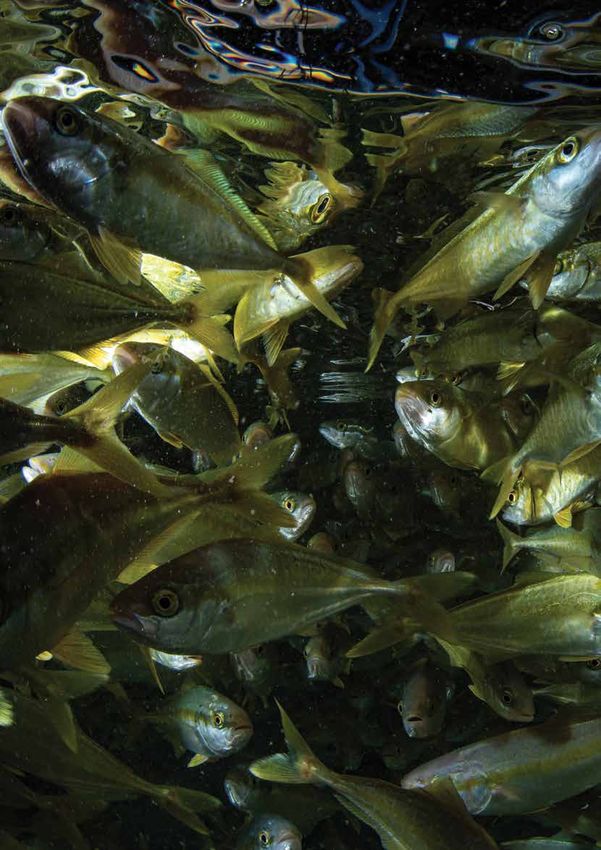
Half Yearly Report
for the six months ended 31 December 2020

Overview
NIWA has had a strong start to the financial year, and at the half year stage is well ahead of budgeted revenue
and profit. This position is largely due to projects carried over from the last financial year due to COVID-19
delays and additional work for the RV Tangaroa. Costs to date are close to budget.

All the science and support performance indicators outlined in the 2020/2021 Statement of Corporate Intent
are on track. Progress has been made on advancing NIWA’s Future Property Programme, the design of a
replacement vessel for RV Kaharoa and a commercial-scale recirculating aquaculture system for the culture of
high-value finfish, partnerships with Māori and the establishment of a leadership development and succession
programme to grow NIWA’s future leaders.

A number of significant science advances were achieved over the past six months, as outlined in this report.
These include the extension of the Aotearoa New Zealand tsunami dart buoy network, new environmental
forecasting services to predict climate and weather-related hazards, impacts and risks across New Zealand, co-
developed plans with iwi for the restoration of taonga species, and growing the market value of cultured kingfish.

With the Government announcement on 11 August 2020 of elevated national Alert Levels in response to
community transmission of COVID-19, NIWA moved quickly and effortlessly to operating remotely in Auckland
under Level 3 and reinstated NIWA Level 2 protocols and processes across all other regional sites. Overall,
NIWA’s operations moved seamlessly between Alert Levels, and work productivity levels were maintained.

Financial Results
NIWA achieved revenue of $86.0M in the first six months (including COVID-19 Response and Recovery Funding
of $8.3M). This result was $9.2M above budget and $17.1M above the same period last year. This position
reflects the significant number of projects carried over from FY20 due to delays caused by the COVID-19
lockdown. In addition, NIWA’s largest ocean-going research vessel, RV Tangaroa, has been at sea 18 days more
than budgeted.

Total expenditure of $72.8M was approximately equal to budget, notwithstanding the higher revenue, resulting
in a profit before tax result of $13.2M, compared with a budgeted profit before interest and tax of $4.1M. Profit
after tax for the year to date was $9.6M, compared with a budget of $3.0M.

The closing cash balance and short-term investment balance of $61.4M was $10.8M above budget as cash
continues to be carefully managed to ensure that NIWA’s planned strategic investments are not put at risk. The
cash balance has increased by $9.2M during the first half of the year due to operating cash flows from profit and
working capital management being higher than capital spending.

Capital spending for the period was $10.3M against a budget of $11.6M. The variance was due to differences
compared to budget assumptions in the timing of investment spending during the year.

                                                                                                   1|Page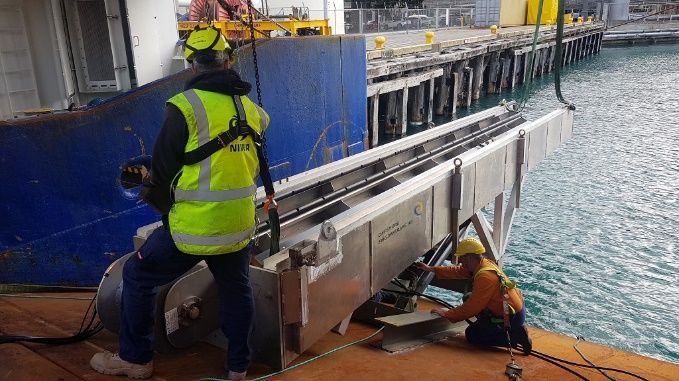
While NIWA is in a stable position for the year, this position partly reflects the unusually large volume of work
brought forward from the prior year. NIWA continues to experience significant headwinds in the market for
commercial work as funding for our key public sector customers remains constrained in a difficult economic
environment. This will be an area of focus for NIWA’s management and Board over the coming year so as to
mitigate risks to revenue in FY22 and beyond.

Financial KPIs
NIWA’s financial KPIs for the first half of the year are all ahead of the budget set out in the Statement of
Corporate Intent. This is largely due to the strong revenue position, as outlined above.

                                        Ratios and Statistics
                                      as at 31 December 2020

                                                            Actual              SCI                SCI
                                                          Year to date      Year to date        Full year
 Revenue and other gains ($000s)                                86,041            76,838           159,820

 Liquidity
  Current ratio                                                      1.6               1.8               1.9
  Quick ratio (aka Acid test)                                        3.5               4.7               3.6

 Profitability (%)
  Adjusted return on equity*                                         8.4               2.7               6.0
  Return on equity                                                   7.0               2.3               5.0
  Return on assets                                                   6.5               2.1               4.9

 Operational risk (%)
  Profit volatility                                                 16.1             18.7              18.7
  Forecasting risk (non-adjusted ROE)                                2.4              1.9               1.9

 Coverage
  Interest cover                                                    N/A               N/A               N/A

 Growth/Investment (%)
  Capital renewal                                                 109.7             115.3             122.3

 Financial strength ($000s)
  Cash and other short-term investments                          61,384            50,569           43,906

*Agreed with Officials after adjustment in 2006/07 for restatement of certain land and buildings cost figures.

                                                                                                  2|Page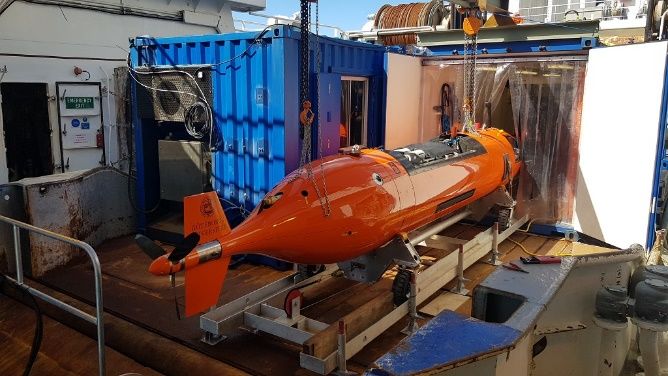
NIWA Science Achievements

Significant advancements in co-developed taonga species research
NIWA recently co-developed a kōura (freshwater crayfish) restoration plan for Ngāti Tahu Ngāti Whaoa. This is
the first plan of its kind and the first step towards restoring the health and wellbeing of kōura populations in the
Waikato River catchment, as well as the connection between the Ngāti Tahu Ngāti Whaoa people and their
taonga species. The plan outlines the importance of kōura to the Ngāti Tahu Ngāti Whaoa people, identifies key
pressures on populations, introduces a variety of tools that whānau can use to help restore kōura, and provides
guidance around designing packages of kōura restoration approaches that meet the needs of specific locations
and outcomes sought. This complements and connects with the Ngāti Tahu Ngāti Whaoa Iwi Environmental
Management Plan and their mahinga kai-focused work programme. The work programme seeks to increase the
distribution and abundance of kōura, as well as the interactions of Ngāti Tahu Ngāti Whaoa tamariki and
rangatahi with this taonga species.

The first freshwater taonga species Climate Change Vulnerability Assessment is now publicly available. NIWA,
partially funded by the Te Wai Māori Trust, identified seven taonga freshwater species native to Aotearoa New
Zealand that are highly or very highly vulnerable to the impacts of climate change. NIWA, in collaboration with
Te Wai Māori Trust and Te Ohu Kaimoana, created a package of resources that are now freely available via the
Te Wai Māori Trust and NIWA websites: waimaori.maori.nz/vulnerability-assessment-reports-for-freshwater-
taonga-species-to-climate-change/. This package of resources was formally launched via a live webinar that is
available on the Te Wai Māori Trust Facebook page www.facebook.com/tewaimaori/. More than 1,000 people
marked their interest in the event and our webinar has had more than 800 views, reaffirming the importance
people place on the health and abundance of our taonga species.

Extension of tsunami DART buoy network
In August a NIWA-led voyage on RV Tangaroa successfully completed the deployment of the Deep Ocean
Assessment and Reporting of Tsunami (DART) buoy network along the Kermadec–Tonga Trench to improve the
accuracy and detection of tsunami risk to New Zealand and its Pacific island neighbours. When complete, the
network will be the second most extensive tsunami warning system in the world and provide an unprecedented
capability for the real-time detection of tsunamis in the Southwest Pacific.

                                                                                                     3|Page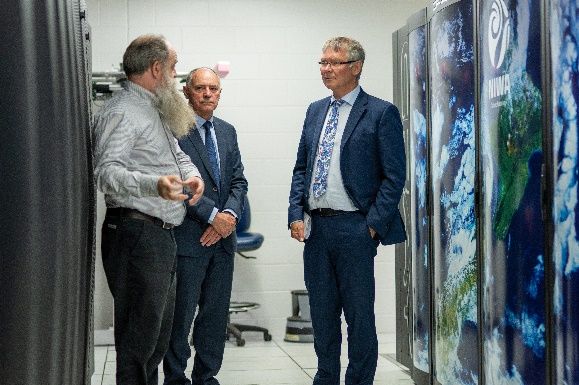
The network is supported through the National
Emergency Management Agency (NEMA). NIWA has
been contracted by NEMA to operate and maintain
the DART buoy network, while GNS Science has been
contracted to receive the network data and provide a
24/7 tsunami warning system. The buoys are
manufactured and supplied by the US company
Science Applications International Corp (SAIC), who
have also assisted with deployments. The aim of the
August voyage was to deploy five DART buoys from
off the Wairarapa coast to about 250 miles northwest
of Niue. While the voyage was delayed by several
days, due to the late arrival of the buoys from the US
for testing and commissioning at the NIWA
Wellington site, four of the five buoys were
successfully deployed. Tangaroa was unable to
deploy the fifth buoy north of East Cape because of
rough weather. This buoy will now be deployed early
next year along with the remaining three buoys of the
network in the New Caledonia region.

 A tsunami detection buoy. The DART 4G system comprises a bottom pressure sensor (BPR) (the grey cylinder), mounted on a platform
 with a release mechanism (yellow cylinder) with attached flotation (the yellow spheres). The surface buoy is anchored to the seafloor.
 Communications between the BPR and the surface buoy is via an acoustic transducer attached to the BPR. The pressure change in the
 water column above the BPR is detected when a tsunami passes over it. This information is relayed to the surface buoy that contains the
 necessary electronics and Iridium satellite systems for telecommunication of the data to shore.

Tangaroa survey of the Kaikoura Canyon
In October 2020 RV Tangaroa successfully completed a complex 27-day voyage using an Autonomous
Underwater Vehicle (AUV) to research the impacts of the 2016 Kaikoura earthquake on the Kaikoura Canyon.
The six-metre-long AUV was on loan from Sweden’s Gothenburg University, and is one of the most sophisticated
pieces of ocean technology to be operated in New Zealand waters. The mobilisation, transportation, operational
costs and technicians required to operate the AUV were covered through an international arrangement for
sharing scientific equipment, the marine research alliance Eurofleets+.

Installation of the 9.5-m-long launch and recovery system on the Tangaroa trawl ramp (left), and the AUV on deck with the
                                         workshop and control containers (right).

                                                                                                                       4|Page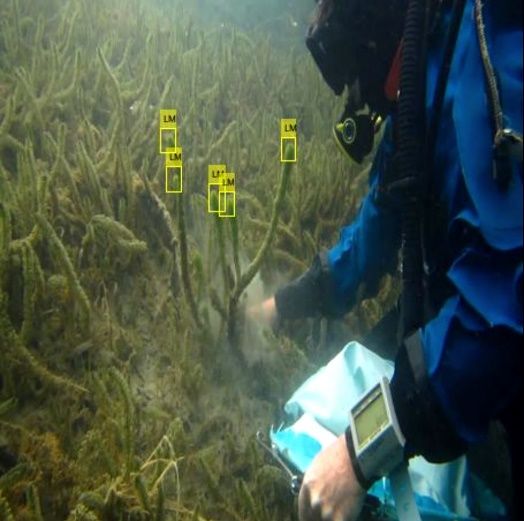
Two previous NIWA surveys discovered that large areas of the Kaikōura Canyon were drastically changed by the
2016 earthquake. They showed that an enormous amount of mud and sediment – estimated to be about 850
million tonnes – had been shaken off the canyon rim and had flowed into the canyon channel, causing a powerful
‘flushing’ of sediment out to the deep ocean. The 14 successful missions of the AUV will help determine the
processes behind the removal of such large amounts of sediment and rock from the canyon and identify any
recovery of the original biologically diverse seafloor communities.

This highly successful voyage also hosted three representatives of local Iwi and welcomed a shore-based
delegation onto the vessel for a tour and lunch during the voyage. Feedback has indicated that the iwi was
immensely grateful for the opportunity to participate on the voyage and witness first-hand the research being
undertaken.

     Difference in canyon seafloor topography resolution between Tangaroa multibeam (left) and AUV image (right).

Environmental forecasting
A major strategic focus of NIWA’s research over the past two decades has been to model, predict and
communicate climate and weather-related hazards, impacts and risks across New Zealand. The impacts of
climate and weather influence our societal wellbeing, economy and environment, and are increasing in response
to a changing climate. These impacts include weather hazards (floods, droughts, damaging storms, avalanches,
fires), variable water quality and quantity, levels of air pollution and greenhouse gas emissions, dispersion of
volcanic ash, infectious diseases and pests, renewable energy generation (wind, solar, hydro, waves), primary
production, transport operations (ports, railways, roading), recreational activities and environmental
management. Research on these impacts has required the ongoing refinement and use of world-class numerical
weather prediction and regional climate models, both researched and operationally run using NIWA’s high-
performance computing facility.

Advances in the resolution and accuracy of our weather and climate forecasting research are now being applied
and benefiting two new users, Emirates Team New Zealand and the Department of Conservation.

                                                                                                       5|Page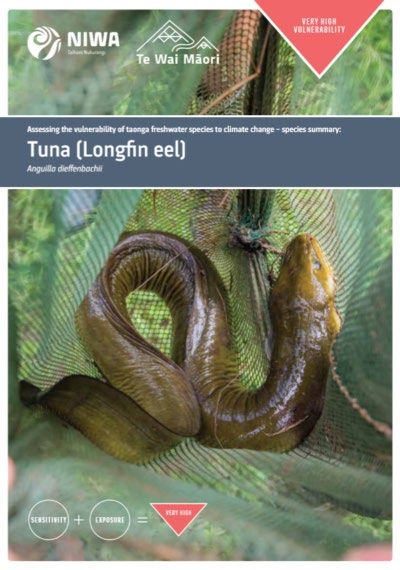
NIWA support of the America’s Cup
                                             In support of Emirates Team New Zealand, NIWA has provided
                                             supercomputing-based analysis of past environmental conditions,
                                             predictions of future weather and model outputs of the ocean
                                             currents for the Hauraki Gulf region. This information has
                                             provided input into the race vessel design, and vessel testing and
                                             crew training on the water.

                                             NIWA developed a bespoke service to support pre-race briefings
                                             and decision making based on wind forecasts at extremely high
                                             resolutions of 333 metres and current and wave forecasts at 76-
                                             metre resolution. These forecasts were provided to Emirates
                                             Team New Zealand for the December World Series races and will
                                             be provided for the final cup races.

                                             NIWA has also supplied weather graphics for TVNZ’s pre-regatta
                                             coverage of the America’s Cup events, and model wind forecast
                                             data to Animation Research Ltd (ARL) for augmented reality
                                             visualisation of the racing events.

Mountain forecasting for the conservation estate
NIWA has entered into a six-year contract with the Department of Conservation (DOC) to provide a high-
resolution environmental forecasting service for the mountain regions they administer. This service will use a
new and improved public website to provide automated daily forecasts on an unprecedented range of weather
hazards for 70 locations and weather videos for each National Park. DOC staff will have direct access to NIWA’s
modelling and observations and a 24/7 on-call forecaster for operational decision support. Innovations will
include new hazard forecasting products and development of new warning indices to inform hikers of potential
weather-related risks.

Minister Parker visit
The Minister for the Environment the Hon David Parker
visited NIWA's Wellington offices in December 2020 to
discuss and observe advances in NIWA’s environmental
forecasting models in relation to the future management of
New Zealand’s freshwater resources. Discussions focused on
development of the New Zealand water model (NZWaM)
within our forecasting system and its potential use in the
guidance of water allocation and its potential to assist with
water quality management. The Minister also visited the high
performance supercomputer used to run the forecasting
models for research and operational services.

                                                                                                 6|Page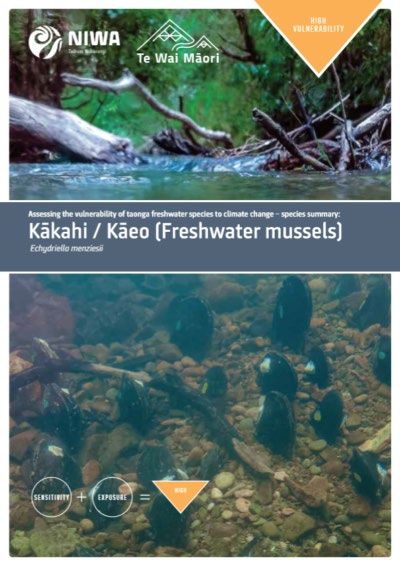
Auto-detection of submerged invasive weeds in freshwater
Maintaining New Zealand’s freshwater biosecurity is an
important aim of our Freshwater Environment Platform. To
better manage incursions of freshwater invasive species, we
have developed software using artificial intelligence that will
automatically detect and GPS-locate invasive plants, in real time,
from a video camera mounted below a moving surface craft.
After running concept-proving exercises in NIWA’s Ruakura
flume facility, we are now training the model to detect the
invasive macrophyte Lagarosiphon in natural waterways, with
very encouraging results (see photograph). Early detection and
removal of invasive species is the key to managing these pest
species and preventing recolonisation after eradication Weeding a lone Lagarosiphon plant from a dense
programmes. This software will greatly increase the ability to bed of Elodea plants. NIWA software has
do this efficiently. successfully identified and labelled L. major,
accurately differentiating it from the Elodea.
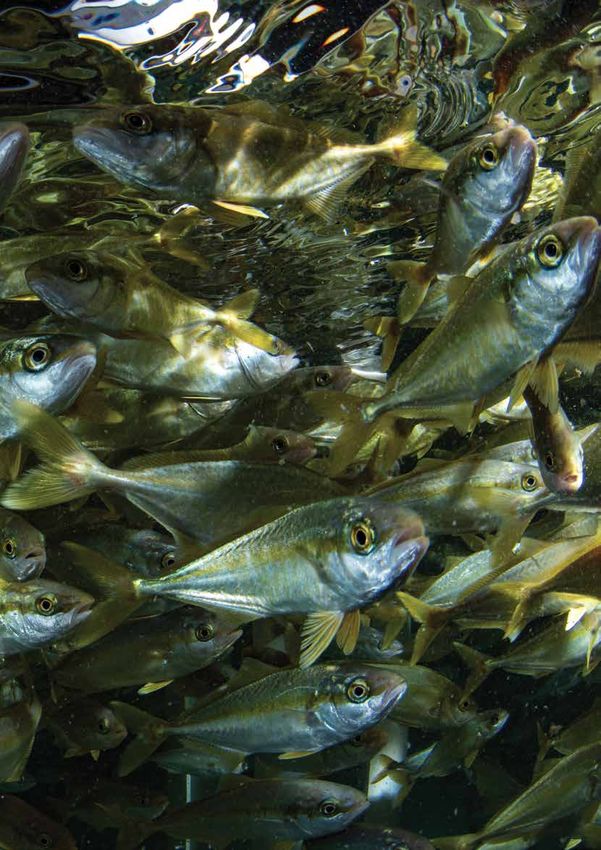
Ruakaka kingfish commercial-scale production
As a result of our ongoing market testing, the demand and sale price for kingfish from NIWA’s Northland Marine
Research Centre at Ruakaka continues to grow. We have sold 2,170kg of fish to date this financial year to Leigh
Fisheries Ltd for distribution to high-end restaurants in the domestic market (e.g., French Café in Auckland, Three
Seven Two on Waiheke Island). We continue to receive excellent feedback on the quality and freshness of our
kingfish product, which now fetches a price similar to that of farmed salmon.
Social media post showing NIWA-grown kingfish as served in a restaurant.
The planning and design of the new 600 tonne/annum Recirculating Aquaculture System (RAS) for commercial-
scale fish culture research at the Northland Marine Research Centre has been completed, along with a third-
party peer review of the design and bill of materials. The final layout of the system has remained similar to
previous versions, with two, side-by-side, four-tank modules, each with their own system for advanced
treatment of the recirculating water, including mobile bed bioreactors, CO2 strippers, oxygen injectors, and UV
disinfection (see diagram below). With the design and layout phase of the project nearing completion, the
project is expected to advance to contracting for construction in March-April 2021.
7|Page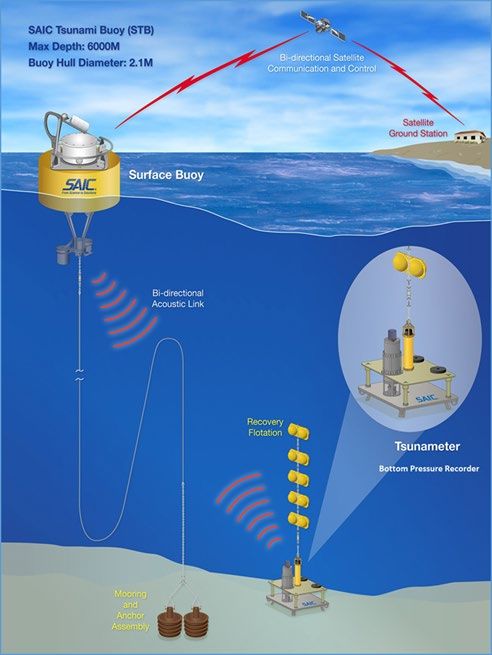
Diagrammatic representation of the RAS system to be constructed at the NIWA Northland Marine Research Centre.

A refreshed focus on sustainability
NIWA is committed to delivering sustainability-focused approaches that impact, influence or contribute to
societal change and the economic and environmental health of New Zealand’s resources. We aim to provide the
science to help New Zealanders manage the transition to a sustainable future.

This year we are implementing our refreshed Organisational Sustainability Charter and explicitly aligning our
principles and practice with the UN Sustainable Development Goals and the NZ Treasury Living Standards
Framework. Guidance from the Ministry for the Environment (MfE) included new emissions factors for
calculating CO2 emissions. We have adjusted our previously estimated FY19/20 base year emissions data by
applying the MfE factors for assessing our progress towards reducing emissions. The reastablished CO2 baseline
emission is 8,148 tonne p.a.

Barry Harris                                                John Morgan
Chairman                                                    Chief Executive

February 2021

                                                                                                                 8|Page
Statement of comprehensive income
for the 6 months ended 31 December 2020
in thousands of New Zealand dollars Note 6 Months 6 Months 12 Months
to to to
Dec 20 Dec 19 Jun 20
Unaudited Unaudited Audited
Revenues and other gains 1
Revenue 86,040 68,909 158,859
Other gains 1 1 1
Total income 86,041 68,910 158,860
Operating expenses 2
Employee benefits expense (38,989) (37,820) (76,657)
Other expenses (23,779) (24,128) (50,960)
(62,768) (61,948) (127,617)
Profit/(loss) before interest, income tax,
depreciation and amortisation 23,273 6,962 31,243
Depreciation (9,758) (10,504) (20,547)
Amortisation (309) (473) (906)
Profit/(loss) before interest and income tax 13,206 (4,015) 9,790
Interest income 311 335 599
Finance expense (196) (300) (407)
Net interest and other financing costs 115 35 192
Profit/(loss) before income tax 13,321 (3,980) 9,982
Income tax credit/(expense) (3,730) 1,114 (2,612)
Profit/(loss) for the period 9,591 (2,866) 7,370
Other comprehensive income
Foreign currency translation differences
for foreign operations (13) (20) 24
Total comprehensive income for the period 9,578 (2,886) 7,394
Profit/(loss) attributable to:
Parent interest 9,570 (2,830) 7,341
Minority interest 21 (36) 29
Profit for the period 9,591 (2,866) 7,370
Total comprehensive income attributable to:
Parent interest 9,557 (2,850) 7,365
Minority interest 21 (36) 29
Total comprehensive income for the period 9,578 (2,886) 7,394
The accompanying ‘Notes to the financial statements’ are an integral part of, and should be read in conjunction with, these
financial statements.
9|PageStatement of changes in equity
for the 6 months ended 31 December 2020
in thousands of New Zealand dollars Share Retained Minority Foreign Total
capital earnings interest currency equity
translation
reserve
Balance at 1 July 2019 24,799 101,512 255 (309) 126,257
(Audited)
Profit for the year – (2,830) (36) – (2,866)
Translation of foreign operations – – – (20) (20)
Total comprehensive income – (2,830) (36) (20) (2,886)
Adoption of NZ IFRS 16 – (3,351) – – (3,351)
Balance at 31 December 2019 24,799 95,331 219 (329) 120,020
(Unaudited)
Balance at 1 July 2019 24,799 101,512 255 (309) 126,257
(Audited)
Profit for the year – 7,341 29 – 7,370
Translation of foreign operations – – – 24 24
Total comprehensive income – 7,341 29 24 7,394
Adoption of NZ IFRS 16 – (1,940) – – (1,940)
Balance at 30 June 2020 (Audited) 24,799 106,913 284 (285) 131,711
Balance at 1 July 2020 24,799 106,913 284 (285) 131,711
(Audited)
Profit for the year – 9,570 21 – 9,591
Translation of foreign operations – – – (13) (13)
Total comprehensive income – 9,570 21 (13) 9,578
Balance at 31 December 2020 24,799 116,483 305 (298) 141,289
(Unaudited)
The accompanying ‘Notes to the financial statements’ are an integral part of, and should be read in conjunction with, these
financial statements.
Share capital
The Group has issued and fully paid capital of 24,798,700 ordinary shares (2020: 24,798,700 ordinary shares). All shares
carry equal voting and distribution rights and have no par value.
10 | P a g eStatement of financial position
as at 31 December 2020
in thousands of New Zealand dollars Note As at As at As at
Dec 20 Dec 19 Jun 20
Unaudited Unaudited Audited
Equity
Share capital 24,799 24,799 24,799
Equity reserves 116,185 95,002 106,628
Shareholders’ interest 140,984 119,801 131,427
Non-controlling interest 305 219 284
Total equity 141,289 120,020 131,711
Non-current liabilities
Provision for employee entitlements 903 948 1,019
Lease liabilities 9,950 9,725 9,879
Deferred tax liability 2,824 4,656 2,824
Total non-current liabilities 13,677 15,329 13,722
Current liabilities
Payables and accruals 9,256 8,691 9,793
Revenue in advance 32,635 28,665 24,633
Provision for employee entitlements 10,182 8,667 9,406
Tax payable 2,754 – 2,922
Lease liabilities 1,952 1,262 1,460
Forward exchange derivatives 46 52 8
Total current liabilities 56,825 47,337 48,222
Total equity and liabilities 211,791 182,686 193,655
Non-current assets
Property, plant and equipment 110,566 110,410 109,405
Identifiable intangibles 1,318 1,128 1,576
Deferred tax asset 142 158 143
Right-of-use assets 9,543 7,730 8,861
Prepayments 66 55 66
Total non-current assets 121,635 119,481 120,051
Current assets
Cash and cash equivalents 22,384 13,112 24,173
Other short-term investments 39,000 17,000 25,000
Receivables 7,388 10,623 12,546
Prepayments 3,675 4,051 2,231
Taxation receivable – 1,471 –
Assets held for sale 245 245 245
Uninvoiced receivables 14,787 13,802 6,834
Inventories 2,677 2,901 2,575
Total current assets 90,156 63,205 73,604
Total assets 211,791 182,686 193,655
The accompanying ‘Notes to the financial statements’ are an integral part of, and should be read in conjunction with, these
financial statements.
11 | P a g eCash flow statement
for the 6 months ended 31 December 2020
in thousands of New Zealand dollars Note 6 Months 6 Months 12 Months
to to to
Dec 20 Dec 19 Jun 20
Unaudited Unaudited Audited
Cash flows from operating activities
Cash was provided from:
Receipts from customers 91,245 82,779 173,719
Dividends received 1 1 1
Interest received 311 334 600
Cash was disbursed to:
Payments to employees and suppliers (64,166) (67,017) (128,801)
Interest paid (196) (300) (407)
Taxation paid (3,897) (2,854) (3,254)
Net cash inflow from operating activities 3 23,298 12,943 41,858
Cash flows from investing activities
Cash was provided from:
Sale of property, plant and equipment 25 2 31
Investments in other term deposits 11,000 5,000 29,000
Cash was applied to:
Purchase of property, plant and equipment (10,250) (5,321) (13,506)
Purchase of intangible assets (51) (162) (1,043)
Investments in other term deposits (25,000) (12,000) (44,000)
Net cash outflow in investing activities (24,276) (12,481) (29,518)
Cash flows from financing activities
Cash was applied to:
Payments for lease principal (795) (625) (1,465)
Net cash outflow from financing activities (795) (625) (1,465)
Net increase/(decrease) in cash and cash
equivalents (1,773) (163) 10,875
Effects of exchange rate changes on the balance of
cash held in foreign currency (16) (2) 21
Opening balance of cash and cash equivalents 24,173 13,277 13,277
Closing cash and cash equivalents balance 22,384 13,112 24,173
Made up of:
Cash 5,257 1,454 1,923
Short-term deposits 17,127 11,658 22,250
Closing cash and cash equivalents balance 22,384 13,112 24,173
The accompanying ‘Notes to the financial statements’ are an integral part of, and should be read in conjunction with, these financial
statements.
12 | P a g ePreparation disclosures
Reporting Entity
National Institute of Water & Atmospheric Research Limited (‘NIWA’ or ‘the Company’) and its
subsidiaries form the consolidated Group (‘the NIWA Group’ or ‘the Group’). NIWA is a profit-
orientated company registered in New Zealand under the Companies Act 1993.
The financial statements for the NIWA Group are presented in accordance with the requirements of
the Crown Research Institutes Act 1992, the Crown Entities Act 2004, the Public Finance Act 1989, the
Companies Act 1993, and the Financial Reporting Act 2013.
Nature of activities
The NIWA Group conducts research and commercial science in water and atmospheric sciences in New
Zealand and internationally.
Basis of preparation
The measurement basis adopted in the preparation of these financial statements is historical cost, except
for financial instruments as identified in specific accounting policies. Cost is based on the fair value of
consideration given in exchange for assets.
The presentation currency of the Group and functional currency used in the preparation of these financial
statements is New Zealand Dollars.
Accounting policies are selected and applied in a manner that ensures that the resulting financial
information meets the concepts of relevance and reliability, ensuring that the substance of the underlying
transaction or event is reported.
The Group’s accounting policies have been consistently applied in preparing the financial statements for
the six months ended 31 December 2020; and the comparative information for the six months ended 31
December 2019 and the year ended 30 June 2020.
Statement of compliance
The financial statements have been prepared in accordance with New Zealand generally accepted
accounting practice (NZ GAAP). They comply with the New Zealand equivalents to International Financial
Reporting Standards (NZ IFRS) and other applicable financial reporting standards appropriate for profit-
oriented entities.
The financial statements comply with International Financial Reporting Standards (IFRS).
These interim financial statements have been prepared in accordance with the requirements of NZ IAS
34 Interim Financial Reporting. They should be read in conjunction with the 2020 annual report.
Accounting judgements and major sources of uncertainty
In the application of the accounting policies, the Group makes judgements, estimates and assumptions
about the carrying amounts of assets and liabilities that are not readily apparent from other sources.
The estimates and associated assumptions are based on historical experience and other factors that
are considered to be relevant.
13 | P a g eEstimates and underlying assumptions are reviewed on an ongoing basis. Revisions to accounting
estimates are recognised in the period in which the estimate is revised and in any future periods affected.
Comparatives
The financial statements for the six months ended 31 December 2020 and for the comparative six-
month period to 31 December 2019 are unaudited. The comparative figures for the year ended 30
June 2020 are audited.
14 | P a g eNotes to the financial statements
for the 6 months ended 31 December 2020
1. Revenues and other gains
in thousands of New Zealand dollars 6 Months 6 Months 12 Months
to to to
Dec 20 Dec 19 Jun 20
Unaudited Unaudited Audited
Research
Strategic funding 23,632 22,734 49,489
Rendering of services 22,307 16,154 36,041
COVID-19 Response and Recovery Funding 8,270 – 8,270
Commercial science
Rendering of services 28,954 28,013 60,061
Sale of goods 2,877 2,008 4,998
Dividends 1 1 1
Total operating revenue 86,041 68,910 158,860
2. Operating expenses
Employee benefits
in thousands of New Zealand dollars 6 Months 6 Months 12 Months
to to to
Dec 20 Dec 19 Jun 20
Unaudited Unaudited Audited
Defined contribution plans 1,623 1,609 3,246
Termination benefits 209 161 203
Other employee benefits 37,157 36,050 73,208
Employee benefit expense 38,989 37,820 76,657
Other expenses
in thousands of New Zealand dollars 6 Months 6 Months 12 Months
to to to
Dec 20 Dec 19 Jun 20
Unaudited Unaudited Audited
Materials and supplies 4,372 3,698 8,297
Research collaboration 6,410 5,287 13,491
Property occupancy costs 2,255 2,380 4,459
Information technology 3,313 3,916 7,243
Remuneration of directors 131 152 283
Foreign currency (gain)/loss 66 (21) (105)
Movement within loss allowance provision – – 1,487
Bad debts written off 15 – –
Change in the fair value of derivatives 38 40 (4)
Other expenses 7,088 8,589 15,629
23,688 24,041 50,780
15 | P a g eAuditor’s remuneration
in thousands of New Zealand dollars 6 Months 6 Months 12 Months
to to to
Dec 20 Dec 19 Jun 20
Unaudited Unaudited Audited
Auditor’s remuneration comprises:
Audit of the financial statements (Group) 80 73 151
Audit of the financial statements (Subsidiary) 11 14 29
Total auditor’s remuneration 91 87 180
3. Reconciliation of the profit for the period to net cash inflow from operating activities
in thousands of New Zealand dollars 6 Months 6 Months 12 Months
to to to
Dec 20 Dec 19 Jun 20
Unaudited Unaudited Audited
Profit for the period 9,591 (2,866) 7,370
Add/(less) items classified as investing activities
Net loss/(gain) on disposal of property, plant and
equipment (18) 6 59
(18) 6 59
Add/(less) non-cash items
Depreciation and impairment 9,758 10,504 20,547
Amortisation of identifiable intangibles 309 473 906
Net foreign currency (gain)/loss 3 (17) 5
Increase/(decrease) in deferred tax liability 1 – –
10,071 10,960 21,458
Add/(less) movements in working capital items
Increase/(decrease) in payables and accruals and revenue in
advance 7,465 9,324 6,181
Increase/(decrease) in employee entitlements 660 167 977
(Increase)/decrease in receivables and prepayments 3,714 7,475 7,361
(Increase)/decrease in inventory and uninvoiced (8,055) (8,196) (902)
receivables
(Increase)/decrease in taxation receivable (168) (3,967) (642)
(Increase)/decrease in forward exchange derivatives 38 40 (4)
3,654 4,843 12,971
Net cash flows from operating activities 23,298 12,943 41,858
4. Related party transactions
The Government of New Zealand (the Crown) is the ultimate shareholder of the NIWA Group. No
transactions with other New Zealand Government-owned entities are considered as related party
transactions in terms of NZ IAS 24. No related party debts have been written off or forgiven during the
year. Any business the NIWA Group has transacted in which a director or an employee has an interest has
been carried out on a commercial basis. Any potential conflict is recorded in the minutes of Board
meetings for directors and a separate interests register for employees. The interests register containing
all relevant interests is updated on a regular and timely basis.
16 | P a g e5. Key management personnel compensation
in thousands of New Zealand dollars 6 Months 6 Months 12 Months
to to to
Dec 20 Dec 19 Jun 20
Unaudited Unaudited Audited
Short-term benefits 1,970 2,006 3,709
The table above includes remuneration of the Chief Executive Officer, Executive Team and the Board of
Directors
Chief Executive’s remuneration
The Chief Executive’s remuneration package that will apply for 2021, together with the comparative
information for the prior year, is as follows:
in New Zealand dollars 6 Months 6 Months 12 Months
to to to
Dec 20 Dec 19 Jun 20
Unaudited Unaudited Audited
Base salary 1 349,674 353,255 661,116
Benefits 2 30,486 28,482 53,880
Total remuneration 380,160 381,737 714,996
Note 1: Actual salary paid includes holiday pay paid consistent with New Zealand legislation. The base
salary for 2021 is $658,711 (2020: $658,711).
Note 2: Benefits include KiwiSaver, insurance and vehicle fuel expenses.
The Chief Executive is a member of KiwiSaver. As a member of this scheme, all Group staff, including the
Chief Executive, are eligible to contribute and receive a matching company contribution up to a maximum
of 5% of gross taxable earnings. In the period to date, the Group’s contribution was $17,737 (2020:
$17,663)
Executive Team remuneration
In addition to the Chief Executive, NIWA’s Executive Team consists of eight members. The remuneration
package for all Executive Team members combined (excluding the Chief Executive) that will apply for
2021, together with the comparative information for the prior year, is as follows:
in New Zealand dollars 6 Months 6 Months 12 Months
to to to
Dec 20 Dec 19 Jun 20
Unaudited Unaudited Audited
Base salary 1 1,353,520 1,345,858 2,470,929
Benefits 2 106,011 129,055 239,932
Total remuneration 1,459,531 1,474,913 2,710,861
Note 1: Actual salaries paid includes holiday pay paid consistent with New Zealand legislation. The base
salaries for 2021 total $2,412,883 (2020: $2,403,941).
Note 2: Benefits include employer contributions to superannuation schemes (KiwiSaver or legacy
government superannuation schemes, as applicable), insurance and wellness allowances.
17 | P a g e6. Capital commitments
in thousands of New Zealand dollars 6 Months 6 Months 12 Months
to to to
Dec 20 Dec 19 Jun 20
Unaudited Unaudited Audited
Commitments for future capital expenditure:
Contracted, but not provided for 2,980 2,356 3,334
7. Contingent liabilities
The ground lease over the Hamilton office site includes a clause that requires the site to be restored
at the end of the lease. Ongoing negotiations over the future use of the site had meant that it was not
yet probable that NIWA would be required to restore the site, therefore no provision for this was
included in the financial statements for site restoration. Quantity surveyors had provided an estimate
of the costs for restoring the site (including demolition of buildings) which had previously been
disclosed below as a contingent liability. Recent negotiations have confirmed that the Group will not
be required to restore the site, so a contingent liability is no longer disclosed.
in thousands of New Zealand dollars 6 Months 6 Months 12 Months
to to to
Dec 20 Dec 19 Jun 20
Unaudited Unaudited Audited
Site restoration lease clause – 500 –
8. Subsequent events
There are no material events occurring subsequent to 31 December 2020 which require adjustment or
disclosure in the financial statements.
18 | P a g eNational Institute of Water & Atmospheric Research Ltd
Directory
BOARD OF DIRECTORS
Barry Harris (Chairman)
Nicholas Main (Deputy Chairman)
Dr Helen Anderson
Dr Tracey Batten
Prof. Gillian Lewis
Mary-Anne Macleod
EXECUTIVE TEAM
John Morgan, Chief Executive Officer
Geoff Baird, General Manager, Communications & Marketing
Patrick Baker, Chief Financial Officer and Company Secretary
Dr Barry Biggs, General Manager, Technology & Innovation (until 31 July 2020)
Dr Bryce Cooper, General Manager, Strategy
Dr Mary-Anne Dehar, General Manager, People & Capability
Warrick Johnston, General Manager, Technology & Innovation (from 1 August 2020)
Dr Rob Murdoch, General Manager, Research
Dr Helen Neil, General Manager, Operations
Marino Tahi, General Manager, Māori Strategy & Partnerships
Auditors Solicitors
Troy Florence with the assistance of PricewaterhouseCoopers Atkins Holm Majurey
on behalf of the Auditor-General Meredith Connell
Bankers Insurance Broker
ANZ Bank of New Zealand Ltd Marsh Ltd
ASB Bank Ltd
Westpac New Zealand Ltd
Registered Office and Address for Service
41 Market Place, Auckland Central 1010, New Zealand www.niwa.co.nz
weather.niwa.co.nz
facebook.com/nzniwa
twitter.com/niwa_nz
twitter.com/niwaweather
linkedin.com/company/niwa
Instagram.com/niwa_science
19 | P a g eClimate, Freshwater & Ocean Science
You can also read