Investor Day 2019 27 May 2019 - Air New Zealand website
←
→
Page content transcription
If your browser does not render page correctly, please read the page content below

Investor Day
2019           27 May 2019

                  1
Forward-looking statements

This presentation contains forward-looking statements. Forward-looking statements often include words
such as “anticipate”, “expect”, “intend”, “plan”, “believe”, “continue” or similar words in connection with
discussions of future operating or financial performance.

The forward-looking statements are based on management's and directors’ current expectations and
assumptions regarding Air New Zealand’s businesses and performance, the economy and other future
conditions, circumstances and results. As with any projection or forecast, forward-looking statements are
inherently susceptible to uncertainty and changes in circumstances. Air New Zealand’s actual results
may vary materially from those expressed or implied in its forward-looking statements.

The Company, its directors, employees and/or shareholders shall have no liability whatsoever to any
person for any loss arising from this presentation or any information supplied in connection with it. The
Company is under no obligation to update this presentation or the information contained in it after it has
been released.

Nothing in this presentation constitutes financial, legal, tax or other advice.

                                                                                                       2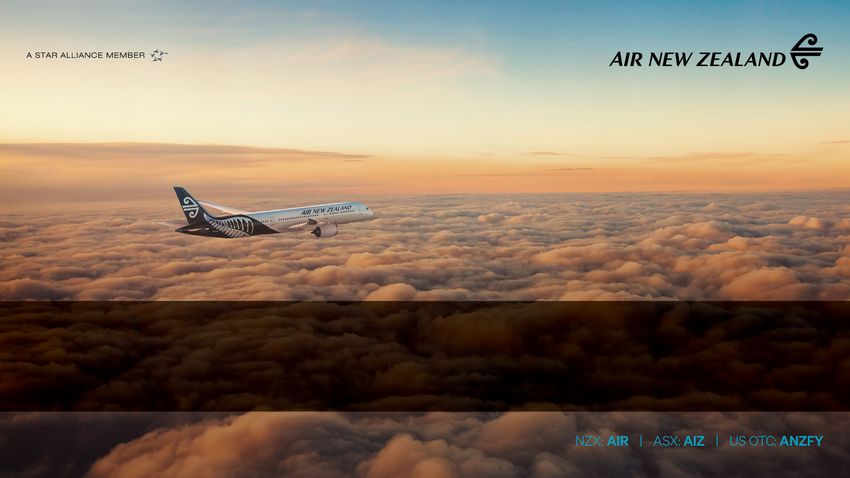
Today’s speakers

       Christopher Luxon
       Chief Executive Officer

       Nick Judd                                      Carrie Hurihanganui
       Chief Strategy, Networks & Alliances Officer   Chief Ground Operations Officer

       Cam Wallace                                    Jeff McDowall
       Chief Revenue Officer                          Chief Financial Officer

                                                                                        3
Agenda

         4
Business update   Christopher Luxon
                  Chief Executive Officer

                                            5
Key messages you should take away from today

•   We are resilient and adaptable, with the ability
    to respond quickly to changing macro
    conditions

•   We have initiatives in place to drive
    sustainable cost improvement, earnings
    growth and improved ROIC in the lower
    demand environment

•   We are committed to continued investment to support
    exceptional culture, to delivering a superior customer
    experience and to making strong commercial returns

•   We are targeting strong free cash flow generation over the
    next three years

                                                                 6
Who we are
    Operational                                    Community                              Financial
    79                                             #1                                     Baa2
    years in operation                             corporate reputation                   investment grade credit
                                                   in New Zealand for                     rating from Moody’s
    32                                             5 consecutive years
                                                                                          13%
    international destinations1                    #1                                     Annualised shareholder
    20                                             corporate reputation                   return over the past 10 years
    domestic destinations
                                                   in Australia for
                                                   3 consecutive years                    16
                                                                                          Years of consecutive
    Pacific Rim                                    #1                                     profitability2
    Focused network driven by
    alliance relationships
                                                   New Zealand’s most
                                                   attractive employer
                                                                                          14
                                                                                          years of consecutive
    ~12,500                                        Winner                                 dividend distributions
    Air New Zealand employees
    based globally
                                                   2019 Eco-Airline of the                8%
                                                   year                                   Average dividend yield over
1   Includes Seoul route which commences late November 2019.                              the past 10 years
2   2019 full year outlook as disclosed in the Business Review update on 28 March 2019.
                                                                                                                          7
Our GoBeyond mission continues to guide our priorities for
sustainable success

                                                             8
We are constantly striving for a successful balance between
our customers, our culture and our commercial performance

                                                              9
Despite network disruptions this year, our key customer
metrics remain high, reflecting ongoing investment

 Record level
  Overall customer satisfaction
                                             #1
                                   Corporate Reputation in
                                                                        6ptd
                                                                      Net promotor score
         (stable year on year)    New Zealand and Australia            (improvement from 2016)
                                     (no change from 2018 rankings)

                                                                                                 10
The power of our brand is embedded in our
~12,500 people and our continued investment in them
Learning & Development Diversity & Inclusion Future of Work
Continuous learning Indigenous Growth Reskilling
Development Programme
Investment in mobility tools Automation
New parental leave policy
11We have the right business model and competitive
advantages to sustain long-term commercial success…
Our brand and Kiwi Customer loyalty, Our alliance-driven Our simplified and
service culture driven by strength Pacific Rim network fuel efficient fleet,
of our domestic with the ideal cost
network and Airpoints™ structure for the
programme New Zealand market
Record level of 82% Domestic Over 30 international Young and modern
customer satisfaction passenger market destinations, focused fleet driving strong
#1 Corporate share on the Pacific Rim cost efficiencies
Reputation in New Unmatched network Deep revenue share Targeting flat-to-
Zealand and Australia and customer offering partnerships de-risk improving CASK
New Zealand’s Most 3.2 million AirpointsTM international growth performance
Attractive Employer members and growing
12…as demonstrated by our shareholder return
performance over the past 10 years
10 year total shareholder return
APAC Peers Indices
348% 348%
Air New Zealand China China Qantas Air Bloomberg Cathay Singapore Air New Zealand NZX50 S&P 500 Bloomberg ASX200
Eastern Southern China World Airlines Airlines ANA World Airlines
Index Index
Hainan Thai
Airlines China Virgin
Airlines
Airlines Australia
Source: Bloomberg, period ended as at 10 May 2019.
13We have faced some challenges this year which have
impacted our financial and operational performance…
Rolls-Royce global engine
Moderation in demand growth
issues impacted network and
to 3% to 5%
operating costs
Impacted ~2,500 flights, ~150
cancellations* Mid-year saw softening of demand
growth in domestic leisure segment
Significant network disruption, from high single digits to ~4%,
driving additional costs to along with slowing inbound tourism
ensure operational resiliency growth
for our customers
* Network impacts for 2019 financial year through 20 May 2019.
14…however, we are reaffirming our 2019 outlook from
January, despite higher fuel prices
Updating our
Prior outlook* 2019 outlook
Based on the current market Based on the current market
environment and expectations for environment and reflecting an
the average jet fuel price in the additional ~$25 million headwind
second half of the year of US$75/ from increased jet fuel prices
bbl1, we are targeting 2019 earnings (assuming an average price for the
before taxation to be in the range of second half of the year of
$340 to $400 million. US$78/bbl1), we are targeting 2019
earnings before taxation
to exceed $340 million.
* Prior outlook as disclosed most recently at the Company’s Business Review update on 28 March 2019.
1 Prior outlook assumed an average Singapore jet fuel price for the full year of US$81/bbl; Current outlook now assumes an average Singapore jet fuel price of
US$83/bbl for the 2019 financial year.
15We responded quickly to signs of a slowing growth
environment…
Forward bookings reflect softer
revenue growth to prior Announcement of business Commenced further cost
forecast. Market notification of review including network growth transformation reviews across
earnings expectations and revisions, fleet deferrals and cost targeted operational and
commencement of business reduction initiatives overhead departments
review
Jan 2019 Mar 2019 May – Jun 2019
16…and took immediate and decisive action to adjust our business
Network Fleet
• Revised medium term growth to 3% to • Adjust aircraft deliveries to reflect
5% (from 5% to 7%) slower growth environment
• Focused on optimising network to • Fleet deferrals of ~$750 million
maximise and diversify revenue • Smoother capex profile in 2020-2022
• Stimulate new demand period
• A moderate rate of growth expected on
existing routes
Cost Customer
• Launch of a two-year cost reduction • Progressive roll-out of enhanced seats
programme across multiple cabins
• Expecting to achieve an additional ~$60 • New in-flight soft products including free
million in annualised savings over this Wi-Fi onboard enabled international
period flights
• Focused on both operational and • Upgraded lounge facilities across the
overhead costs network
17
17Focused network strategy is demonstrated by our
preliminary 2020 capacity plan
~+5%
Long-haul Long-haul Domestic Tasman & Preliminary 2020
New Routes Existing Routes Pacific Islands Capacity Growth
18Recent fleet deferral decisions support the 3% to 5% growth
target…
Communicated
as at 28 March:
Revised aircraft
delivery schedule:
1 Delivery schedule as at 26 May 2019.
2 Does not reflect two additional A321
NEO aircraft on order for expected
delivery in 2024.
19…as do updated external forecasts reflecting a moderation
of tourism growth rates…
* Stats New Zealand and Ministry of Business, Innovation and Employment.
The forecast annual growth rate of 4% represents the forecast CAGR for international visitor arrivals to New Zealand in the period 2018 to 2025.
20…however, we continue to maintain fleet flexibility that we
can leverage should the demand environment change
Ability to flex down our fleet* Ability to expand the fleet
5
• Purchase growth units
early termination options
FY21
FY20
one 777-300ER two 777-300ERs** • Incremental operating leases
two A320 domestics
• Use purchase rights and
41 unencumbered aircraft by 2020
Wide-body Narrow-body Turbo-prop
options for growth units
four 777-200ERs 12 A320/A321s 23 Q300s
two ATR72-600s
* Does not include the widebody replacement programme aircraft or one for one replacement aircraft.
** One of these options is only available if unexercised in 2020.
21
21Cost reduction programme targeting $60 million in
annualised savings by the end of 2021
The cost reduction programme is focused on three key pillars:
1 2 3
Removal of ~5% reduction in A targeted review of
inefficiencies overheads through the operations cost
associated with the reprioritisation, base
Rolls-Royce engine process efficiencies
issues and automation
Savings expected to be Savings expected to be Savings expected to be
achieved in 2020 & 2021 achieved across 2020 & 2021 achieved across 2020 & 2021
22
22We will continue to invest in the customer experience…
23
23…as demonstrated today with our commitment to purchase 8
787-10 Dreamliners from 2023
Partnership with Boeing and GE provides many advantages
Superior operating Able to perform a similar
economics when mission set to the current
compared to 777-200 777-200 fleet
Highly fuel-efficient, ~95% commonality of
saving ~190,000 tonnes parts with 787-9 offers Selected airframe: Boeing 787-10
of carbon per annum significant efficiencies
Order flexibility for 787 Engine supplier
aircraft type, size and diversity
timing
Selected engine: GEnx-1B
24What you will hear today
We have attractive opportunities to achieve medium-term
network growth of 3% to 5%
We have numerous initiatives to drive strong revenue
performance
We have multiple levers to drive continued operational
efficiencies and productivity in the future
We are committed to disciplined capital deployment, with a
focus on strong shareholder returns
25Network
Nick Judd
opportunities Chief Strategy, Networks & Alliances Officer
26We have a strong and diversified network with further
Header
opportunities for text
profitable growth
9
Routes operated by Air New Zealand
Routes operated solely by alliance partners
Seoul route will commence late Nov 2019
27Competitors are finding the New Zealand market difficult
Asia North
America
• Hong Kong Airlines exit from Air Canada
AKL-HKG in May 2019 Pacific introducing seasonal
• Exit of AirAsia X from AKL-OOL Islands service YVR-AKL
from Dec 2019
• China airlines exit AKL-SYD
and CHC-MEL/SYD Emirates reduced services
to Bali by ~15% less than
six months after moving to
daily services
Tasman
Virgin Australia reduced AKL-SYD,
CHC-SYD and BNE-WEL capacity
28Continuously focused on route performance and ensuring
that our fleet is utilised in the best way possible
• All routes evaluated against their
strategic objectives and profitability Grow Grow
targets on a quarterly basis yield capacity
Load factor (%)
Review Grow load
factor
Contribution margin (%)
29Continuously focused on route performance and ensuring
that our fleet is utilised in the best way possible
• All routes evaluated against their
strategic objectives and profitability
targets on a quarterly basis Grow
yield
Grow
capacity
– Action plans created for routes in
Load factor (%)
the ‘review’ quadrant
– Decisive action taken where
necessary Review Grow load
factor
Contribution margin (%)
30Continuously focused on route performance and ensuring
that our fleet is utilised in the best way possible
• All routes evaluated against their
strategic objectives and profitability
targets on a quarterly basis Grow
yield
Grow
capacity
– Action plans created for routes in
Load factor (%)
the ‘review’ quadrant
– Decisive action taken where
necessary Review Grow load
factor
• Routes need to stand on their own
merit and make sense relative to other
routes in the network
Contribution margin (%)
31Case Study: Re-timing of our Hong Kong flight
• Previously operated AKL-HKG as an overnight
flight
• This left one widebody aircraft on the ground for
~11 hours before the next scheduled departure
• By re-timing this flight, ground time reduces to
~2 hours which enables us to:
− Free up one widebody aircraft for
additional flying or for use as an
operational spare
− Achieve greater crew efficiencies
− Serve local traffic with no material impact
on connectivity or target traffic flows
32Moderate network growth over the medium-term will be
driven by three principles
Group capacity growth (Historical and current targets)
11.5%
6.6% 6.3% 1 Attractive new markets
5.0% Average of
~4% ~+3% to +5%
2 Upgauge aircraft
2015 2016 2017 2018 2019E 2020E-2022E
3 Maintain or constrain
existing routes
33 4Growth will be focused on stimulating demand
from new markets
Long-haul Tasman Domestic
Seoul Chicago
Taipei
Auckland
Brisbane
Singapore
Auckland
Wellington
Queenstown
Invercargill
Christchurch
34Case study: Diversifying demand in Asia by
expanding into Seoul 1 Attractive new markets
2 Upgauge aircraft
Maintain or constrain
3
Why Seoul? existing routes
Inbound leisure demand is strong, with Seoul
being New Zealand’s third largest Asian market
Currently ~40,000 Koreans living in New Zealand
Demand is highly concentrated, with Seoul
representing ~90% of travel demand
Attractive yields
Approximately 50% of travellers arrive on a one
stop ticket, with most choosing to book online
Existing sales presence, Star Alliance partner
(Asiana Airlines) and trade relationships in-market
35NEO aircraft driving cost effective growth on
Tasman and Pacific Islands markets 1 Attractive new markets
2 Upgauge aircraft
Maintain or constrain
3 existing routes
Realising cost efficiencies with upgauged aircraft
Lower cost per seat
A320
CEO
A320
NEO
A321
NEO
Lower cost per trip
36Targeting positive RASK on existing routes with
stable or slightly declining capacity 1 Attractive new markets
2 Upgauge aircraft
Maintain or constrain
3 existing routes
Domestic example Domestic network seats
(Actuals & indicative forecast)
~13.8 million
seats
• Over 20% seat growth over the past
5 years
11.2 million
seats
• Expect slight decline in domestic
seats for 2020 reflecting lower Expect
slight
capacity decline in
seats after
years of
significant
• Achieved by targeted frequency growth
reductions in select markets
2014 2015 2016 2017 2018 2019E 2020E
37Our strong position is further supported by revenue
Header text
share alliances and deep code share partnerships
9
Revenue share alliance partner
Code share partner
Routes operated by Air New Zealand
Routes operated solely by alliance partners
Seoul route will commence late Nov 2019
38Tasman performance following end of Virgin Australia
alliance has met our expectations
• Large volumes of additional
capacity have been added on
the Tasman by several Trans-tasman capacity share*
competitors
• We have made rational capacity 34% 37%
decisions and continue to focus 25% 26%
on RASK performance
16% 18%
• Our market share has improved
10% 10%
since termination of the alliance
Other 15% 9%
* Left-hand side represents capacity share data for the 12 months prior to the dissolution of the Virgin Australia alliance. Right-hand side represents actual and
scheduled capacity for the 12 months to November 2019.
39Our future network plans
What you can expect
• Overall 2021 and 2022 capacity
growth expected to be lower than
2020
• Aspiration to grow new markets
into daily services
• Continuous optimisation of
existing network as needed
− Including fleet type and
scheduling
− Relentless focus on
enhancing route profitability
40Delivering profitable
Cam Wallace
revenue growth Chief Revenue Officer
41Focused on key opportunities to drive profitable revenue growth
Maintain strength in our home market
Drive effective market development activities
to support new routes
Leverage customer segmentation data
Invest further in the premium customer
experience
Increase value from loyalty and ancillary
Innovate revenue management
42We have the highest domestic market share of
any APAC airline
Leveraging our domestic competitive advantages:
LCC Competitor
18% • New Zealand's most iconic and trusted brand
• Unmatched network offering against sole LCC
competitor
− Over 400 flights daily to 20 domestic destinations
Passenger
− 33 A320/A321 narrow-body aircraft1
market − 52 turbo-prop aircraft1
share
− 15 domestic lounges
• Single class cabins drive cost discipline, with
customers valuing ground product and flexibility
Air New Zealand • 100% of domestic flight emissions are offset
82%
• Working with Tier 3 domestic carriers
1 In-service fleet as at 30 April 2019.
43Domestic traffic is driven by three different and
distinct customer segments and dynamics
Business Travel Inbound Tourism Domestic Tourism
Strong relationships and contracts Stimulation of new international Fare restructure implemented
with Corporate, SME and markets (e.g. Seoul, Chicago, in late February performing in-line
Government clients Taipei) expected to have positive with expectations
result for domestic travel
Senior sales personnel based in key Lower fare classes have been
regions, connecting with influencers Leveraging partnerships stimulated, skewed primarily to
in local communities with alliance JVs and key regional ports
codeshare airlines
44Organisational sales structure and multi-product
approach is valued by our business customers
* Larger SME’s are account managed.
45We understand how to attract inbound leisure
customers better than our competition
• Trip consideration Dreaming
• Flight ads for prospecting
…we actively engage • Hotel ads for prospecting Planning
with customers across
every phase of travel
consideration • Flight ads for retargeting
• Hotel ads for retargeting Booking
• Destination ads for retargeting
• Dynamic retargeting ads for mobile app
• Dynamic retargeting ads for ancillaries Experiencing
46Case study: Stimulating interest in New Zealand
and Air New Zealand prior to Chicago route launch
Focus: present the Air New Zealand
brand and New Zealand destination that
will get consumers motivated to
experience and share amongst their
friends and followers
Solution: provide a fully immersive pop-
up experience
Target audience: consumers, travel
agents, media
47Understanding our customers better allows us to
make investment decisions with better returns
Customer segmentation profiles
48Innovators in customer segmentation with “Seats to
Suit” focused on short-haul markets…
Domestic
Seats to Suit International Short-haul
Seats to Suit
49…and we will be looking to roll out a new long-haul
economy product, offering additional comfort
New long-haul product will offer:
• More leg room
• Front of Economy cabin
• Additional AirpointsTM earned
Seat pitch • Differentiated seat set-up and soft product
Leg room
50Premium cabins have grown in popularity across
our long-haul network
Revenue as a proportion of
International long-haul revenue
Business PremierTM 26% 29%
Premium Economy 14%
16%
Economy 60%
55%
2013
2013 2018
2018
51Maximising experiences of premium travel that
customers will value is key to future cabin planning
• Continuous innovation in cabin
experience
• Applicable across various markets
• Consideration of interplay
between hard and soft product
• Focus on personalisation
elements
52Our unique AirpointsTM loyalty programme is simple,
transparent and strongly valued by New Zealanders
Simple loyalty currency Most aspirational loyalty A loyalty programme that is
with no restrictions programme in New Zealand truly valued by members
• Low expiry rate indicates
• 1 Airpoints DollarTM = $1 • At least one person per engaged membership
• No blackout periods New Zealand household is • 920K flights purchased in 2018
an AirpointsTM member* using Airpoints DollarsTM
*As at 30 April 2019. Calculation based on Stats NZ household data.
53Our partner relationships help drive a loyalty
ecosystem that adds further value
Airpoints DollarsTM issuance from
65+ ground partners our financial partners
~130%
Food Fuel Financial
Services
Utilities Real Shopping
Estate 2013 2014 2015 2016 2017 2018 2019E
54Clear linkage between our high value loyalty
members and increased premium cabin bookings
Long-haul premium cabin revenue bookings
Business Premier Premium Economy
10% 11%
21% 26% 7% 9%
9%
9% 14%
8% 11%
12% 33%
19% 29%
11%
43% 40% 41% 37%
2015 2018 2015 2018
Elite Gold Silver Jade Non-member
55Focused on driving continued high growth in
ancillary product demand
What is included in our definition
of Direct Ancillary?
• Seat Select
• OneUpTM
Direct ancillary
• SkyCouchTM revenue has
grown
• Unaccompanied Minor ~3x
• Excess Baggage
2013 2014 2015 2016 2017 2018
56We are in the early stages of applying machine
learning to further optimise revenue management
Several weaknesses with traditional When used with existing systems,
revenue management systems machine learning can improve our results
• Reliance on historical booking Improve the demand forecast by
data to predict future demand considering significant metadata
Inventory settings re-optimised in near
• Inventory re-optimisation does not
real-time; enables rapid response to
occur in real-time
demand changes
• Seat inventory is optimised Ability to manage the complete customer
independently of ancillary offer, including ancillary recommendations
products
57Operational
Carrie Hurihanganui
excellence Chief Ground Operations Officer
58Our approach to cost control has helped drive strong
Jeremy – Can you please design
Network growth principles can be illustrated by this chart so it takes up the
CASK performance in recent years majority of the slide? I would
our preliminary 2020 capacity plan also like to have a background
image for the whole slide that
is blurred, perhaps showing
aircraft on runway?
NOTE - If that looks too messy,
then just go with plain chart.
59Looking ahead we are targeting flat to improving CASK
performance over the next three years
Indicative CASK trend
Targeting flat to low single digit
nominal CASK improvement
60Cross-functional initiatives in place to improve
efficiencies across the business
Strategic supply chain
Next generation engines
(A320/1NEOs)
Fuel burn optimisation
61Our supply chain is multi-tiered and complex, with
the ability to generate further efficiencies
~$1.3 billion ~4,200 suppliers across all facets of our operation
in annual addressable spend1
41% 59%
New Zealand Global based
based
1 Spend excluding labour, fuel, aircraft, air navigation, landing and government agency charges.
62Strategic supply chain partnerships can help
mitigate risk, step change the way we do business
and add value
Creation of Supply Chain Centre of
Excellence
Alignment of the value chain
activities across the organisation
Increasing trend of suppliers
helping to drive innovation
Using our vendor relationships to
drive sustainability and traceability
from source
63Fuel efficiencies should continue to improve as a
result of investment in modern fleet and
optimisation tools
Fuel efficiency - ASKs/barrel
Future fuel efficiency driven by:
~13% improvement • Additional NEO aircraft
4.86 4.87
4.90
4.94
• System advances to
optimise flight planning
4.67
4.57
• Weight reduction initiatives
4.55
4.51
4.38
4.43 • Increased ground power
usage
2010 2011 2012 2013 2014 2015 2016 2017 2018 2019E
64Continued economies of scale expected from
long-haul flying and overhead reductions
Balancing network growth while maintaining control on overhead costs
Network capacity (ASKs) Actual overhead costs vs. inflation-adjusted overhead costs
~30% growth
Resulting in a
~25%
Resulting in a
reduction
~25%
in overhead
reduction
costs/ASK
in overhead
costs/ASK
2015 2016 2017 2018 2019E 2015 2016 2017 2018 2019E
Actual overhead costs Inflation-adjusted overheads
65Working on several key initiatives to
improve productivity
Mobility tools
Automation
Organisational structure
66Example: Digitising service
Moving from situations that
require manual processes and
human intervention…
67Example: Digitising service
Future
state
…to empowering our
customers to resolve
issues with
personalised channels
68Example: Phased mobility strategy for operations
Empowering our people to better serve our customers using
digital tools and data
2020 2021 2022
Developing mobile front-end Mobility tools rolled out to Front-end digital solution
digital platforms to operational wider Airports workforce to allows operational staff to
areas and providing real-time provide consistency across meet customer needs
flight and passenger all channels, helping to seamlessly (e.g. wearables,
information deliver world-class customer mobile printing)
and employee experience
69Culture is critical to delivering sustainable cost improvement
70Financial
Jeff McDowall
priorities Chief Financial Officer
71We have a capital management framework that is focused on
financial resilience and sustainable shareholder value
Ensure long term resilience Invest wisely Return excess cash*
• Stable investment grade • Disciplined spending on • Commitment to consistently
rating capex to support growth pay a sustainable ordinary
• Diverse and attractive - Aircraft ownership dividend
sources of funding decisions • Excess cash to be returned
• Ensuring the right level of - Non-aircraft investment to shareholders via:
liquidity • Pre-tax ROIC target of 15% - Share buy back
• Hedging our financial risks - Special dividend
* Subject to maintaining financial resilience targets
72Our strong and resilient balance sheet provides the foundation
for a stable investment grade credit rating…
Target gearing range of 45% to 55% Investment grade credit rating*
52.4% 51.8% 52.4% 56.4%
48.6%
Adjusted gross debt 2.0x to 3.3x
to EBITDA target range
* Bloomberg data as at 1 May 2019.
73…and we have a diverse and flexible debt portfolio with very
attractive funding costs
Debt funding profile Average cost of on balance sheet debt Increase largely
5%
driven by a ~40%
increase in average
USD base rate1
4%
Operating lease @ Secured
7x* debt
33% 37%
3%
As at
1H 2019 2%
1%
Unsecured debt Finance
1% leases
29% 0%
2015 2016 2017 2018 2019E
Financial year
* Aircraft operating lease commitments for the next 12 months multiplied by a factor of 7. Excluding short-term leases which provide cover for the 787-9 engine issues.
1 Bloomberg data as at 16 May 2019; USD 6M LIBOR rate year on year movement between 2018 and May 2019.
74Looking to the near term we expect cash levels will remain at
the upper end of our liquidity range
• As communicated last year, we have updated our
liquidity range to target $700 million to $1 billion
cash
− Now transitioning to this target range
− Primary mechanism by which we are moving
towards this target has been via aircraft
purchases
− Balancing the level of cash purchases of fleet
with the current attractive financing rates
− No impact to gearing or net debt levels
− Our fleet financing model provides us with
greater flexibility from a liquidity perspective
75We continue to mitigate some volatility in jet fuel pricing with
our hedge portfolio
Fuel hedge position*
(hedged volume as a proportion of estimated consumption)
• Our hedging policy continues to focus on
80%
providing our business with time to adjust
69%
• In 2019 we also added Singapore Jet
~50%
42%
Collars and Jet-Brent crack spreads into
our hedging portfolio
• Currently 2020 is ~50% hedged
FY20 Q1 FY20 Q2 FY20 Q3 FY20
Jul-Sept Oct-Dec Jan-Mar
* Per fuel hedge position at 17 May 2019.
76We see a substantial reduction in aircraft capex from 2020 to
2022 compared to recent years
Aircraft capex outlook*
1,000
Actual Forecast
800
600
$ millions
400
200
0
2015 2016 2017 2018 2019** 2020 2021 2022
Financial year
* Per 28 March 2019 disclosure to NZX and ASX; assumes NZD/USD = 0.67, includes progress payments on aircraft. Does not include widebody replacement aircraft.
** Based on estimate of 2019 aircraft capital expenditure.
77Our selection of the 787-10 aircraft to replace our existing
777-200 fleet will have strong economic benefits…
Fuel burn comparison: 787-10 vs 777-200
• Eight 787-10 aircraft, powered by GE
engines 777-200
• Options to purchase additional aircraft
and substitution rights provide flexibility
Fuel /
~25%
improvement
• Highly fuel-efficient aircraft - has the Pax
in fuel burn
potential to save 190,000 tonnes of compared to
777-200
carbon each year
787-10
• Lower fuel burn drives substantial Better
improvement in operating economics and
emissions compared to 777-200
Better
Fuel / Departure
78…and the phasing of this aircraft programme will result in lower
annual aircraft capex levels
787-10 programme capex outlook*
~50%
lower average
spend
Expected aircraft delivery:
* Capital expenditure outlook only represents 787-10 programme.
79We measure success using ROIC as one of our key metrics
How we discuss success with our
people and external stakeholders
Excellent return
~15%
Return that exceeds our
pre-tax cost of capital
~10%
Sub-optimal return
80We remain committed to consistently paying a sustainable level
of ordinary dividend…
What do we mean by “consistently
pay” and “sustainable”? $2.2 billion in declared
dividends over 14 years
Consistently pay The Board seeks to distribute
part of the profits in the form
of an ordinary dividend each
year to shareholders
Sustainable The amount of the ordinary
dividend in a given period,
with the Board’s intent that the
ordinary dividend represents Ordinary dividend Special dividend
the medium-term financial
outlook for earnings, gearing
and capex
81…while keeping financial resilience and shareholder returns at
the forefront of our minds
Ensure long term resilience Invest wisely Return excess cash*
• Stable investment grade • Disciplined spending on • Commitment to consistently
rating capex to support growth pay a sustainable ordinary
• Diverse and attractive - Aircraft ownership dividend
sources of funding decisions • Excess cash to be returned
• Ensuring the right level of - Non-aircraft investment to shareholders via:
liquidity • Pre-tax ROIC target of 15% - Share buy back
• Hedging our financial risks - Special dividend
* Subject to maintaining financial resilience targets
82Key messages you should take away from today
• We are resilient and adaptable, with the ability
to respond quickly to changing macro
conditions
• We have a clear strategy in place to drive
sustainable cost improvement, earnings
growth and improved ROIC in the lower
demand environment
• We are committed to continued investment in our
exceptional culture, to delivering a superior customer
experience and to making strong commercial returns
• We are targeting strong free cash flow generation over the
next three years
83We have the right business model and competitive
advantages to sustain long-term commercial success
8485
Questions
            86
Appendix
87Speaker biographies
Christopher Luxon Chief Executive Officer
Christopher has been Chief Executive Officer since 2013 and under his leadership the airline has
delivered record profits, all time high customer satisfaction scores and achieved its highest levels of
staff engagement. Prior to joining Air New Zealand, Christopher was President and Chief Executive
Officer at Unilever Canada. This was one of several senior leadership roles he held during an 18-
year career at the multinational that saw him work in roles in Europe, North America and Asia/Pacific.
Christopher also serves as Chairman of New Zealand Prime Minister Jacinda Ardern's Business
Advisory Council.
Nick Judd Chief Strategy, Networks & Alliances Officer Carrie Hurihanganui Chief Ground Operations Officer
Nick was appointed as the Chief Strategy, Networks and Alliances Officer in October 2017 and leads Carrie was appointed as Chief Ground Operations Officer in 2018. Carrie is responsible for our
Air New Zealand’s Joint Venture Alliance partnerships, the Star Alliance relationship and the Airports, Engineering & Maintenance and Business Performance team and has deep strategic and
Sustainability and Transformation portfolios. Nick has worked across a number of functions and operational experience through her 18 years at Air New Zealand in numerous senior roles, including
regions in the business holding senior roles in Loyalty, Sales and Commercial areas across General Manager Eagle Air, General Manager Offshore Airports, General Manager Customer
Australia, China, America and New Zealand. Prior to joining Air New Zealand in 2003, Nick spent Experience and Group General Manager Regional Airlines & Airline Operations.
time in the United Kingdom and Canada in finance roles within the banking and media industries.
Cam Wallace Chief Revenue Officer Jeff McDowall Chief Financial Officer
Cam was appointed as Chief Revenue Officer in January 2014 and is responsible for generating Jeff joined Air New Zealand in 2000 and was appointed Chief Financial Officer in January 2018.
Air New Zealand’s passenger and cargo revenue, currently a portfolio with a turnover of over $5 billion. Prior to this position he held a range of senior commercial and finance roles within Air New Zealand
His responsibilities include revenue management, global pricing, online sales, Grabaseat™, retail including Group General Manager Corporate Finance and Group General Manager Commercial.
marketing, corporate, distribution, government sales and contact centres. Cam joined Air New Zealand Prior to joining Air New Zealand, Jeff spent six years as a management consultant in New Zealand,
in 2001 and has held a number of senior positions in the airline. Singapore and the United States.
88Glossary of key terms
Available Seat Kilometres (ASKs) Number of seats operated multiplied by the distance flown (capacity)
Cost/ASK (CASK) Operating expenses divided by the total ASK for the period
Gearing Net Debt / (Net Debt + Equity); Net Debt includes capitalised aircraft operating leases
Interest-bearing liabilities, less bank and short-term deposits, net open derivatives held in relation to interest-
bearing liabilities and interest-bearing assets, plus net aircraft operating lease commitments for the next twelve
Net Debt
months multiplied by a factor of seven (excluding short-term leases which provide cover for Boeing 787-9 engine
issues)
Dividend yield Dividend expressed as a percentage of the share price at a specific point in time or over a specific period
Passenger Revenue/ASK (RASK) Passenger revenue for the period divided by the total ASK for the period
Pre-Tax Return on Invested Capital Earnings Before Interest and Taxation (EBIT), and aircraft lease expense divided by three, all divided by the
(ROIC) average Capital Employed (being Net Debt plus Equity) over the period
The movement in share price, and assuming that all dividends are reinvested in shares on the ex-dividend date
Total Shareholder Return (TSR)
throughout the period
The following non-GAAP measures are not audited: CASK, Gearing, Net Debt, RASK, ROIC and TSR. Amounts used within the calculations are derived
where possible from the audited 2018 Group financial statements and the Five Year Statistical Review contained in the 2018 Annual Financial Results. The
non-GAAP measures are used by management and the Board of Directors to assess the underlying financial performance of the Group in order to make
decisions around the allocation of resources.
89Where to find more information about
Air New Zealand
Resources
Investor website: www.airnewzealand.co.nz/investor-centre
Monthly traffic updates: www.airnewzealand.co.nz/monthly-operating-data
Quarterly fuel hedging disclosure: www.airnewzealand.co.nz/fuel-hedging-announcements
Corporate governance: www.airnewzealand.co.nz/corporate-governance
Sustainability: https://www.airnewzealand.co.nz/sustainability
Contact information
Email: investor@airnz.co.nz
Share registrar: enquiries@linkmarketservices.com
90 9091 91
You can also read