Overstrand Municipality 2017 - Western Cape Government
←
→
Page content transcription
If your browser does not render page correctly, please read the page content below
Overstrand Municipality
2017
OVERSTRAND: AT A GLANCE

1.   DEMOGRAPHICS                  1

2.   EDUCATION                     3

3.   HEALTH                        7

4.   POVERTY                      12

5.   BASIC SERVICE DELIVERY       15

6.   SAFETY AND SECURITY          19

7.   THE ECONOMY                  24

8.   INFRASTRUCTURE DEVELOPMENT   28

SOURCES                           33

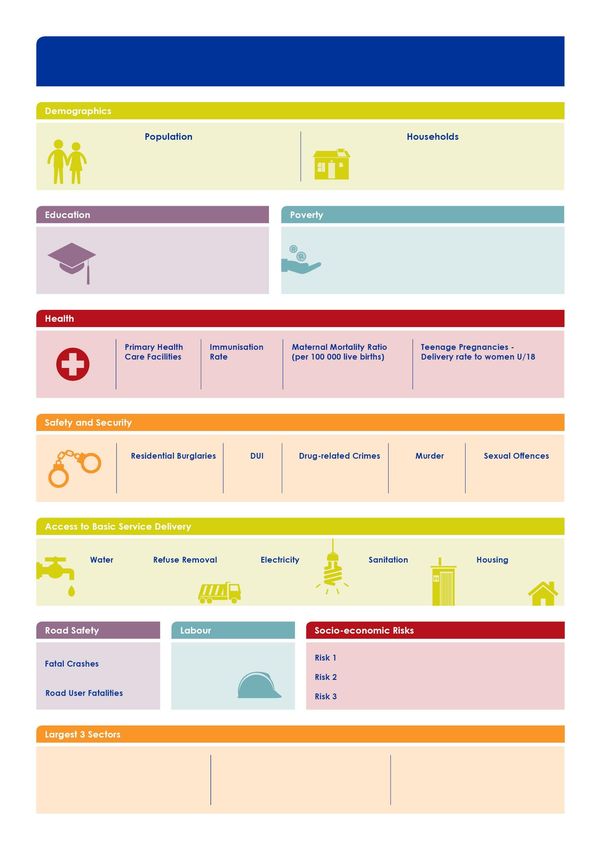
Overstrand: At a Glance

                                                                     Population Estimates, 2018; Actual households, 2016

                91 190                                                            35 739
                                          2016

           Matric Pass Rate          90.9%                     Gini Coefficient                               0.62
           Learner-Teacher Ratio      37.6
                                                               Human Development Index                        0.74
           Gr 12 Drop-out Rate       40.6%

                                                                                                                   2016

                     5               80.5%                       0.2                             4.7
                                                                                                  %
                                      Percentage change between 2016 and 2017 in number of reported cases per 100 000

                      15.0%              3.5%              21.3%                   -9.8%                9.1%

                                                            Percentage of households with access to basic services, 2016

    99.1%               94.0%                     96.9%                   99.2%                    79.1%

                 2016                             2016

                                                                   Drought
                 8            Unemployment Rate

                                                                   Stagnating Economic Growth

                 8            19.0%                                Stagnating Economic Growth

                                                                                               Contribution to GDP, 2015

Finance, insurance, real estate             Wholesale and retail trade,
                                                                                            Manufacturing
    and business services                  catering and accommodation

     24.1%                                        19.6%                                    14.5%
1
                            DEMOGRAPHICS

    This first chapter of the SEP focusses on the people living in Overstrand itself. A demographic
    perspective on a municipality allows to observe not only simple changes in population growth,
    but also to look at other various developments that influence the social life of every citizen.
    Demographics allow to emphasise aspects of society like, e.g. gender, race, migration or life
    expectancy. Decisions made by politicians as well as by the administration affect in almost
    every case at least one aspect of Demographics. Therefore, a good understanding of this area
    is crucial for the government’s work.

    The overview of key demographic factors given in this chapter comprises of the estimates of
    population size, the distribution of population within age cohorts and furthermore the
    dependency ratio, which is of high importance for understanding economic activity in the
    area as well as for planning welfare systems. With this short, but informative overview, the SEP
    tries to help the municipalities in their budgeting process by delivering precise data as a solid
    foundation for future decisions.

    Data source: Department of Social Development, 2017

1   2017 Socio-economic Profile: Overstrand Municipality
POPULATION
     140 000
     120 000
     100 000
      80 000
      60 000
      40 000
      20 000
             0
                  Cape Agulhas           Overstrand           Swellendam          Theewaterskloof
         2018         35 331               91 190               38 700                119 052
         2019         35 637               92 624               39 078                120 413
         2020         35 934               94 028               39 449                121 739
         2021         36 223               95 401               39 813                123 029
         2022         36 503               96 746               40 168                124 284
         2023         36 773               98 065               40 518                125 505

    In 2018 this Municipality will have an estimated population of 91 190, after five years this
    population is estimated to be 98 065. This equates to an estimated growth of 7.5 per cent over
    this time period.

    AGE COHORTS
                    Children:              Working Age:              Aged:           Dependency
      Year
                   0 – 14 Years            15 – 65 Years              65 +              Ratio
      2011            17 273                   52 803                10 357                52.3

      2018            20 410                   58 253                12 527                56.5

      2023            21 466                   63 234                13 365                55.1

    The above table depicts the population composition regarding age cohorts. The total
    population is broken down into three different groups: Age 0 - 14: children; Age 15 - 65: working
    age population; Age 65+: seniors. This is an important factor in the calculation of the
    dependency ratio. In Overstrand, this ratio was 52.3 in 2011 and will increase to an estimated
    55.1 in 2023. This ratio expresses the dependency of people who are part of the workforce
    (age 15 - 65) and those, who are depending on them (children and seniors). A higher
    dependency ratio means a higher pressure on social systems and the delivery of basic services.

2   2017 Socio-economic Profile: Overstrand Municipality
2
                                   EDUCATION

    Education and training improves access to employment opportunities and helps to sustain and
    accelerate overall development. It expands the range of options available from which a
    person can choose to create opportunities for a fulfilling life. Through indirect positive effects
    on health and life expectancy, the level of education of a population also influences its
    welfare.

    Data source: Western Cape Education Department, 2017

3   2017 Socio-economic Profile: Overstrand Municipality
LEARNER ENROLMENT
       20 000
       18 000
       16 000
       14 000
       12 000
       10 000
        8 000
        6 000
        4 000
        2 000
           0
                   Overstrand             Swellendam          Theewaterskloof       Cape Agulhas
         2014        11 118                  5 652                18 245                4 527
         2015        11 436                  5 685                18 815                4 565
         2016        11 696                  5 724                18 815                4 606

    Learner enrolment in Overstrand increased at an annual average growth rate of 5.1 between
    2014 and 2016, which is an indication that access to education has improved within the
    Overstrand municipal area.

    LEARNER-TEACHER RATIO
                              The learner–teacher ratio in Overstrand increased from 31.4 in 2014 to
                              38.5 in 2015 and decreases marginally to 37.6 in 2016. Factors
                              influencing the learner-teacher ratio is the ability of schools to employ
                              more educators when needed and the ability to collect fees.

    GRADE 12 DROP-OUT RATES
    A total of 40.6 per cent of students that enrolled in Grade 10 in 2014 dropped out of school by
    the time they reached Grade 12 in 2016. This number is significantly higher than the 32.5
    recorded in 2015. These high levels of drop-outs are influenced by a wide array of economic
    factors including unemployment, poverty, indigent households, high levels of households with
    no income or rely on less than R515 a month and teenage pregnancies.

4   2017 Socio-economic Profile: Overstrand Municipality
EDUCATIONAL FACILITIES
    The availability of adequate education facilities such as schools, FET colleges and schools
    equipped with libraries and media centres could affect academic outcomes positively.

          18

          16

          14

          12

          10

           8

           6

           4

           2

           0
                     Number of Schools with Libraries                          Total Number of Schools
         2014                      13                                                    17
         2015                      12                                                    17
         2016                      12                                                    17

    Overstrand had 17 schools in 2016. The number of schools equipped with libraries remained at
    12 between 2015 and 2016. Given the tough economic climate, schools have been reporting
    an increase in parents being unable to pay their school fees.

     100,0%
      90,0%
      80,0%
      70,0%
      60,0%
      50,0%
      40,0%
      30,0%
      20,0%
      10,0%
       0,0%
                                                Proportion of no-fee schools
        2014                                               70,6%
        2015                                               70,6%
        2016                                               70,6%

    This chart displays the proportion of no-fee schools within Overstrand municipal area. The
    proportion of no-fee schools within Overstrand municipal area remained unchanged at
    70.6 per cent between 2014 and 2016.

5   2017 Socio-economic Profile: Overstrand Municipality
EDUCATION OUTCOMES
                                Education remains one of the key avenues through which the state
                                is involved in the economy. In preparing individuals for future
                                engagements in the broader market, policy decisions and choices in
                                the sphere of education play a critical role in determining the extent
                                to which future economy and poverty reduction plans can be
                                realised.

     100,00%
      98,00%
      96,00%
      94,00%
      92,00%
      90,00%
      88,00%
      86,00%
      84,00%
      82,00%
      80,00%
                   Overstrand             Swellendam          Theewaterskloof       Cape Agulhas
         2014        86,40%                 88,20%                88,80%               87,80%
         2015        88,20%                 94,90%                88,00%               94,00%
         2016        90,90%                 92,70%                92,40%               97,30%

    Overstrand matric pass rate remained steady above 86.4 per cent between 2014 and 2015
    and increased to 90.9 per cent in 2016, which could improve access for learners to higher
    education to broaden their opportunities. However, the matric pass rate within the Overstrand
    area remain below that of the other regions in the Overberg District in 2016.

6   2017 Socio-economic Profile: Overstrand Municipality
3
                                          HEALTH

    Health is another major factor contributing to the general quality of life within Overstrand. It is
    therefore important to monitor the public health facilities as well as a variety of factors such as
    diseases like HIV or TB and general topics that affect the community, like maternal health. This
    Socio-economic Profile provides the basic statistics concerning those issues. Since this profile
    focusses on the public health facilities, private facilities do not appear in it.

    Data source: Department of Health, 2017

7   2017 Socio-economic Profile: Overstrand Municipality
HEALTHCARE FACILITIES
All citizens’ right to access to healthcare services are directly affected by the number and
spread of facilities within their geographical reach. South Africa’s healthcare system is geared
in such a way that people have to move from primary, with a referral system, to secondary
and tertiary levels.
14
12
10
8
6
4
2
0
Total number
Number of
Number of Number of TB of PHC
Number of PHC Clinic - Number of
Community ART clinics/ clinics/ facilities
district non-fixed PHC Clinics -
Day Centres treatment treatment (Fixed Clinics,
hospitals (mobiles/satel Fixed
sites sites CHCs and
ite)
CDCs)
2014 1 4 1 5 7 13 8
2015 1 4 1 5 4 10 5
2016 1 5 1 5 4 9 5
In 2016, Overstrand had a total number of 5 primary healthcare facilities – 4 fixed PHC clinics
as well as 1 community day centres. In addition, there are 5 ART and 9 TB treatment sites as
well as one district hospital within the municipal area. There were 5 non-fixed clinics within
Overstrand in 2016.
EMERGENCY MEDICAL SERVICES
Access to emergency medical services is critical for rural citizens
due to rural distances between towns and health facilities being
much greater than in the urban areas. Combined with the
relatively lower population per square kilometre in rural areas,
ambulance coverage is greater in rural areas in order to
maintain adequate coverage for rural communities.
A bigger number of operational ambulances can provide a
greater coverage of emergency medical services. Overstrand
with 0.3 ambulances per 10 000 inhabitants in 2016, is
considerably less than the 0.6 ambulances per 10 000 of the
Overberg District.
8 2017 Socio-economic Profile: Overstrand MunicipalityHIV/AIDS
HIV/AIDS management is crucial given its implications for
the labour force and the demand for healthcare services.
Registered patients Number of new ART
HIV Transmission Rate
receiving ART patients
Area
2014 2015 2016 2014 2015 2016 2014 2015 2016
Overstrand 2 948 3 583 4 245 599 781 658 2.1 0.4 0
Overberg District 7 233 8 703 10 397 1 451 1 983 1 767 1.3 0.6 0
Overstrand is seeing a steady rise in patients receiving antiretroviral treatment (ART) over the
past three years. Patients receiving antiretroviral treatment increased by 1 297 between 2014
and 2016. For the 4 245 patients receiving antiretroviral treatment, as shown earlier in this
chapter, are treated in nine clinics or treatment sites. A total of 10 397 registered patients
received antiretroviral treatment in Overberg District in 2016. Overstrand at 4 245 patients
represent 40.8 per cent of the patients receiving ART in Overberg District. The number of new
antiretroviral patients increases from 599 in 2014 to 658 in 2016. HIV transmission rate for the
Overstrand municipal area shows an improvement from 2.1 in 2014 to 0.0 in 2016.
TUBERCULOSIS
700
638
600 579
493
500
400 2014
300 2015
200 2016
100
0
Number of TB patients
Overstrand experiences a decline in tuberculosis (TB) cases between 2015 and 2016. In 2016
the Municipality of Overstrand provides for 1 767 TB patients.
9 2017 Socio-economic Profile: Overstrand MunicipalityCHILD HEALTH
Health Indicator Overstrand Overberg District
Immunisation 80.5 71.5
Malnutrition 0.3 1.6
Neonatal mortality rate 6.3 6.3
Low birth weight 10.9% 11.8%
The Department of Health strongly advises mothers to protect their children from infectious
diseases by getting them vaccinated from birth to when they are 12 years old. Vaccination is
free of charge at all health facilities. The Department also runs immunisation campaigns and
health workers are sent to nursery schools and crèches to immunise the children. The
immunisation rate in the Overstrand municipal area remains above 80.0 per cent between
2014 and 2016.
Overstrand’s malnutrition rate improved from 1.9 in 2014 to 0.3 in 2016 per 1 000 population
under 5 years.
The neonatal mortality rate (NMR) in the Overstrand municipal area has shown a notable
improvement from 10.8 per 1 000 live births in 2014 to 6.3 per 1 000 live births in 2015 and has
registered improvement in 2016.
In the Overstrand area, 10.9 per cent of the babies born in the facilities were born with low
birth weight.
DEFINITIONS
Immunisation: The immunisation rate is calculated as the number of children immunised as
a percentage of the total number of children less than one year of age. Immunisation
protects both adults and children against preventable infectious diseases. Low immunisation
rates speak to the need for parents to understand the critical importance of immunisation,
as well as the need to encourage parents to have their young children immunised.
Malnutrition: Expressed as the number of malnourished children under five years per
100 000 people. Malnutrition (either under- or over-nutrition) refers to the condition whereby
an individual does not receive adequate amounts or receives excessive amounts of
nutrients.
Neonatal mortality rate: Measured as the number of neonates dying before reaching
28 days of age, per 1 000 live births in a given year. The first 28 days of life (neonatal period)
represent the most vulnerable time for a child’s survival. The Province’s target for 2019 is
6.0 per 1 000 live births.
Low birth weight: Percentage of all babies born in facility that weighed less than 2 500 g. Low
birth weight is associated with a range of both short- and long-term consequences.
10 2017 Socio-economic Profile: Overstrand MunicipalityMATERNAL HEALTH
Health Indicator Overstrand Overberg District
Maternal Mortality Ratio 0.2 0.1
Delivery Rate to Women
4.7 7.8
under 18 years
Termination of Pregnancy
0.8 0.5
Rate
Maternal mortality rate: A positive development can be observed in the Overstrand which
remains at 0.2 in 2016. Maternal mortality rate is measured as Maternal death in the facility
divided by the number of live births in that facility.
Births to teenage mothers: An improvement is observed in the delivery rate to women under
18 years, which is declining from 2014. A total of 4.7 per cent of the babies delivered in facilities
in 2017 were delivered to women under the age of 18.
Termination of pregnancy rate: The termination of pregnancy rate remains at 0.8 per cent
between 2014 and 2016.
DEFINITIONS
Maternal health refers to the health of women during pregnancy, childbirth and the
postpartum period.
Maternal mortality rate: Maternal deaths per 100 000 live births in health facilities. Maternal
death is death occurring during pregnancy, childbirth and the puerperium of a woman
while pregnant or within 42 days of termination of pregnancy, irrespective of the duration
and site of pregnancy and irrespective of the cause of death (obstetric and non-obstetric).
Births to teenage mothers: Percentage of babies born to mothers under the age of 18 years.
Teenage pregnancy is almost always unplanned; as a result, when young parents are
placed in a position to care for their children, life can become particularly tough, especially
if they do not have family or social support.
Termination of pregnancy: The percentage of terminations as a proportion of the female
population aged 15 to 44 years. Government hospitals, designated private doctors and
gynaecologists, and non-profit providers offer safe and legal termination of pregnancy. To
have a free abortion, the request must be made at a primary healthcare clinic, where the
pregnancy will be confirmed, counselling provided, an appointment made, and a referral
letter be given to a facility where the procedure can be performed.
11 2017 Socio-economic Profile: Overstrand Municipality4
POVERTY
This section shows living conditions and economic circumstances of households in the
Overstrand municipal area based on most recent data including Statistics South Africa’s
Non-Financial Census of Municipalities 2016 and Quantec. Economic theory suggests that
when an economy prospers its households are expected to enjoy a good standard of living.
On the contrary, a declining economy tends to lower the standards of living of people. This
section uses indicators in terms of GDP per capita, income inequality, human development,
as well as indigent households and free basic services to show the current reality of households
residing in the Overstrand municipal area.
The deteriorating financial health of households and individuals under the weight of economic
pressures, specifically between 2011 and 2015, has resulted in an increase in the poverty levels,
according to the Poverty Trends in South Africa report released by Statistics South Africa in
2017. The report cites rising unemployment levels, low commodity prices, higher consumer
prices, lower investment levels, household dependency on credit, and policy uncertainty as
the key contributors to the economic decline in recent times. These recent findings indicate
that the country will have to reduce poverty at a faster rate than previously planned.
According to the report the categories of people vulnerable to poverty remained to be
African females, children 17 years and younger, people from rural areas, and those with no
education. Inflation-adjusted poverty lines show that food poverty increased from R219 in 2006
to R531 per person per month in 2017. The lower-bound poverty line has increased from R370
in 2006 to R758 per person per month in 2017 while the upper-bound poverty line has increased
from R575 in 2006 to R1 138 per person per month in 2017.
12 2017 Socio-economic Profile: Overstrand MunicipalityGDPR PER CAPITA
An increase in real GDPR per capita, i.e. GDPR per person, is experienced only if the real
economic growth rate exceeds the population growth rate. Even though real GDP per capita
reflects changes in the overall well-being of the population, not everyone within an economy
will earn the same amount of money as estimated by the real GDPR per capita indicator.
70 000
60 000
50 000
GDPR per capita
40 000
30 000
20 000
10 000
0
2005 2006 2007 2008 2009 2010 2011 2012 2013 2014 2015 2016
Overstrand 44 683 45 772 47 675 48 298 47 106 47 397 47 676 47 663 47 679 47 659 47 205 46 713
Overberg 39 150 39 785 41 944 44 659 43 947 44 316 45 074 45 471 45 915 46 673 46 027 45 517
Western Cape 54 363 56 550 59 251 60 656 58 845 59 197 60 423 61 095 61 648 61 935 61 794 61 199
Source: Stats SA 2017, own calculations
At 46 713 in 2016, Overstrand’s real GDPR per capita is above the District average but below
that of the Western Cape.
INCOME INEQUALITY
The National Development Plan has set a target of reducing income inequality in South Africa
from a Gini coefficient of 0.7 in 2010 to 0.6 by 2030.
0,64
0,62
0,6
0,58
0,56
0,54
0,52
0,5
0,48
Theewaterskloof Overstrand Cape Agulhas Swellendam Overberg Western Cape
2010 2011 2012 2013 2014 2015 2016
Source: Global Insight, 2017
Income inequality has increased between 2010 and 2016 with the exception of 2015, when it
dropped below 0.62. Income inequality levels were higher in Overstrand than in the Overberg
District and the Western Cape.
13 2017 Socio-economic Profile: Overstrand MunicipalityHUMAN DEVELOPMENT
The United Nations uses the Human Development Index (HDI) 1 to assess the relative level of
socio-economic development in countries.
0,8
0,7
0,6
0,5
0,4
0,3
0,2
0,1
0
Theewaterskloof Overstrand Cape Agulhas Swellendam Overberg WC
2010 2011 2012 2013 2014 2015 2016
Source: Global Insight, 2017
There has been a general increase in the HDI in Overstrand and Overberg District and the
whole of the Western Cape between 2011 and 2016. Overstrand’s HDI was estimated to be
0.74 in 2016.
INDIGENT HOUSEHOLDS
The constraining macro-economic climate is expected to impact heavily on the various
municipal areas of the Western Cape, especially in rural communities where an economic
downturn will result in significant job losses across. Rising unemployment figures will
subsequently result in a decrease in expendable household income which, coupled with rising
inflation rates, will force many families into poverty. Municipal services will ultimately become
unaffordable, resulting in these households becoming reliant on free basic services which will
in turn strain the already limited resources of a municipality.
Area 2014 2015 2016
Overstrand 6 787 7 803 7 665
Overberg District 16 045 18 053 20 058
Western Cape 413 259 360 238 514 344
Source: Department of Local Government, 2017
The overall number of indigent households have increased in the Overberg District as well as
the Western Cape, implying an increased demand for indigent support and additional burden
on municipal financial resources.
1 The HDI is a composite indicator reflecting education levels, health, and income. It is a measure of peoples' ability
to live a long and healthy life, to communicate, participate in the community and to have sufficient means to be
able to afford a decent living. The HDI is represented by a number between 0 and 1, where 1 indicates a high
level of human development and 0 represents no human development.
14 2017 Socio-economic Profile: Overstrand Municipality5
BASIC SERVICE DELIVERY
The Constitution of the Republic of South Africa states that every citizen has the right to access
to adequate housing and that the state must take reasonable legislative and other measures
within its available resources to achieve the progressive realisation of this right. Access to
housing also includes access to services such as potable water, basic sanitation, safe energy
sources and refuse removal services, to ensure that households enjoy a decent standard of
living.
This section reflects on housing and basic services access levels (Census 2011) and the
incremental progress municipalities have made hereto within the last 5 years (Community
Survey 2016).
15 2017 Socio-economic Profile: Overstrand MunicipalityHOUSEHOLDS
In order to ensure basic service delivery to all, municipal
budget allocations should be informed by credible and
accurate assumptions regarding the number of households
within a municipal area.
Access to formal housing and services in Overstrand is
measured against a total number of households of 28 010 in
2011 and 35 739 in 2016. Overstrand experienced a higher
growth rate in the number of households from 2011 to 2016
relative to the Overberg District.
Average Average
Area 2011 2016 annual annual growth
increase 2011 - 2016
Overstrand 28 010 35 739 1 546 7 729
Overberg District 77 196 91 835 2 928 14 639
ACCESS TO HOUSING
SERVICE STANDARD DEFINITION: Households with access to a formal dwelling.
Average Average
Total
annual annual
Area 2011 2016 increase
increase growth
2011 - 2016
2011 - 2016 2011 - 2016
Overstrand 80.1% 79.1% 5 819 1 164 4.7%
Overberg District 81.9% 81.8% 11 853 2 371 3.5%
The number of formal dwellings in Overstrand increased by
5 819 between 2011 and 2016, at an average annual rate of
4.7 per cent, which translates into approximately
1 164 additional formal dwellings per year over this period. This
increase in formal dwellings was however unable to keep
pace with the growth in the total number of households,
resulting in the proportion of formal households declining
marginally from 80.1 per cent in 2011 to 79.1 per cent in 2016.
16 2017 Socio-economic Profile: Overstrand MunicipalityACCESS TO WATER
Given the Western Cape’s current drought situation, great focus is currently placed on water
availability, supply and quality. Access to safe potable water is essential to prevent the
contraction and spread of diseases and maintaining a healthy life.
SERVICE STANDARD DEFINITION: Households with access to piped water inside the dwelling
or yard or within 200 metres from the yard.
Average Average
Total
annual annual
Area 2011 2016 increase
increase growth
2011 - 2016
2011 – 2016 2011 - 2016
Overstrand 99.5% 99.1% 7 550 1 510 4.9%
Overberg District 99.2% 97.9% 13 296 2 659 3.3%
Although Overstrand experienced an annual increase of household access to piped water (to
within 200 metres of the yard) of approximately 7 550 households per annum between 2011
and 2016, the proportion of households with access declined marginally over this period from
99.5 per cent in 2011 to 99.1 per cent in 2016.
ACCESS TO SANITATION
Access to sanitation promotes health and dignity through the provision of safe disposal and
treatment of human waste. Where sanitation systems are inadequate, negative health effects
can be extremely serious. The current drought highlights challenges in the use of potable water
within the sanitation services process.
SERVICE STANDARD DEFINITION: Households with access to a flush or chemical toilet
connected to the sewerage system.
Average Average
Total
annual annual
Area 2011 2016 increase
increase growth
2011 - 2016
2011 – 2016 2011 - 2016
Overstrand 93.7% 99.2% 9 217 1 843 6.2%
Overberg District 89.7% 95.7% 18 636 3 727 4.9%
Overstrand experienced significant progress in household access to sanitation services, with
the proportion of households with access to acceptable standards of sanitation services
increasing from 93.7 per cent in 2011 to 99.2 per cent in 2016. The Municipality was able to
provide an additional 1 843 households with access annually; access growing at an average
annual rate of 6.2 per cent.
17 2017 Socio-economic Profile: Overstrand MunicipalityACCESS TO ELECTRICITY
Energy is essential for human life; generally identified household uses include energy for
cooking, heating and lighting. Energy sources also have usage risks; for example, health and
safety risks especially in the use of paraffin and open flame usage. The information below
relates to the use of electricity for lighting purposes.
SERVICE STANDARD DEFINITION: Households with access to electricity as the primary source
of lighting.
Average Average
Total
annual annual
Area 2011 2016 increase
increase growth
2011 - 2016
2011 - 2016 2011 - 2016
Overstrand 90.4% 96.9% 9 318 1 864 6.5%
Overberg District 91.2% 94.6% 16 508 3 302 4.3%
The annual growth in household access to electricity of 1 864 outstripped the total household
growth of approximately 1 546 on average per annum. This coincides with an increase in the
proportion of households with access to electricity, increasing from 90.4 per cent in 2011 to
96.9 per cent in 2016.
ACCESS TO REFUSE REMOVAL
Refuse removal is an essential service that ensures that health related problems are kept at
bay. A lack of or inadequate service is likely to result in illegal dumping. There are growing
concerns around the land and environmental limitations in the creation and lifespan of landfill
sites. This would benefit greatly from the ‘reduce – reuse – recycle’ approach, that encourages
non-wasteful consumption practices (reduce), the reuse of products where possible (reuse)
and the recycling of the product where its use in current form has been exhausted (recycle).
SERVICE STANDARD DEFINITION: Households who have solid waste removed by local
authorities at least weekly.
Average Average
Total
annual annual
Area 2011 2016 increase
increase growth
2011 – 2016
2011 - 2016 2011 - 2016
Overstrand 91.5% 94.0% 7 957 1 591 5.6%
Overberg District 83.2% 87.1% 15 715 3 143 4.5%
Household access to refuse removal services in Overstrand has increased from 91.5 per cent
in 2011 to 94.0 per cent in 2016. Household access to this service (additional 1 591 households
annually) is more or less on par the total household growth (1 546 per annum on average over
the period).
18 2017 Socio-economic Profile: Overstrand Municipality6
SAFETY AND SECURITY
The Constitution upholds the notion that everybody has the right to freedom and security of
the person. The safety of persons and property is therefore vitally important to the physical and
emotional well-being of people and business. Without the respect of person and property, it
would be impossible for people to live peacefully, without fear of attack and for businesses to
flourish.
The extent of crime in South Africa does however not only have a significant impact on the
livelihood of citizens, but also affects the general economy. Crime hampers growth and
discourages investment and capital accumulation. If not addressed with seriousness, it has the
potential to derail both social and economic prosperity.
People’s general impressions, as well as official statistics on safety and crime issues, mould
perceptions of areas as living spaces or place in which to establish businesses. The discussion
in this section that follows is limited to the reported contact and property-related crime such
as murder and sexual crimes, as well as crime heavily dependent on police action for
detecting drug-related crimes and driving under the influence of alcohol/drugs.
Note: Percentage change calculation will differ from the actuals reflected due to rounding
down to per 100 000 population.
Data source: The data depicted in the following section was sourced from the 2017 Crime
Statistics released by the South African Police Service (SAPS) in October 2017. Incidences of
crime per 100 000 were calculated using actual crime and estimated population figures
provided by SAPS. Also note that although the crime data contained in the following section
is for ease of reference depicted as a single calendar year, it is in actual fact referring to
criminal activity within a financial year i.e. incidences of murder for 2016 is referring to
occurrences within the period April 2016 to March 2017.
The information relating to fatal crashes and crash fatalities were sourced from the
Department of Transport and Public Works.
19 2017 Socio-economic Profile: Overstrand MunicipalityMURDER
Area 2016 2017 % Change
Overstrand
55 49 -9.8
(per 100 000)
Overberg District
35 38 9.0
(per 100 000)
Definition: Murder is a social contact crime resulting in the loss of life of the victim, but excludes
cases where the loss of life occurred as a result of a response to a crime, for example
self-defence.
Crime remains a prominent issue in South Africa at a high socio-economic cost. Overall, the
country has a very high rate of murder when compared to most countries.
Within the Overstrand area, the murder rate showed a decrease of 9.8 per cent from 55 in 2016
to 49 in 2017 (per 100 000 population), whereas the murder rate within the Overberg District
increased by 9.0 per cent from 35 in 2016 to 38 in 2017. The murder rate nevertheless remains
a grave concern throughout the Overberg District; especially in the Overstrand area where
the number of murder cases are substantially higher when compared to the rest of the District.
SEXUAL OFFENCES
Area 2016 2017 % Change
Overstrand
145 158 9.1
(per 100 000)
Overberg District
114 120 5.2
(per 100 000)
Definition: Sexual offences includes rape (updated to the new definition of rape to provide for
the inclusion of male rape), sex work, pornography, public indecency and human trafficking.
The rate of sexual violence in South Africa is amongst the highest in the world. In addition, a
number of sexual offence incidences often go unreported (as in the case of rape).
The cases of sexual offences in the Overstrand area increased by 9.1 per cent from 145 in
2016 to 158 in 2017 (per 100 000 population), whereas, the cases of sexual offences in the
Overberg District area overall increased by 5.2 per cent from 114 in 2016 to 120 in 2017
(per 100 000 population).
20 2017 Socio-economic Profile: Overstrand MunicipalityDRUG-RELATED CRIMES
Area 2016 2017 % Change
Overstrand
1 515 1 838 21.3
(per 100 000)
Overberg District
1 534 1 689 10.1
(per 100 000)
Definition: Drug-related crimes refers to the situation where the perpetrator is found to be in
possession of, under the influence of, or selling illegal drugs. This is a crime detected through
police activity rather than reports by members of the public. An increase in crimes of this nature
may therefore reflect an increase in police.
Drug-related crimes have a negative impact on human development by degrading the
quality of life as it infiltrates all aspects of society including families, health, the work
environment and the economy. Drug-related crimes within the Overstrand area shows a sharp
increase towards 2017, up by 21.3 per cent from 1 515 cases in 2016 to 1 838 cases in 2017
(per 100 000 population). The Overberg Districts trend is also on an increasing trajectory, with
drug-related crimes increasing by 10.1 per cent from 1 534 in 2016 to 1 689 in 2017
(per 100 000 population).
DRIVING UNDER THE INFLUENCE
Area 2016 2017 % Change
Overstrand
265 275 3.5
(per 100 000)
Overberg District
196 207 5.5
(per 100 000)
Definition: DUI refers to a situation where the driver of a vehicle is found to be over the legal
blood alcohol limit. This is a crime detected through police activity rather than reports by
members of the public.
Despite concerted efforts by government our roads are still considered amongst the most
dangerous in the world. Reckless driving and alcohol consumption remain the top reason for
road accidents. The number of cases of driving under the influence of alcohol or drugs in the
Overstrand area show an increase of 3.5 per cent from 265 in 2017 to 275 in 2017
(per 100 000 population). In the Overberg District area, the number of cases increased by
5.5 per cent from 196 in 2016 to 207 in 2017 (per 100 000 population).
21 2017 Socio-economic Profile: Overstrand MunicipalityRESIDENTIAL BURGLARIES
Area 2016 2017 % Change
Overstrand
2 041 2 348 15.0
(per 100 000)
Overberg District
1 133 1 212 7.0
(per 100 000)
Definition: Residential burglary is defined as the unlawful entry of a residential structure with the
intent to commit a crime, usually a theft.
Given its regular occurrence and the psychological impact on victims, residential burglaries
are an obstinate concern in South Africa. Residential burglary cases within the Overstrand area
increased by 15.0 per cent from 2 041 in 2016 to 2 348 in 2017 (per 100 000 population).
Residential burglaries within the Overberg District shows an increase of 7.0 per cent from 1 133
in 2016 to 1 212 in 2017 (per 100 000 population). The number of cases of residential burglaries
crimes remain a serious concern throughout the Overberg District area, especially within
Overstrand as it experienced a significantly higher rate of residential burglaries than the District.
FATAL CRASHES
Area 2015 2016 % Change
Overstrand 4 8 100.0
Overberg District 58 65 12.1
Definition: A crash occurrence that caused immediate death to a road user, i.e. death upon
impact, flung from the wreckage, burnt to death, etc.
Above graphic indicates that in 2015 there were a total of 4 fatal crashes involving motor
vehicles, motorcycles, cyclists and pedestrians within the jurisdiction of the Overstrand
Municipality. This number increased by 100 per cent to 8 in 2016. The number of fatal crashes
in the broader Overberg District increased by 12.1 per cent from 58 crashes in 2015 to 65 in
2016.
22 2017 Socio-economic Profile: Overstrand MunicipalityROAD USER FATALITIES
Area 2015 2016 % Change
Overstrand 5 8 60.0
Overberg District 73 83 13.7
Definition: The type of road user that died in or during a crash i.e. driver, cyclist, passengers,
pedestrians.
According to a recent study, the majority of road fatalities in Africa fall within the working age
cohort - between the ages of 15 – 44 years – whilst three out of four fatalities were found to be
male (Peden et al., 2013). The untimely death of these primary breadwinners therefore impacts
directly upon not only the livelihood of family structures, but deprive society of active
economic participants that contribute towards growth and development. The
socio-economic impact of such road fatalities has proven to be particularly devastating in
South Africa where the majority of road users hail from poor and vulnerable communities.
The previous section specified that a total of 8 fatal crashes occurred within the Overstrand
region in 2016. Above table indicates that a total of 8 road users died in those crashes.
23 2017 Socio-economic Profile: Overstrand Municipality7
THE ECONOMY
Economic growth at the municipal level is essential for the attainment of economic
development, the reduction of poverty and improved accessibility. Fostering this growth
requires an in-depth understanding of the economic landscape within which each respective
municipality operates.
Most municipalities within the Western Cape are currently experiencing hydrological drought
conditions where the severe weather is affecting groundwater levels in natural springs, streams,
reservoirs and dams to the extent that potable water has reached alarmingly low levels. An
overview of the current economic reality facing the municipalities of the Western Cape would
therefore not be complete without elaborating on the manner in which the drought impacts
upon the short and medium term financial and economic sustainability of local authorities.
24 2017 Socio-economic Profile: Overstrand MunicipalityECONOMIC SECTOR PERFORMANCE
The economic sectors that contributed the most to the Overstrand area economy in 2015 were
the finance, insurance, real estate and business services (24.1 per cent), the wholesale and
retail trade, catering and accommodation sector (19.6 per cent), and the manufacturing
(14.5 per cent) sectors. These sectors have been growing at above average rates over the last
five years.
Overstrand GDPR performance per sector, 2005 – 2016
Contribution R million Trend Real GDPR growth (%)
to GDPR (%) value
Sector 2015 2015 2005 - 2015 2010 - 2015 2011 2012 2013 2014 2015 2016e
Primary Sector 6.0 322.2 1.5 1.9 2.2 0.9 2.9 5.4 -1.9 -5.7
Agriculture, forestry 5.9 315.2 1.5 1.9 2.2 0.9 2.9 5.4 -1.9 -5.7
and fishing
Mining and quarrying 0.1 7.0 -0.4 2.5 2.3 0.8 2.7 6.5 0.4 -6.5
Secondary Sector 24.4 1 313.0 3.3 1.9 1.6 2.1 2.9 2.0 1.1 0.4
Manufacturing 14.5 779.8 3.6 2.7 3.7 2.8 3.0 2.0 1.9 1.6
Electricity, gas and 2.0 109.8 2.0 1.6 4.7 1.8 0.4 0.5 0.7 -5.2
water
Construction 7.9 423.3 3.2 0.3 -3.6 0.5 3.1 2.3 -0.6 -1.2
Tertiary Sector 69.6 3 738.6 3.0 2.6 3.5 3.0 2.6 2.2 1.9 1.2
Wholesale and retail 19.6 1 051.3 3.5 3.4 4.8 4.4 2.9 2.4 2.4 1.6
trade, catering and
accommodation
Transport, storage 11.3 607.1 5.8 4.7 6.1 4.7 5.1 5.1 2.6 2.2
and communication
Finance, insurance, 24.1 1 297.6 2.2 1.6 1.8 1.6 1.4 1.1 2.1 0.9
real estate and
business services
General government 8.2 440.5 3.0 3.1 5.3 2.8 4.1 2.7 0.4 1.0
Community, social 6.4 342.0 2.1 1.7 1.6 2.4 1.8 2.1 0.6 0.5
and personal services
Total Overstrand 100 5 373.9 3.0 2.4 3.0 2.6 2.7 2.4 1.5 0.6
The agriculture, forestry and fishing sector has been contracting since 2015, with a contraction
of 1.9 per cent and a further contraction of 5.7 per cent in 2016, which can be attributed to
the severe drought which started in 2015. The electricity, gas and water sector and the
construction sector also contracted in 2016 by 5.2 per cent and 1.2 per cent respectively. The
slump in the construction sector can be attributed to a decrease in investment in the area or
a decline in the demand for residential and commercial property. Changes in water
consumption due to more conscientious water use from consumers in response to the drought
conditions, as well as electricity capacity constraints have contributed to the contraction in
the water, electricity and gas sector in 20162.
2 Overstrand Municipality MERO 2017 survey response.
25 2017 Socio-economic Profile: Overstrand MunicipalityOverall, growth in the Overstrand municipal area has been declining since 2013, with
decreasing to 0.6 per cent in 2016 which can be attributed to the contracting agriculture,
forestry and fishing sector and the general decline in growth in the main economic sectors
which are also affected by the agriculture, forestry and fishing sector as well as national
factors, such as rising national unemployment, high inflation, political instability and volatile
exchange rates that are weakening the South African economy.
LABOUR
Similar to the GDPR contribution, the economic sectors that contributed the most to
employment in the Overstrand area included the wholesale and retail trade, catering and
accommodation (28.2 per cent), the finance, insurance, real estate and business services
(15.0 per cent) and the community, social and personal services (13.5 per cent) sectors.
Overstrand employment growth per sector
Contribution to
employment Number Trend Employment (net change)
(%) of jobs
Sector 2015 2015 2005 - 2015 2010 - 2015 2011 2012 2013 2014 2015 2016e
Primary Sector 10.3 3 731 -723 818 -57 306 257 -139 451 -40
Agriculture, forestry 10.3 3 722 -719 821 -57 305 261 -139 451 -41
and fishing
Mining and 0.0 9 -4 -3 0 1 -4 0 0 1
quarrying
Secondary Sector 18.8 6 802 450 646 72 38 182 193 161 13
Manufacturing 8.5 3 073 169 204 30 -52 146 -6 86 6
Electricity, gas and 0.2 75 33 14 3 6 2 1 2 4
water
Construction 10.1 3 654 248 428 39 84 34 198 73 3
Tertiary Sector 70.8 25 554 8 664 4 655 701 806 1 100 926 1 122 -92
Wholesale and retail 28.2 10 163 3 424 1 767 344 382 303 348 390 -43
trade, catering and
accommodation
Transport, storage 6.2 2 247 1 256 660 54 145 190 31 240 -158
and communication
Finance, insurance, 15.0 5 405 1 611 882 137 94 181 144 326 51
real estate and
business services
General government 7.9 2 863 790 324 121 55 49 168 -69 53
Community, social 13.5 4 876 1 583 1 022 45 130 377 235 235 5
and personal
services
Total Overstrand 100 36 087 8 391 6 119 716 1 150 1 539 980 1 734 -119
Source: Quantec Research, 2017 (e denotes estimate)
The agriculture, forestry and fishing, the wholesale and retail trade, catering and
accommodation, and the transport sectors jointly shed 242 jobs in 2016. All the other economic
sectors are expected to gain jobs in 2016 although only marginally which is in line with the
decline in economic growth of these sectors. Employment creation in 2016 was not enough to
surpass job losses, leading to a net decline of 119 jobs in the Overstrand area in 2016.
26 2017 Socio-economic Profile: Overstrand MunicipalityUnemployment Rates for the Western Cape (%)
Area 2006 2007 2008 2009 2010 2011 2012 2013 2014 2015 2016e
Overstrand 15.5 15.6 14.9 15.3 15.8 16.3 16.9 16.3 17.0 17.8 19.0
Overberg 10.0 10.3 10.2 10.9 11.0 11.4 12.1 12.0 12.4 12.8 13.5
Western Cape 15.8 15.7 15.3 15.8 16.1 16.4 17.0 16.7 17.2 17.8 18.7
Source: Quantec Research, 2017 (e denotes estimate)
Unemployment has been steadily rising in the Overstrand municipal area over the last decade,
with an unemployment rate of 17.8 per cent recorded in 2015. In 2016, the unemployment rate
of the Overstrand municipal area is estimated to have increased to 19.0 per cent, which is
higher than that of the Overberg District (13.5 per cent) and marginally higher than that of the
Province (18.7 per cent in 2016).
27 2017 Socio-economic Profile: Overstrand Municipality8
INFRASTRUCTURE DEVELOPMENT
As economic theory and empirical work suggest that public investment in infrastructure will
boost economic growth by stimulating related private sector investments – the so-called
“crowding-in effect” – as well as providing a solid foundation for social development (Swilling,
2006). In South Africa the importance of infrastructure has not only been emphasised at
national level but also at regional level. The Western Cape Government’s main infrastructure
budgets and investment, both in social and economic infrastructure over the 2017 MTEF,
includes spending by provincial government departments and public entities; as well as
spending on public private partnerships.
In the Western Cape, the region needs efficient transport systems, water and sanitation,
telecommunications and power supplies in order to influence the standard of living of their
populations and regional economic growth. There is, thus, a pressing need to determine
whether government’s strategy on infrastructure investment will yield the desired economic
growth benefits at micro (i.e. project or sector level) or at national or macro level.
.
28 2017 Socio-economic Profile: Overstrand MunicipalityPROVINCIAL INFRASTRUCTURE SPEND
In fulfilment of Provincial Strategic Goal 1 (PSG 1: Grow the economy and create jobs), the
Western Cape Government has dedicated R28.0 billion towards infrastructure development
across the 2017 Medium Term Expenditure Framework (MTEF). This amount will be spent on new
assets, replacements assets maintenance and repairs, upgrades and additions, rehabilitation,
renovation as well as the refurbishment of existing assets (Western Cape Estimates of Provincial
Revenue and Expenditure, 2017). Of this total, an amount of R26.1 billion has been set aside
for physical infrastructure developments whilst R231.0 million and R1.7 billion will respectively
be channelled towards broadband connectivity and public private partnerships.
The total Provincial Infrastructure budget for 2017/18 amounts to R8.6 billion which will be split
amongst the various municipal districts by taking into consideration a wide array of
socio-economic variables, most notably anticipated population growth trends as well as
estimated economic growth potential, the latter being influenced largely by the 2014 Growth
Potential Study of Towns (Donaldson et al, 2014). Below graph depicts the spatial distribution
of provincial infrastructure spend for the 2017/18 financial year.
West Coast
R731.5 million
Overberg 9% Across districts
R416.0 million R2.6 billion
5% 30%
Eden
R1 billion
12%
Cape Winelands
City of Cape Town R1.3 billion
R2.4 billion Central Karoo 15%
28% R127.7 million
1%
Source: Provincial Treasury, 2017
For the financial year 2017/18, the City of Cape Town assumes the majority of the Western
Cape’s infrastructure allocations with an estimated infrastructure spend of R2.4 billion
(28 per cent of provincial allocation). The Cape Winelands region is another notable receiver
of Infrastructure funding with approximately R1.3 billion (15 per cent of provincial allocation)
allocated from the Provincial Government. As will be discussed during the course of this
chapter, it’s the mirroring of provincial infrastructure allocation with municipal infrastructure
budgets and plans which will truly set the Municipality and the Province on a higher growth
path and improved socio-economic environment.
29 2017 Socio-economic Profile: Overstrand MunicipalityProvincial Infrastructure Allocations: Overberg
District
There have been varying levels of infrastructure investments and development across the
131 towns outside the Cape Town Metropolitan areas. Some towns have solid development
potential while others are declining. A number of growth factors have contributed to this
decline (Donaldson et al 2010). Amongst these factors is a deteriorating infrastructure.
Municipal infrastructure consists mainly of bulk treatment plants, pump networks, pump stations
treatment works, reservoirs and distribution pipelines, electricity transmission and distribution
infrastructure. In some municipalities’ infrastructure remains under threat and requires
increasingly more astute management whilst other municipalities have invested significantly in
infrastructure provision and experience high growth rates.
The previous graph indicated that of the R8.6 billion total 2017/18 WCG infrastructure budget,
an amount of R416.0 million (or 5.0 per cent) will be spent within the Overberg District. Below
table depicts how this amount will be spent between the various local municipalities within the
Districts.
Vote
Overberg District Swellendam Theewaterskloof Overstrand Cape Agulhas
R’000
CapeNature - - - 16 961 -
Education - - 40 000 25 000 -
Health - 1 000 352 1 300 10 879
Human - 3 350 72 621 31 670 20 450
Settlements
Public Works - - - - -
Roads 89 383 1 000 87 000 13 000 2 000
Social - - - - -
Development
Total 89 383 5 350 199 973 87 931 33 329
Source: Provincial Treasury, 2017
Above table presents the Provincial allocation for infrastructure in 2017/18 across the Overberg
District. The Provincial expenditure on infrastructure is concentrated in Theewaterskloof
(R200.0 million) followed by Overstrand (R88.0 million). Swellendam and Cape Agulhas display
lower allocations in 2017/18.
30 2017 Socio-economic Profile: Overstrand MunicipalityMUNICIPAL INFRASTRUCTURE SPEND
National and Provincial Transfers
The following table contains the total capital transfers and grants received by the Overstrand
Municipality from National and Provincial Government over the 2017/18 MTREF. The
information depicted below was obtained from the budget schedules within the Municipality’s
2017/18 approved budget. The names of specific grants may therefore differ from their official
wording.
The National Government recognises that infrastructure investment is the cornerstone to
economic and social upliftment. To this end in 2004 the Government introduced a Municipal
Infrastructure Grant to complement their capital budgets. Of the capital expenditure budget
allocated to municipalities within the Cape Winelands a large percentage of it goes to
Economic and Environmental Services and Trading Services (economic infrastructure) whilst
the remainder goes to Governance and Administration and Community and Public Safety.
2017/18 Medium Term Revenue
Audited Outcomes Current
Funding Source and Expenditure Framework
Year
R’000 2013/14 2014/15 2015/16 2016/17 2017/18 2018/19 2019/20
R’000 R’000 R’000 R’000 R’000 R’000 R’000
National Government 26 068 23 068 31 647 25 718 26 330 27 404 35 358
Municipal Infrastructure 18 755 20 674 21 417 18 755 22 330 23 404 24 538
Grant (MIG)
INEP 3 000 2 000 8 000 3 000 4 000 4 000 11 000
Neighbourhood 3 963 - - 3 963 - - -
Development Partnership
Finance Management - - 1 300 - - - -
Municipal Systems 350 934 930 - - - -
Improvement
Provincial Government 8 819 30 195 29 110 9 746 19 878 18 958 34 415
Housing/Provincial Library 8 819 30 195 29 110 9 746 19 878 18 958 34 415
Grant/S&R Grant/Fire
Capacity/CDW
Other Grant Providers - 2 000 - - 2 000 - -
Total Capital Transfers and
34 887 55 803 60 757 34 887 55 803 60 757 34 887
Grants
Source: Overstrand Municipality, 2017/18 Approved Budget Schedules (SA18)
However, budgetary constraints call for an investigation into the types of infrastructure that
would influence growth within the municipality. “Priority should be given to infrastructure
programmes that contribute to regional integration” (NDP, 2012: 159). These include projects
such as revising transport links and improving access to energy or water as they form a vital
part of the Western Cape economy. The region is blessed with a well-maintained road
infrastructure although it does face severe challenges in the provision of a public transport
network.
In 2017/18 the largest amount of funds continued to go towards Infrastructure in the guise of
the MIG (R22.330 million) and the Provincial Government Grant for various votes
(R19.878 million) by far exceeds other line item allocations for 2017/18.
31 2017 Socio-economic Profile: Overstrand MunicipalityThe Municipality will apply the allocations received from above specified funding sources to
prioritise the following projects for 2017/18:
2017/18 2018/19 2019/20
Municipal Vote Project description
R’000 R’000 R’000
Transport C1000 Hermanus-Gansbaai 10 000 120 000 120 000
Transport C968 Hermanus Bypass - 40 000 120 000
Education Qhayiya SS 25 000 19 309 15 000
Human Settlements 3002-xx - Hawston (548 units) IRDP - 6 000 24 000
Human Settlements 3090-02 - Gansbaai South Blompark 2 000 10 000 13 200
(464 services) IRDP
Health CI810022: Gansbaai - Gansbaai Clinic - 1 000 4 000 14 000
Upgrade and Additions
CapeNature Kogelberg Nature Reserve: Phase 2 16 961 - -
Human Settlements 3021-xx - Stanford West (600 services) IRDP - - 15 000
Human Settlements 3005-03 - Zwelihle Swartdamweg BNG Site C 13 560 - -
(132 units) IRDP
Human Settlements 3002-01 - Hawston (843 services) IRDP 5 000 7 500 -
Source: Overstrand Municipality, 2017/18 Approved Budget Schedules (SA36)
It is clear that the Municipality is prioritising human settlements, followed by education and
roads infrastructure. These projects all align to the Municipality’s developmental needs
outlined within the 2017/18 Integrated Development Plan (IDP).
32 2017 Socio-economic Profile: Overstrand Municipality1. Demographics
Population: Department of Social Development, 2017
Age cohorts: Department of Social Development, 2017
2. Education
Learner enrolment: Western Cape Education Department, 2017; Annual Survey of Public
and Independent Schools (ASS), 2016
Learner-teacher ratio: Western Cape Education Department, 2017; Annual Survey of
Public and Independent Schools (ASS), 2016
Grade 12 drop-out rates: Western Cape Education Department, 2017; Annual Survey of
Public and Independent Schools (ASS), 2016
Educational facilities: Western Cape Education Department, 2017; Annual Survey of Public
and Independent Schools (ASS), 2016
Educational outcomes: Western Cape Education Department, 2017; Annual Survey of
Public and Independent Schools (ASS), 2016
3. Health
Healthcare facilities: Department of Health, 2017
Emergency medical services: Department of Health, 2017
HIV/AIDS: Department of Health, 2017
Tuberculosis: Department of Health, 2017
Child health: Department of Health, 2017
Maternal health: Department of Health, 2017
4. Poverty
GDP per capita: Statistics South Africa, 2017; own calculations
Income Inequality: IHS Global Insight, 2017
Human Development: IHS Global Insight, 2017
Indigent households: Department of Local Government, 2017
33 2017 Socio-economic Profile: Overstrand Municipality5. Basic Services
Households: Statistics South Africa, Census 2011 and Community Survey 2016
Access to housing: Statistics South Africa, Census 2011 and Community Survey 2016
Access to water: Statistics South Africa, Census 2011 and Community Survey 2016
Access to electricity: Statistics South Africa, Census 2011 and Community Survey 2016
Access to sanitation: Statistics South Africa, Census 2011 and Community Survey 2016
Access to refuse removal: Statistics South Africa, Census 2011 and Community Survey 2016
6. Safety and Security
Murder: South African Police Service (SAPS), 2017
Sexual offences: South African Police Service (SAPS), 2017
Drug-related crimes: South African Police Service (SAPS), 2017
Driving under the influence: South African Police Service (SAPS), 2017
Residential burglaries: South African Police Service (SAPS), 2017
Fatal crashes: Department of Transport and Public Works, 2017
Road user fatalities: Department of Transport and Public Works, 2017
7. Economy
Sector Performance: Quantec Research, 2017
Labour: Quantec Research, 2017
8. Infrastructure Development
Provincial Infrastructure Spend: Provincial Treasury, 2017
Municipal Infrastructure Spend: Municipal Budget Schedules (SA18 & SA36)
34 2017 Socio-economic Profile: Overstrand MunicipalityYou can also read