Global Sports Impact Report 2017 - Sportcal
←
→
Page content transcription
If your browser does not render page correctly, please read the page content below
Global Sports Impact Report 2017
Masthead / Global Sports Impact Report 2016 Global Sports Impact Report 2017
GSI Report 2017
The Global Sports Impact
(GSI) Report 2017
No part of this publication may be reproduced, distributed or transmitted in any form PUBLISHED MAY 2017
or by any means, or stored in any retrieval system of any nature, without prior written BY SPORTCAL GLOBAL
permission, except for permitted fair dealing under the Copyright Designs and Patent
Act 1988.
COMMUNICATIONS LTD
Application for permission for use of copyright material including permission to Publisher/Editor
reproduce extracts in other published works shall be made to Sportcal Global Mike Laflin
Communications Ltd. Full acknowledgement of Sportcal Global Communications Ltd
must be given. Deputy Editors
Colin Stewart
Data is published in good faith and is the best information possessed by Sportcal Andrew Horsewood
Global Communications Ltd at the stated date of publication. Tim Smith
The published data does not constitute advice and should not be relied upon by any Editorial Team
person in making (or refraining from making) any decision. Callum Murray
Jonathan Rest
All figures in US dollars unless otherwise indicated.
Research & Insight Team
Pictures supplied by © Getty Images Krzysztof Kropielnicki
Tim Rollason
Callum Man
Copyright and Database Right
2017 Sportcal Global Communications Ltd
Production Team
All rights reserved
Sarah Danbury
Chris Mann
ISBN Number: 978-1-9997483-0-2
Gordon Berry
Alex Clay
Allington House
25 High Street
Design and Production
Wimbledon Village
Whistle Agency
London
SW19 5DX
T: +44 20 8944 8786
F: +44 20 8944 8740
E: sales@sportcal.com
W: www.sportcal.com
© and database right 2017 Sportcal Global Communications Ltd. All Rights Reserved
2 © and database right 2015 Sportcal Global Communications Ltd. All Rights Reserved 3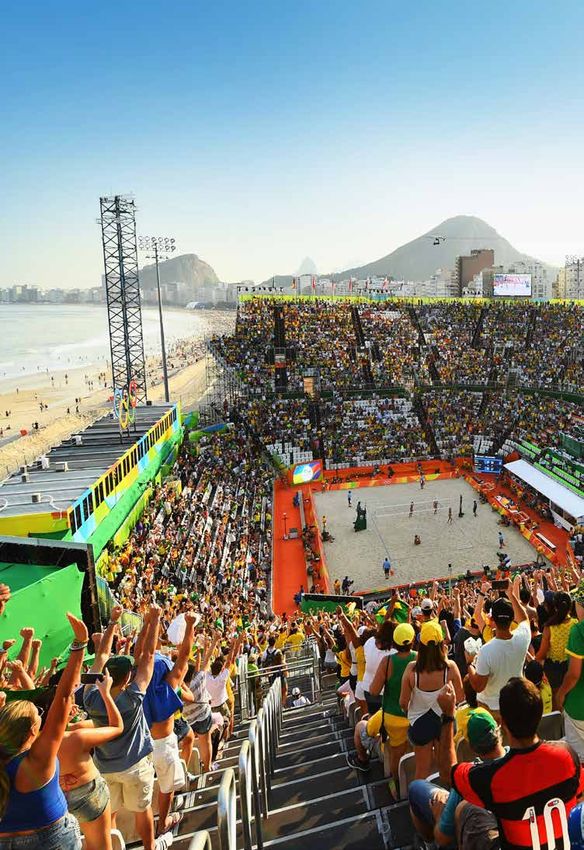
Contents / Global Sports Impact Report 2017 Global Sports Impact Report 2017 / Contents
GSI Report 2017
Contents
1 INTRODUCTION 06 6 SPORTING IMPACT 182
2 THE GLOBAL SPORTS IMPACT PROJECT 12 Sporting Impact analysis (2013-2016) 184
What is the GSI Project? 14 Competing nations analysis (2016) 186
The history of GSI 16 Athletes analysis 202
The GSI methodology 20 Summer vs winter world championships 209
GSI Event Studies programme 2017-2020 22 Athletes gender analysis 210
3 EVENT HOSTING AND BIDDING 26 Medals analysis 224
Event hosting analysis (2013-2016) 28 7 CONCLUSIONS 232
Event hosting analysis (2016) 34 Event hosting and bidding 235
Event bidding analysis (2016) 40 Economic impact 236
Global Sports Nations & Cities Index 54 Sport tourism 237
4 ECONOMIC IMPACT 100 Sporting impact 238
Economics of the Olympic Games 102 8 EVENT ANALYSIS 240
GSI attendance analysis (2013-2016) 112 Overview (2016) 242
GSI attendance analysis (2016) 114 A-Z by sport (70 events) 246
Global sports properties attendance analysis 117 - Multi-sport games (5 events)
Global sports properties fact files 120 - World championships (61 events)
5 SPORT TOURISM 156 - Continental championships (4 events)
Participant and media bed night analysis (2016) 158 9 CREDITS AND ACKNOWLEDGEMENTS 316
Spectator bed night analysis (2016) 168 10 SPORTS & EVENTS 320
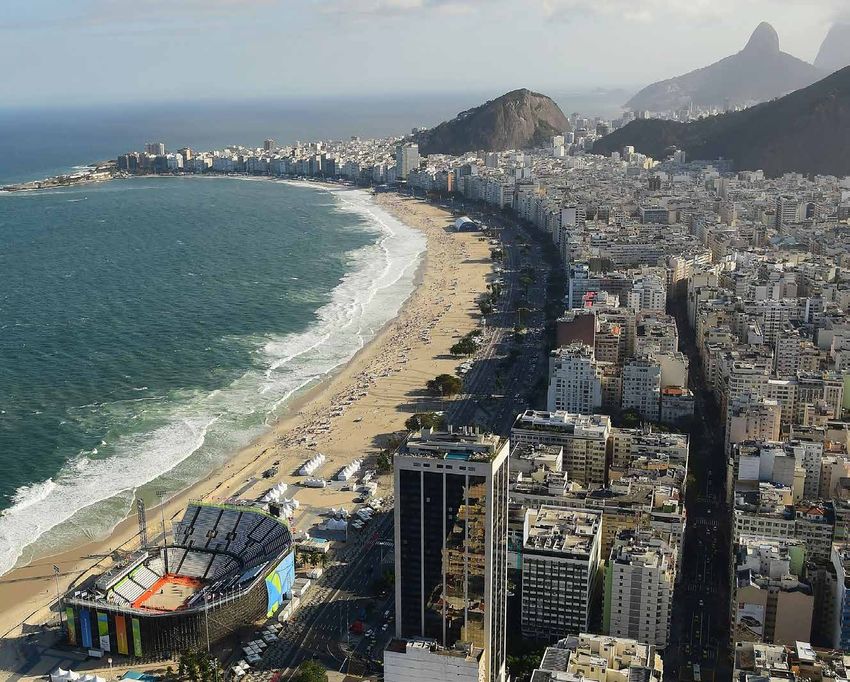
Rio 2016 Olympic Games case study 169 11 TABLES & CHARTS 326
4 © and database right 2015 Sportcal Global Communications Ltd. All Rights Reserved © and database right 2017 Sportcal Global Communications Ltd. All Rights Reserved 5
Introduction / Global Sports Impact Report 2017 Global Sports Impact Report 2017 / Introduction
Introduction
WELCOME TO GSI REPORT 2017, THE THIRD EDITION OF THE GLOBAL SPORTS IMPACT REPORT
2016 was an Olympic year and for many sports this represents Analysis of the event-hosting trends during the 2013-16 cycle
the culmination of a four-year programme. show an increase in the number of major events taking place in
North America, while Europe continues to host the largest share
For these sports the Olympics is the pinnacle of the cycle and of events overall by continent.
thus in an Olympic year sports like badminton omit their world
championships, which otherwise are held annually. Announced in April 2017, the Global Sports Nations and Cities
Index is published in full exclusively in this report. Featuring 621
This accounts for the 70 events studied during 2016 in this GSI cities from 86 nations, the index analysed 705 events across 151
Report compared with the 83 events studied during 2015. categories in 81 sports, including summer and winter Olympic
sports and Olympic ‘recognised’ sports. USA was once again
The GSI Report 2017 analyses the impact of sport in the period named number one Global Sports Nation, while London, UK
2013 through to 2016 and compares the 313 events that have retained its place as number one Global Sports City.
been studied during this period and the cities and nations that
have hosted them. This year’s report has also identified the top 25 most valuable
events judged according to their holistic impact during the
The first two editions of the GSI Report focused on a broad 2013-16 cycle. The analysis has helped answer the age-old
range of indicators. Thanks to the ever-increasing scope of the question: which major sports event produces the largest impact,
project and the data gathered, the 2017 report focuses on a after the Olympic Games and Fifa World Cup, and can therefore
limited number of core sectors. Separate reports and papers will be considered the world’s ‘third largest sports event’?
be published covering other elements of the GSI Project in
the future.
As 2016 was an Olympic year, a special analysis of the Across the 2013-16 Olympic cycle, a staggering 54,392,673
economics of the Olympic Games has been conducted, spectators attended the 317 events analysed as part of the GSI
finding that revenue distribution by the International Olympic scope of research.
Committee to Olympic Games Organising Committees
(OCOGs) has failed to increase in line with increased media and Almost 16 million people attended the 70 analysed multisport
sponsorship revenues. games, world and continental championships in 2016, with
an average of 57,233 spectators attending the 57 world
OCOG revenues, however, have fluctuated depending on championships.
the host city. With better structured ticketing and domestic
sponsorship and licensing programmes, OCOGs can In addition to the 70 events within the GSI scope of research,
significantly increase their revenues, which are used to help analysis of 70 leading annual sports properties across 17 sports
cover the costs of staging the Games. This underlines the during the 2015-16 / 2016 seasons shows that a total of more
importance of transferring knowledge from one host to the next than 505 million spectators attended these events.
in order to maximise returns and cover the costs of hosting.
A year-on-year attendance analysis of 56 of these selected
Host cities of the Olympic Games rely heavily on the reporting major annual properties, covering 13 sports, shows a very minor
of economic impact to justify the colossal spending required decline in attendance of 0.27 per cent overall during 2016
to stage the Games and often fail to look at the wider, more compared with 2015. This could raise some concern for event
holistic, impacts that an Olympic Games can generate. This owners, as the data analysed contains 858 additional fixtures
reporting is frequently characterised by academics and taking place across all of the events, with a notable increase in
economic commentators as being far too inconsistent the number of post-season playoff matches in some sports.
and inaccurate.
Sport-specific declines were found in major properties relating
Research by leading academics in this area has shown that no to American football, basketball, cycling and tennis. Increases
Games since 1960 has come in under budget, signalling a clear were found in baseball, cricket, rugby union and soccer.
problem for future potential host cities, as the substantial costs
act as a deterrent for future bids.
8 © and database right 2017 Sportcal Global Communications Ltd. All Rights Reserved © and database right 2017 Sportcal Global Communications Ltd. All Rights Reserved 9
The GSI Project / Global Sports Impact Report 2017 Global Sports Impact Report 2017 / The GSI Project
GSI: A quick guide
What is the GSI Project?
A methodology to measure the holistic impact of events, and a standard to
GSI Project
Working with a wide variety of stakeholders and experts worldwide, capture the narrative.
through its Global Sports Impact (GSI) Project, Sportcal has developed a GSI Report
The GSI Project’s annual publication, which analyses and benchmarks major
events and their impacts.
methodology to measure the holistic impact of events and a standard to
A programme through which experts from throughout the sports industry can
GSI Experts Programme
capture the narrative coming from these events to produce comprehensive input into shaping the future of the GSI Methodology.
and informative analysis and insight for the sports industry. GSI Methodology
The principles and structure by which the GSI Project assesses the holistic
impact of events.
Sportcal has developed a knowledge-sharing portal that A points score attributed to a single event, calculated using the GSI Method-
enables rights holders, hosts and stakeholders to GSI Event Rating
ology, drawing inputs from the event’s raw data across key impact pillars.
understand more about the wider impacts of their events,
providing greater insight into the benefits of hosting major GSI Events Index Ranked list of events in any given year or cycle by their GSI Event Rating.
sporting events.
Ranked list of nations across a given period, by the cumulative score of the
A range of services have been developed through the GSI GSI Global Sports Nations Index
events that nation has hosted.
Project, aimed at helping stakeholders capture information
about their events, analyse the data and benchmark against
Ranked list of cities across a given period, by the cumulative score of the
other events, nations and cities. GSI Global Sports Cities Index
events that city has hosted.
GSI Event Studies Application of the GSI Methodology to holistically assess an individual event.
The programme that has been launched for the 2017-2020 Olympic cycle, to
“We believe that sport is undervalued and GSI Event Studies Programme
assess the impact of world sport over that period.
that the true impact of sport is not fully GSI Workshops
Gatherings bringing together event owners, hosts and other stakeholders to
understood, and thus rarely captured.”
discuss the impact of sport and development of the GSI Project.
Intelligence platform hosted on the Sportcal website, showcasing event
Mike Laflin – CEO, Sportcal Sportcal Events impact data from 2,500+ events, live bidding information on 600+ available
events, and an archive of 3,300+ past bidding processes.
14 © and database right 2017 Sportcal Global Communications Ltd. All Rights Reserved © and database right 2017 Sportcal Global Communications Ltd. All Rights Reserved 15
The GSI Project / Global Sports Impact Report 2017 Global Sports Impact Report 2017 / The GSI Project
GSI Timeline
2015-16:
GSI Experts
Programme #2
Global Sports Impact
Report 2016
GSI Nations & Cities
2012: First GSI Nations Indices move to
& Cities Indices annual calculation
(calculated bi-annually)
GSI Report 2016
GSI established in
November 2011 GSI Workshop #1 GSI Workshop #2 GSI Workshop #3 GSI Workshop #4
2011 2012 2013 2014 2015 2016 2017 2018 2019 2020
2011-12:
GSI Experts First studies produced:
Programme #1 Rabobank Hockey World Cup 2014
World Archery Championships 2015 2017-20: SPORTCAL GSI
GSI Event Studies EVENT STUDIES
Programme
The Global Sports
Impact Report 2015
A review of 2014
Global Sports Impact
Report 2017
First GSI Report GSI Report 2017
2015-2016:
Frequent
production of
studies before
inception of
programme
18 © and database right 2017 Sportcal Global Communications Ltd. All Rights Reserved © and database right 2017 Sportcal Global Communications Ltd. All Rights Reserved 19
Event Hosting and Bidding / Global Sports Impact Report 2017 Global Sports Impact Report 2017 / Event Hosting and Bidding
Events hosted throughout 2013-2016 Olympic cycle by continent
50
45
Event Hosting
40
35
30
and Bidding
25
20
15
10
Event Hosting 5
GSI Report 2017 provides a year by year breakdown of event hosting 0
throughout the 2013-16 Olympic cycle, focussing on the ever-changing 2013 2014 2015 2016
continental distribution of events, top hosting nations and cities, including Africa Asia Europe North America Oceania South America Source: Sportcal Research
an in-depth look at the year 2016.
2013 2014 2015 2016
EVENT HOSTING DURING THE 2013-16 OLYMPIC CYCLE % SHARE EVENTS % SHARE EVENTS % SHARE EVENTS % SHARE EVENTS
Africa 3.8% 3 2.3% 2 2.3% 2 1.4% 1
Throughout the 2013-16 cycle, 323 top-tier world In 2016, the year of the Rio 2016 Olympic Games, 70 events
championship and multisport events have been analysed as took place. Asia 13.1% 10.5 25.6% 22 21.8% 19 17.1% 12
part of the GSI Project. Europe 57.5% 46 54.7% 47 48.3% 42 45.7% 32
As depicted in the line chart, the number of GSI events to
North America 16.9% 13.5 11.6% 10 21.8% 19 22.9% 16
The number of events taking place each year throughout have taken place in Europe declined throughout the Olympic
an Olympic cycle remains broadly similar, except for in an cycle. The number of events to take place in Africa, Asia, Oceania 3.8% 3 - 0 4.6% 4 2.9% 2
Olympic year when the number of events decreases. North America, Oceania and South America did not differ South America 5.0% 4 5.8% 5 1.1% 1 10.0% 7
greatly from 2013 to 2016, although the latter failed to host a
TOTAL (323 EVENTS) 80 86 87 70
During 2013, 80 events that qualify for analysis under the GSI single event in 2015 before hosting seven in total during 2016.
criteria took place throughout the year whilst 86 events took
place in 2014 and 87 in 2015. NATIONS Nations hosting GSI events throughout
2013-2016 Olympic cycle – Top 10
Throughout the cycle, Canada hosted 25 GSI events and USA
hosted 24. They are the only two North American nations to NATION CONTINENT EVENTS
feature in the top 10.
Canada North America 25
Six European nations hosted 10 or more events throughout USA North America 24
the cycle; Russia, Germany, Italy, United Kingdom, France and Russia Europe 18
the Netherlands.
Germany Europe 16
Asia is represented by the remaining two nations within the China Asia 15
top 10; China and Korea. Italy Europe 14
Brazil (7) topped the list of South American nations. United Kingdom Europe 12
France Europe 12
South Africa hosted more events than any other nation Netherlands Europe 10
in Africa (3).
Korea Asia 10
Both Australia and New Zealand hosted three events a piece
during the 2013-16 Olympic cycle, representing Oceania. Source: Sportcal Research
28 © and database right 2017 Sportcal Global Communications Ltd. All Rights Reserved © and database right 2017 Sportcal Global Communications Ltd. All Rights Reserved 29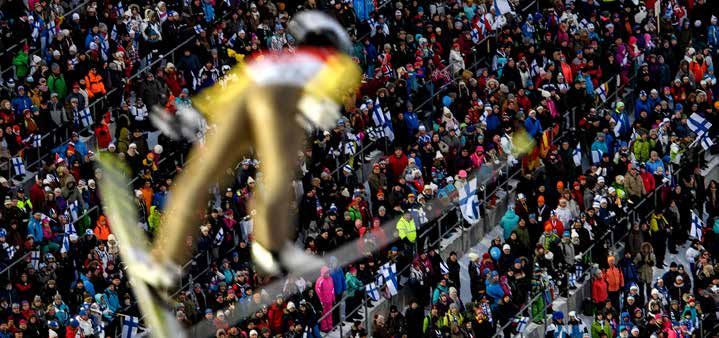
Event Hosting and Bidding / Global Sports Impact Report 2017 Global Sports Impact Report 2017 / Event Hosting and Bidding
Global Sports Nations and Cities Index GLOBAL SPORTS NATIONS INDEX APRIL 2017
The Global Sports Nations and Cities Index is based on an in- Thus, events such as soccer’s Euro 2016, a continental 2011-2024
depth analysis of more than 700 major multi-sport games and championship for one sport, and golf’s Ryder Cup, an event
world championships over a rolling 14-year period, covering limited to only certain countries for one sport, are excluded USA has for the second edition in a row topped Sportcal’s
seven years in the past and seven years in the future. from the current index. These events do however receive a GSI Global Sports Nations Index, placing ahead of the United
Event Rating, allowing us to compare event by event using Kingdom and Russia, finishing with a total rating of 40,555.
This period allows events from a minimum of three Olympic the GSI Project methodology. These ratings are detailed in the
cycles to be taken in to consideration. Event Analysis chapter. The United Kingdom has risen two places having secured
the UCI Road World Championships for Yorkshire, England
The index incorporates more than 70 sports, including summer Selected continental multi-sport games are included in 2019; the 2019 WTF World Taekwondo Championships in
and winter Olympic sports and Olympic ‘recognised’ sports. in the index such as the African Games, Asian Games, Manchester, England and the Rugby League World Cup 2021
European Games, Pacific Games, Pan American Games and which will take place across multiple cities in England.
The aim is to identify which cities and nations are bidding for Commonwealth Games.
and winning the right to host global sports events. In orderfor Russia has lost ground at the top due to the Bobsleigh and
it to be truly global the index needs to focus on events that Data is gathered on the events that are covered in the index Skeleton World Championships 2017 and World Biathlon
any country can bid for, with a few exceptions for and each event is given a weighting based on the GSI Events Championships 2021 both being reassigned.
multi-sport games. Rating system. The GSI Events Rating is calculated based on
the size, scale and impact of an event using a range of data
This means that continental events and world series events are indicators which cover economic, sporting, media and Top 20 Global Sports Nations 2011-2024
excluded from the current index. As discussed in the Global social impacts.
Sports Impact (GSI) Project chapter, this methodology is RANK CHANGE NATION TOTAL
being developed in order to establish a benchmarking system 1 0 USA 40,555
whereby continental championships and world series events
2 é2 United Kingdom 39,055
can be included.
3 ê1 Russia 34,287
4 é1 China 33,904
621
5 ê2 Canada 31,585
6 é2 Japan 28,770
7 ê1 Germany 28,609
705
CITIES
8 ê1 Italy 24,708
9 é1 France 23,273
10 ê1 Brazil 22,445
EVENTS 11 é2 Austria 21,004
12 ê1 Korea 20,957
13 ê1 Spain 20,684
14 é1 Denmark 16,661
15 ê1 Netherlands 16,497
16 é2 Switzerland 15,160
17 ê1 Qatar 14,459
18 ê1 Sweden 13,978
19 0 Australia 13,674
20 é2 Hungary 11,405
151
CATEGORIES
81
SPORTS
86
NATIONS
As the index rolls in to 2017, we lose events from the year
2010 and gain events awarded for the year 2024. As a result,
top scoring major events from 2010 such as the Fifa World
Having successfully hosted the Pan American and Para Pan
American games in 2015, cities in Canada have been cautious
in bidding for both the Commonwealth Games and Olympic
Cup which took place across South Africa; the Asian Games Games due to the projected costs. Since the last index,
in Guangzhou, China; Olympic Winter Games in Vancouver, Edmonton, Canada was awarded the ITU World Triathlon
Canada; and the Commonwealth Games in New Delhi, India Series Grand Final 2020 which added to its total; however this
no longer register points for these host cities and nations. was not enough to remain ahead of China and the
Canada in particular, falling two places to fifth, is affected United Kingdom.
by the loss of the Vancouver 2010 Olympic Winter Games.
54 © and database right 2017 Sportcal Global Communications Ltd. All Rights Reserved © and database right 2017 Sportcal Global Communications Ltd. All Rights Reserved 55
Economic Impact / Global Sports Impact Report 2017 Global Sports Impact Report 2017 / Economic Impact
Economic Impact WHAT WHY
The GSI Project has established the need for a consensus surrounding the
global measurement of economic impact in order to accurately compare the Economic impact studies are often used to justify public
spending, whether accelerating transport infrastructure
Economic impact is derived using key data indicators
benefits of hosting major sporting events in different countries and between which feed in to a model to quantify impact, whether this (airport expansion, rail links, highways, etc.) as a result
of hosting a major event or using public funds to cover
be to establish the direct economic impact, or indirect
different sports. GSI Report 2017 explores the cost versus return considered and induced economic impact produced as a result of an some of the costs of staging the event.
event taking place in a specific location.
by cities bidding to host the Olympic Games. If the public are unaware of the benefits, they are less
likely to support the staging of the event. If the benefits
Indirect and induced economic impact models rely on
multipliers which produce a larger economic impact can be shown to outweigh the costs, the public are
Previous editions of the Global Sports Impact Report have value for an event. The multiplier effect accounts for more likely to support the investment in hosting a major
detailed the differing models used to quantify the economic initial spending in a region which then generates further sporting event.
impact of major sporting events. The analysis has outlined spending in the local economy. There is no consensus
the lack of consensus among academics and industry experts as to the size of the multiplier effect used to calculate
around what should and should not be included when economic impact, with a wide range of methodologies
measuring impact. available, thus making it almost impossible to compare
indirect and induced economic impact between events.
To be able to accurately compare events on a like for like basis,
the scope of research and methodologies used need to be the Economic impact has been shown to revolve largely
same. The GSI Project has found significant variations in the around the initial investment into the host locations,
reporting of economic impact from organisations based in the
same country and even when studying the same event, in part
from both direct and indirect capital spending in order
to bring infrastructure up to the standards required
WHEN
due to the differing objectives of each study commissioner. for the event. This creates numerous jobs along the
supply chain due to the intensive period in which the
Economics of the
infrastructure must be readied. • Pre-event phase – from the announcement of
bidding, to the awarding of the bid, to the staging
Olympic Games
The second wave of impact comes from attendance of the event
and tourism - the number of spectators attending • Hosting phase – the year in which the event is
events, whether these are locals or visitors, how much taking place
The economic impact of the Olympic Games is a hotly these visitors are spending during their time in the host • Post-event phase – from the end of the event to the
contested topic and due to the sheer size and scale of the location, for how long they stay in the location and foreseeable future, often used in the same
mega-event, is often complex to quantify. where they are staying. context as legacy
Pre-event impact estimates can often be used to justify public
spending and accelerate infrastructure projects within a
host city. However, citizens around the world are now better
informed and have access to a wealth of information, especially
through digital platforms, making it increasingly difficult for
decision makers to justify the case for spending vast amounts
of public money on hosting major sporting events based on the
economic benefits of hosting those events.
WHO NEED
The economic impact produced by events is an There is a need to develop a standard global
important measurement for event owners, event methodology for measuring the economic impact of
organisers, local or national government, and also to major sporting events, thus enabling comparisons to be
sponsors and broadcasters. made between events hosted in different countries and
different events from different sports.
The economic impact of an event can inform the key
decision makers at city and government organisations
looking to bid for major sporting events.
102 © and database right 2017 Sportcal Global Communications Ltd. All Rights Reserved © and database right 2017 Sportcal Global Communications Ltd. All Rights Reserved 103
Economic Impact / Global Sports Impact Report 2017 Global Sports Impact Report 2017 / Economic Impact
Attendance (2013-2016) Top 25 events by total attendance (2013-2016)
SPORT EVENT TOTAL ATTENDANCE
Attendances at world championships, multisport games and continental championships
Olympic Games 2016 2016 6,150,000*
FIFA World Cup 2014 2014 3,429,873
over the 2013-2016 Olympic cycle Rugby World Cup 2015 2015 2,477,805
UEFA Euro 2016 2016 2,427,303
GSI Report 2017 has analysed the attendance of 317 events within the GSI Paralympic Games 2016 2016 2,150,000*
Copa América Centenario 2016 2016 1,483,855
scope of research for which data was available across the 2013-2016 FIFA Women's World Cup 2015 2015 1,353,506
Olympic cycle. Commonwealth Games 2014 2014 1,316,000
CONCACAF Gold Cup 2015 2015 1,090,282
Pan American Games 2015 2015 1,050,000
In total, 54,392,673 spectators attended these events, with 2016 contributing ICC Cricket World Cup 2015 2015 1,016,421
Olympic Winter Games 2014 2014 1,000,000
the most spectators at 16,006,584 despite the fewer number of events which Special Olympics World Winter Games 2013 2013 1,000,000*
took place (70) and for which data was available (65). World Baseball Classic 2013 2013 885,212
Summer Universiade 2013 2013 800,000
Orange Africa Cup of Nations 2013 2013 753,169
IIHF World Championships 2015 2015 741,690
ICC World Twenty20 2016 2016 700,000
IAAF World Athletics Championships 2015 2015 681,864
9,264,717 13,364,915 FIBA Basketball World Cup for Men 2014
Copa América 2015
AFC Asian Cup 2015
2014
2015
2015
675,473
655,902
650,000
2013 2014 UCI Road World Championships 2015
IIHF World Championships 2014
2015
2014
645,000
643,434
(80 events in GSI scope of (85 events in GSI scope of
research with data available) research with data available) Youth Olympic Games 2014 2014 610,000
* Estimated using a combination of factors including event owner and local organising committee estimates, previous event data and official press releases
15,756,457 16,006,584 Unsurprisingly, the Olympic Games and Fifa World Cup place
first and second respectively in terms of total attendance.
2015 2016 The Rugby World Cup places third, followed by the UEFA EURO
(87 events in GSI scope of (65 events in GSI scope of 2016 soccer tournament in fourth and the Paralympic Games in
research with data available) research with data available) fifth.
2013 - 2016
317 events
54,392,673
112 © and database right 2017 Sportcal Global Communications Ltd. All Rights Reserved © and database right 2017 Sportcal Global Communications Ltd. All Rights Reserved 113Sport Tourism / Global Sports Impact Report 2017 Global Sports Impact Report 2017 / Sport Tourism
Sport Tourism
The 70 world championships and multisport games in 2016
combined to generate 1,517,900 bed nights for their hosts,
from participants (comprising athletes, team officials and
technical officials) and media alone.
Unsurprisingly, the Rio summer Olympics recorded the highest
number of participant and media bed nights, at over 600,000.
Participant and media bed nights
Multisport games, with high numbers of athletes and officials
staying for relatively long durations, made up five of the top
seven events sorted by bed nights.
Soccer’s major events of 2016 – UEFA Euro and the Copa
América Centenario – also recorded high numbers of bed
nights (162,700 and 67,700, respectively), principally due to the
large media delegations that cover these events.
But the true tourism impact of these events is much higher
than these figures, which do not take into account overseas
spectators, athlete-accompanying friends or family members, or
participants who extend their stay beyond the duration of the
1,517,900
event for training or holiday purposes. Rather, the participant
and media bed night figures give a good indication of the
baseline tourism impact for any given event.
PARTICIPANT AND MEDIA BED
NIGHTS GENERATED IN 2016 Estimated participant and media bed nights – Top 10
136,000 600,600 RANK
1
SPORT
Olympics
EVENT
Olympic Games 2016
ATHLETES
168,600
OFFICIALS -
TEAM
82,500
OFFICIALS -
TECHNICAL
37,500
ACCREDITED
MEDIA
312,000
TOTAL
600,600
BED NIGHTS FROM MEDIA RIO 2016 PARTICIPANT 2 Soccer UEFA Euro 2016 14,100 10,200 2,400 136,000 162,700
ALONE AT UEFA EURO 2016 AND MEDIA BED NIGHTS 3 Paralympics Paralympic Games 2016 48,700 33,600 16,800 9,300 108,400
Americas Masters
4 Games 65,000 1,700 6,500 2,000 75,200
Games 2016
Copa América
The GSI Report has established an industry-leading methodology for 5 Soccer
Centenario 2016
7,500 5,100 1,200 54,000 67,800
calculating the number of bed nights an event generates from participants 6 Games Asian Beach Games 2016 28,600 13,600 15,800 3,100 61,100
Youth Olympic Winter
and media, in order to analyse the tourism impact from an event before a
7 Olympics 13,800 13,000 5,200 5,100 37,100
Games 2016
single ticket is even sold. This methodology is used in turn to help event
8 Cricket ICC World Twenty20 2016 8,800 5,000 1,600 19,100 34,500
2016 World Rowing
owners better understand the baseline economic impact of their events, and 9 Rowing Senior, U23 and Junior
Championships
20,900 8,800 1,100 700 31,500
helps event hosts calculate the projected direct economic impact of potential 10 Cycling - road
UCI Road World
10,000 9,400 700 4,100 24,200
Championships 2016
or newly acquired events.
Source: Sportcal Research
158 © and database right 2017 Sportcal Global Communications Ltd. All Rights Reserved © and database right 2017 Sportcal Global Communications Ltd. All Rights Reserved 159Sport Tourism / Global Sports Impact Report 2017 Global Sports Impact Report 2017 / Sport Tourism
Estimated participant and media bed nights – 13-70
Estimated participant and media bed nights – Top 3
FINA World Championships (25m) 2016
World Karate Championships 2016
2016 IIHF Ice Hockey World Championship
UCI Mountain Bike & Trials World Championships (XCO, XCE, XCR) 2016
FIFA Futsal World Cup 2016
WBSC Women’s Softball World Championship 2016
World Biathlon Championships 2016
Floorball Men’s World Championships 2016
World Figure Skating Championships 2016
UCI Track World Championships 2016
Oceania Nations Cup 2016
ITU Triathlon Mixed Relay World Championships 2016
Bobsleigh & Skeleton World Championships 2016
World Roller Speed Skating Championships 2016
Nokian Tyres World Orienteering Championships 2016
UCI Cyclo-Cross World Championships 2016
UCI BMX World Championships 2016
AIBA Women’s World Championships 2016
0 100,000 200,000 300,000 400,000 500,000 600,000 700,000
ITU World Triathlon Series 2016
ITU Modern Pentathlon World Championships 2016
IAAF 16th World Indoor Athletics Championships 2016
Athletes Officials - Team Officials - Technical Accredited Media
World Cup of Hockey 2016
Source: Sportcal Research IFSC World Championships 2016
UIPM Biathle and Triathle World Championships 2016
2016 IIHF Ice Hockey Women’s World Championship
FINA Diving World Cup 2016
LG Presents WBSC Women’s Baseball World Cup 2016
Indoor Archery World Championship 2016
IAAF/Cardiff University World Half Marathon Championships 2016
Estimated participant and media bed nights – 3-12 World Field Archery Championships 2016
World Single Distances Speed Skating Championships 2016
World Beach Handball Championship 2016
JJIF World Championships 2016
World Synchronized Skating Championships 2016
Americas Masters Games 2016
Ryder Cup 2016
Copa América Centenario 2016 INS ISA World Surfing Games
IAAF World Race Walking Team Championships 2016
Asian Beach Games 2016 FIBA 3x3 World Championships 2016
Youth Olympic Winter Games 2016 PSA Men’s World Championship 2016
ISSF World Championship Running Target 2016
ICC World Twenty20 2016 IWWF Cable Wakeboard World Championships 2016
2016 World Rowing Senuir, U23 and Junior Championships Luge World Championships - Artificial Track 2016
World Short Track Speed Skating Championships 2016
UCI Road World Championships 2016
Fencing World Championships 2016
Perfect 2016 World Team Table Tennis Championships World Men’s Curling Championship 2016
Ford World Women’s Curling Championship 2016
TOTAL BWF Thomas & Uber Cup Finals 2016
2016 WTF World Taekwondo Team Championships
IRF World Championships 2016
0 10,000 20,000 30,000 40,000 50,000 60,000 70,000 80,000 UCI Indoor Cycling World Championships 2016
UCI Mountain Bike Marathon World Championships 2016
Source: Sportcal Research World Allround Speed Skating Championships 2016
PSA Women’s World Championship 2015 (delayed)
World Sprint Speed Skating Championships 2016
FIS Ski Flying World Championships 2016
ISAF Women’s Match Racing World Championship 2016
ITU Long Distance Triathlon World Championships 2016
ITU Cross Triathlon World Championships 2016
ITU Winter Triathlon World Championships 2016
00
00
00
00
0
0
0
0
00
00
00
00
,0
,0
,0
,0
4,
6,
8,
2,
10
12
14
16
0
162 © and database right 2017 Sportcal Global Communications Ltd. All Rights Reserved © and database right 2017 Sportcal Global Communications Ltd. All Rights Reserved 163Sporting Impact / Global Sports Impact Report 2017 Global Sports Impact Report 2017 / Sporting Impact
Sporting Impact 2013
73
EVENTS
77
EVENTS
2014
GSI Report 2017 has analysed 70 multisport games, world and continental
championships which took place in 2016. An analysis of competing athletes,
54 SUMMER 19 WINTER 65 SUMMER 12 WINTER
competing nations, event types, gender parity and medals performance 6 MULTISPORT 67 WORLD 5 MULTISPORT 72 WORLD
GAMES CHAMPIONSHIPS GAMES CHAMPIONSHIPS
has provided a broad overview of the sporting landscape. A progressive
analysis inclusive of previous GSI Reports highlights the differences between
each year of the Olympic cycle and the decrease in the number of world
68,416 49,746
ATHLETES 59.2% / 40.8% ATHLETES 59.8% / 40.2%
championships in an Olympic year compared to the three previous years.
7.5% 92.5% 6.0% 94.0%
With many athletes and national federations focused on the Kuwait was another country which saw restrictions applied to DOMESTIC OVERSEAS DOMESTIC OVERSEAS
landmark event of 2016 – the Olympic Games – this in turn its athletes, following the decision by the IOC (International
resulted in fewer world championship and multisport games
taking place than in 2015. The decrease in numbers was found
Olympic Committee) to suspend the Kuwait Olympic
Committee (KOC) in late 2015 for political interference in 50 - 44 5.2
most prominently in summer world championships, whereby the affairs of the KOC and national sports federations. This
AVERAGE NUMBER OF AVERAGE CONTINENTAL REACH AVERAGE NUMBER OF AVERAGE CONTINENTAL REACH
COMPETING NATIONS FROM SIX CONTINENTS COMPETING NATIONS FROM SIX CONTINENTS
eight fewer events took place compared to 2015. had ramifications for Kuwaiti sportsmen and sportswomen in
2016, including those who competed as Independent Olympic
83 70
This was in part due to the fact that a number of summer Athletes at the Rio Games.
Olympic sport international federations do not host events in
Olympic years as the magnitude of the Games would outdo The effect of warfare and conflict continues to linger in some 2015 2016
the prestige of a world championship held in the same year. parts of the world, which also has a significant impact on the
Sports such as badminton, canoeing, judo, weightlifting ability of athletes in these places to train, qualify and compete EVENTS EVENTS
and wrestling each host annual senior world championships, at world championships and multisport games. This was
except in an Olympic year. applicable to a nation like Syria, which has been engulfed in
67 16 53 17
a civil war since 2011. In 2012, Syria sent ten athletes to the
The focus for federations in the months preceding the Olympic Games and the 11 athletes to the Paralympic Games.
SUMMER WINTER SUMMER WINTER
Olympics tends to be on regional qualification events, For the 2016 edition, there were seven Syrian competitors
which reward athletes with the final places available at the in the Olympics, and two in the Paralympics, in addition to
Olympic Games. two athletes of Syrian origin who competed under the flag of
the Refugee Olympic Team, and one under the Independent 9 MULTISPORT
GAMES 74 WORLD
CHAMPIONSHIPS 5 MULTISPORT
GAMES 61 WORLD
CHAMPIONSHIPS
While fewer world championships and multisport games also Paralympic Athletes Team.
mean fewer athletes taking part, there were other reasons
for the lower number of participants in 2016 than in previous
years. The one that gained the most attention was the fall-out 69,703 43,164
from the Russian doping scandal and the McLaren Report.
Russia, one of the traditional powerhouses of world sport,
ATHLETES 59.4% / 40.6% ATHLETES 56.4% / 43.6%
would be represented by fewer athletes than originally
intended at the Olympics, and not at all at the Paralympics.
Russia had originally intended to send 387 competitors to the
8.6% 91.4% 13.7% 86.3%
Olympics, and 267 to the Paralympics. DOMESTIC OVERSEAS DOMESTIC OVERSEAS
47 4.9 40 4.7
AVERAGE NUMBER OF AVERAGE CONTINENTAL REACH AVERAGE NUMBER OF AVERAGE CONTINENTAL REACH
COMPETING NATIONS FROM SIX CONTINENTS COMPETING NATIONS FROM SIX CONTINENTS
*Male / Female split calculated using mixed-gender events for which data was available Source: Sportcal research
† Domestic / Overseas split calculated using events for which data was available
184 © and database right 2017 Sportcal Global Communications Ltd. All Rights Reserved © and database right 2017 Sportcal Global Communications Ltd. All Rights Reserved 185Event Analysis / Global Sports Impact Report 2017 Global Sports Impact Report 2017 / Event Analysis
Event Analysis
The event analysis pages showcase data from the 70 multisport games and
world championships featured in this report, complete with each event’s GSI
Event Rating, and its GSI Event Ranking out of all events in 2016.
Up to 50 individual data points are presented for each of the 70 major
events of 2016, allowing us to analyse and compare the relative impacts
that are created by each event, and include tourism impact insight from
Sportcal’s exclusive bed nights analysis.
GSI EVENT RATING TV AND ONLINE STREAMING COVERAGE
The GSI Event Rating Breakdown details the proportion of the Sportcal’s analysis of TV broadcasters and TV nations is for live,
event’s GSI Event Rating attributed to economic, sporting, delayed and highlights broadcast only.
media and social impacts. Where limited data was available
for an event, this breakdown may score zero for those impacts. Some event pages detail extended TV coverage, which also
For example if there was no television coverage of an event, a includes news and magazine programming.
media impact score will not be included.
Additionally, some event pages detail whether the event was
Each GSI Event Rating was calculated using data which was available to stream online and in some instances the number
made available up to 31 March 2017. of nations for which the stream was available in.
As a result of rounding up or down, the GSI Event Rating Not all international federations and/or local organising
Breakdowns may not total in some cases. Additionally, impact committees measure media data to this extent and therefore
pillar breakdowns are in some cases unavailable. This may be only data which was made available has been included in this
because there was no television media coverage of an event, report.
or there is no data available for the event, in which case N/A
is used. ESTIMATED DATA
BED NIGHTS Data points marked with an asterisk (*) have been estimated
using a combination of factors including international
Bed nights detailed in the event analysis are for ‘participants federation and local organising committee estimates, previous
and media’, comprising athletes, officials (team and technical), event data and official event communication materials.
and accredited media only. The calculations were formed
using the methodology detailed in the Sports Tourism chapter.
The calculations give an insight into the number of bed nights
each event generates, before a single ticket is sold, or before
overseas spectators are counted.
Sportcal’s participant and media bed nights methodology
does not take into account whether accommodation was paid
for by visitors or by organisers/hosts.
242 © and database right 2017 Sportcal Global Communications Ltd. All Rights Reserved © and database right 2017 Sportcal Global Communications Ltd. All Rights Reserved 243Event Analysis / Global Sports Impact Report 2017 Global Sports Impact Report 2017 / Event Analysis
Event Analysis Event Analysis
Youth Olympic Winter
Olympic Games 2016 Games 2016
Sport Organiser Statistics Sport Organiser Statistics
Olympics Rio 2016 Organising Committee ECONOMIC
Olympics Lillehammer 2016 Organising ECONOMIC
Total Attendance 6,150,000* Committee Total Attendance 212,604
Owner City, Nation Owner
Ticketed Attendance - Ticketed Attendance -
International Olympic Rio de Janeiro, Brazil City, Nation
Non-Ticketed Attendance - International Olympic Non-Ticketed Attendance -
Committee Venues 37 Committee Lillehammer, Norway Venues 10
Event Frequency BED NIGHTS BED NIGHTS
Date Visitor type Est. bed nights Date Event Frequency Visitor type Est. bed nights
Every four years
Athletes 168,600 Athletes 13,800
05 Aug - 21 Aug Officials - Team 82,500
12 Feb - 21 Feb Every four years Officials - Team 13,000
Officials - Technical 37,500 Officials - Technical 5,200
Accredited Media 312,000 Accredited Media 5,100
2016 GSI Overall Ranking GSI Event Rating 2016 Total 600,600 2016 GSI Overall Ranking GSI Event Rating 2016 Total 37,100
1st out of 70 events 10,102 pts SPORTING
Competitors - Total
Men / Women 6,178
11,237
5,059
8 th
out of 70 events 2,349 pts SPORTING
Competitors - Total
Men / Women 567
1,060
493
GSI Event Rating Breakdown Overseas / Domestic 10,774 463 GSI Event Rating Breakdown Overseas / Domestic 987 73
Continental Reach 6 Continental Reach 6
Competing Nations 207 Competing Nations 70
(includes Independent Olympic Athletes (IOA) due OFFICIALS
to Kuwait suspension and the Refugee Olympic Team -
29% 26% 22% 24% Team (ROT))
OFFICIALS
58% 20% 13% 9% Technical
MEDIA
-
Team - TV Continental Reach -
ECONOMIC SPORTING MEDIA SOCIAL Technical 3,009 ECONOMIC SPORTING MEDIA SOCIAL TV Nations 98
MEDIA Broadcasters 39
Competing Nations By Continent TV Continental Reach - Competing Nations By Continent Extended TV Coverage: Nations 142
TV Nations 220 Extended TV Coverage: Broadcasters 43
Broadcasters 218 Streamed Online Yes
Accredited Media 25,721 Accredited Media 653
SOCIAL SOCIAL
50 Volunteers 40,000 46 Nations Stream Available Worldwide
29 EUROPE 4 EUROPE Volunteers 3,278
NORTH
AMERICA 43
ASIA
Event Hosting
NORTH
AMERICA 12
ASIA Event Hosting
EDITIONS
First Edition 1896 EDITIONS
54 Number of Editions 28 2 First Edition 2012
12
AFRICA
17
OCEANIA
CONTINENTAL REACH
Africa 0 4
AFRICA
2
OCEANIA
Number of Editions
CONTINENTAL REACH
2
SOUTH Asia 3 SOUTH Africa 0
AMERICA AMERICA Asia 0
Europe 16
North America 6 Europe 2
Oceania 2 North America 0
South America 1 Oceania 0
South America 0
Past/Future Editions Past/Future Editions
2008 2012 2016 2020 2024 2012 2016 2020 2025
Beijing, China London, United Rio de Janeiro, Brazil Tokyo, Japan TBA Innsbruck, Austria Lillehammer, Norway Lausanne, TBA
Kingdom Switzerland
284
284 © and database right 2017 Sportcal Global Communications Ltd. All Rights Reserved © and database right 2017 Sportcal Global Communications Ltd. All Rights Reserved 285
285Sports and Events 320 © and database right 2017 Sportcal Global Communications Ltd. All Rights Reserved © and database right 2017 Sportcal Global Communications Ltd. All Rights Reserved 321
Sports and Events / Global Sports Impact Report 2017 Global Sports Impact Report 2017 / Sports and Events GSI EVENT RESEARCH SCOPE 2016 (70 EVENTS) SPORT EVENT SPORT EVENT Archery Indoor Archery World Championships 2016 Luge Luge World Championships - Artificial Track 2016 Archery World Field Archery Championships 2016 Modern pentathlon Modern Pentathlon World Championships 2016 Athletics IAAF 16th World Indoor Athletics Championships 2016 Modern pentathlon UIPM Biathle and Triathle World Championships 2016 Athletics IAAF World Race Walking Team Championships 2016 Olympics Olympic Games 2016 Athletics IAAF/Cardiff University World Half Marathon Championships 2016 Olympics Youth Olympic Winter Games 2016 Badminton TOTAL BWF Thomas & Uber Cup Finals 2016 Orienteering Nokian Tyres World Orienteering Championships 2016 Baseball LG Presents WBSC Women’s Baseball World Cup 2016 Paralympics Paralympic Games 2016 Basketball FIBA 3x3 World Championships 2016 Racquetball IRF World Championships 2016 Beach handball World Beach Handball Championship 2016 Roller sports World Roller Speed Skating Championships 2016 Biathlon World Biathlon Championships 2016 Rowing 2016 World Rowing Senior, U23 and Junior Championships Bobsleigh Bobsleigh & Skeleton World Championships 2016 Sailing ISAF Women's Match Racing World Championship 2016 Boxing AIBA Women's World Championships 2016 Shooting ISSF World Championship Running Target 2016 Cricket ICC World Twenty20 2016 Short track speed skating World Short Track Speed Skating Championships 2016 Curling Ford World Women's Curling Championship 2016 Ski jumping FIS Ski Flying World Championships 2016 Curling World Men's Curling Championship 2016 Soccer Copa América Centenario 2016 Cycling - BMX UCI BMX World Championships 2016 Soccer Oceania Nations Cup 2016 Cycling - cyclo-cross UCI Cyclo-Cross World Championships 2016 Soccer UEFA Euro 2016 Cycling - indoor UCI Indoor Cycling World Championships 2016 Softball WBSC Women's Softball World Championship 2016 Cycling - mountain bike UCI Mountain Bike & Trials World Championships (XCO, XCE, XCR) 2016 Speed skating World Allround Speed Skating Championships 2016 Cycling - mountain bike UCI Mountain Bike Marathon World Championships 2016 Speed skating World Single Distances Speed Skating Championships 2016 Cycling - road UCI Road World Championships 2016 Speed skating World Sprint Speed Skating Championships 2016 Cycling - track UCI Track World Championships 2016 Sport climbing IFSC World Championships 2016 Diving FINA Diving World Cup 2016 Squash PSA Men's World Championship 2016 Fencing Fencing World Championships 2016 Squash PSA Women's World Championship 2015 (Delayed) Figure skating World Figure Skating Championships 2016 Surfing 2016 INS ISA World Surfing Games Floorball Floorball Men's World Championships 2016 Swimming FINA World Championships (25m) 2016 Futsal FIFA Futsal World Cup 2016 Synchronized skating World Synchronized Skating Championships 2016 Games Americas Masters Games 2016 Table Tennis Perfect 2016 World Team Table Tennis Championships Games Asian Beach Games 2016 Taekwondo 2016 WTF World Taekwondo Team Championships Golf Ryder Cup 2016 Triathlon ITU Cross Triathlon World Championships 2016 Ice hockey 2016 IIHF Ice Hockey Women's World Championship Triathlon ITU Long Distance Triathlon World Championships 2016 Ice hockey 2016 IIHF Ice Hockey World Championship Triathlon ITU Triathlon Mixed Relay World Championships 2016 Ice hockey World Cup of Hockey 2016 Triathlon ITU Winter Triathlon World Championships 2016 Ju-jitsu JJIF World Championships 2016 Triathlon ITU World Triathlon Series 2016 Karate World Karate Championships 2016 Wakeboard IWWF Cable Wakeboard World Championships 2016 322 © and database right 2017 Sportcal Global Communications Ltd. All Rights Reserved © and database right 2017 Sportcal Global Communications Ltd. All Rights Reserved 323
Sports and Events / Global Sports Impact Report 2017 Global Sports Impact Report 2017 / Sports and Events WORLD CUPS, LEAGUES, SERIES AND TOURS (70 PROPERTIES) SPORT EVENT SPORT EVENT American Football Canadian Football League (CFL) 2016 Rugby Union Pro12 2015-2016 American Football National Football League (NFL) 2016 Rugby Union Rugby Championship 2016 American Football NCAA National College Football (Division I-FBS) 2016 Rugby Union Six Nations Championship 2016 American Football NCAA National College Football (Division I-FCS) 2016 Rugby Union Super Rugby 2016 American Football NCAA National College Football (Division II) 2016 Rugby Sevens World Rugby Sevens Series American Football NCAA National College Football (Division III) 2016 Soccer Australian A-League 2015-2016 Athletics World Marathon Majors 2016 Soccer Brazilian Serie A 2016 Australian Football AFL Premiership 2016 Soccer Chinese Super League 2016 Baseball Major League Baseball (MLB) 2016 Soccer Dutch Eredivisie 2015-2016 Baseball Minor League Baseball (MiLB) 2016 Soccer English Championship 2015-2016 Baseball Nippon Professional Baseball (NPB) 2016 Soccer English Premier League 2015-2016 Basketball Euroleague 2015-2016 Soccer French Ligue 1 2015-2016 Basketball Spanish Liga ACB 2015-2016 Soccer German Bundesliga 1 2015-2016 Basketball National Basketball Association (NBA) 2015-2016 Soccer German Bundesliga 2 2015-2016 Basketball NCAA Men's Basketball (Division I) 2015-2016 Soccer Italian Serie A 2015-2016 Basketball NCAA Men's Basketball (Division II) 2015-2016 Soccer Japanese J1 League 2016 Basketball NCAA Men's Basketball (Division III) 2015-2016 Soccer Mexican Liga MX 2015-2016 Basketball NCAA Men's Basketball (Reclassifying teams) 2015-2016 Soccer Major League Soccer (MLS) 2016 Biathlon Biathlon World Cup 2015-2016 Soccer Spanish La Liga 2015-2016 Cricket Big Bash Twenty20 Cricket League 2015-2016 Soccer AFC Champions League 2015-2016 Cycling Giro d'Italia 2016 Soccer Copa Libertadores 2015-2016 Cycling Tour de France 2016 Soccer UEFA Champions League 2015-2016 Cycling Vuelta a España 2016 Soccer UEFA Europa League 2015-2016 Golf PGA Tour 2016 Tennis Australian Open 2016 Golf The Open Championship 2016 Tennis French Open 2016 Handball EHF Champions League 2015-2016 Tennis US Open 2016 Ice hockey German Eishockey Liga 2015-2016 Tennis Wimbledon 2016 Ice Hockey National Hockey League (NHL) 2015-2016 Tennis Davis Cup 2016 Ice hockey Swiss National League A 2015-2016 Tennis Fed Cup 2016 Motor Racing Formula One 2016 Tennis ATP World Tour 2016 Motor Racing MotoGP 2016 Tennis WTA Tour 2016 Rugby League National Rugby League (NRL) 2016 Volleyball CEV Champions League 2015-2016 Rugby League Super League 2016 Rugby Union English Premiership 2015-2016 Rugby Union European Challenge Cup 2015-2016 Rugby Union European Champions Cup 2015-2016 Rugby Union French D2 2015-2016 Rugby Union French Top 14 2015-2016 324 © and database right 2017 Sportcal Global Communications Ltd. All Rights Reserved © and database right 2017 Sportcal Global Communications Ltd. All Rights Reserved 325
Tables and Charts

326                       © and database right 2017 Sportcal Global Communications Ltd. All Rights Reserved   © and database right 2017 Sportcal Global Communications Ltd. All Rights Reserved   327
Tables and Charts / Global Sports Impact Report 2017 Global Sports Impact Report 2017 / Tables and Charts
LIST OF TABLES
In order of appearance
CHAPTER TITLE CHAPTER TITLE
Global Sports Impact (GSI) Project GSI: A quick guide Events Bidding and Hosting Top 25 world championships over the 2013-2016 Olympic cycle
Events Bidding and Hosting Nations hosting GSI events throughout 2013-2016 Olympic cycle – Top 10 Events Bidding and Hosting GSI Nations Index – April 2017
Events Bidding and Hosting Top 10 nations hosting events in 2013-2016 Events Bidding and Hosting GSI Nations Index – April 2017 (continued)
Events Bidding and Hosting Top 10 cities hosting events in 2013-2016 Events Bidding and Hosting GSI Cities Index – April 2017
Events Bidding and Hosting Nations hosting GSI events in 2016 – Top 10 Events Bidding and Hosting Operational Cost Overrun at Olympic Games 1992-2016 ($bn at 2015 rates)
Events Bidding and Hosting GSI events hosted in South America in 2016 Events Bidding and Hosting Revenue vs hosting costs at 2010 and 2012 Olympic Games ($bn)
Events Bidding and Hosting Cities hosting two or more GSI events in 2016 Events Bidding and Hosting Revenue vs hosting costs at 2014 and 2016 Olympic Games ($bn)
Events Bidding and Hosting Appendix A – GSI host cities and nations in 2016 Economic Impact Top 25 events by total attendance (2013-2016)
Events Bidding and Hosting Global Sports Bidding Index 2016 – Full results by nation Economic Impact GSI event scope by total attendance – Top 10
Events Bidding and Hosting Global Sports Bidding Index 2016 – Top 5 in detail Economic Impact World championships by total attendance – Top 10
Events Bidding and Hosting Global Sports Bidding Index 2016 – By continent Economic Impact Attendance of major annual sports events in 2016
Events Bidding and Hosting Global Sports Bidding Index 2016 – Top 5 cities Economic Impact Attendance of major annual events in 2015 and 2016
Events Bidding and Hosting Full list of major events awarded in 2016 Economic Impact Top 10 sports properties by total attendance 2015-16 / 2016 (regular season only)
Events Bidding and Hosting Top 20 Global Sports Nations 2011-2024 Economic Impact Top 10 sports properties by average attendance 2015-16 / 2016 (regular season only)
Events Bidding and Hosting Africa - Egypt Economic Impact Attendances at selected non-ticketed events in 2016
Events Bidding and Hosting Asia - China Economic Impact Attendance of selected soccer leagues in 2016
Events Bidding and Hosting Europe - United Kingdom Economic Impact Attendance of selected soccer leagues – year-on-year comparison
Events Bidding and Hosting North America - USA Economic Impact Attendance of selected continental club soccer competitions in 2016
Events Bidding and Hosting Oceania - Australia Economic Impact North American sport total attendance in 2016 - summary
Events Bidding and Hosting South America - Brazil Economic Impact North American sport attendance in 2016 (selected leagues – regular season only)
Events Bidding and Hosting GSI rating points per capita: Top 10 and selected others Economic Impact North American regular and post-season attendance in 2016 (selected leagues)
Events Bidding and Hosting Noticeable climbers in the Global Sports Nations index Economic Impact Men’s American football and men’s basketball US college sport attendances in 2016
Events Bidding and Hosting Noticeable fallers in the Global Sports Nations index Economic Impact Attendance of selected US college sports – year-on-year comparison
Events Bidding and Hosting Top 10 Past Sports Nations (2011-2017) Economic Impact Major tennis events attendances in 2016 – year-on-year comparison
Events Bidding and Hosting Selected major events secured by Brazil post-Olympics Economic Impact Rugby union regular and post-season attendance in 2016 (selected competitions)
Events Bidding and Hosting Top 10 Future Sports Nations (2018-2024) Attendance of selected rugby union club competition attendances –
Economic Impact
Events Bidding and Hosting Selected major events due to be awarded in 2017 year-on-year comparison
Events Bidding and Hosting Top 20 Global Sports Cities 2011-2024 Economic Impact Australian sport attendance in 2016 (selected leagues – regular season only)
Events Bidding and Hosting Significant moves within the top 100 Global Sports Cities Economic Impact Australian regular and post-season attendance in 2016 (selected leagues)
Events Bidding and Hosting Noticeable fallers in the Global Sports Cities index Economic Impact Comparison of selected domestic club ice hockey leagues in Europe
Events Bidding and Hosting Events hosted in Cairo (2011-2024) Appendix: Attendances at major annual sports events in 2015-16/2016
Economic Impact
(GSI 2017 list of events)
Events Bidding and Hosting Events hosted in Tokyo (2011-2024)
Sport Tourism Estimated participant and media bed nights – Top 10
Events Bidding and Hosting Events hosted in London (2011-2024)
Sport Tourism UEFA Euro 2016 – Total bed nights
Events Bidding and Hosting Events hosted in Edmonton (2011-2024)
Sport Tourism Floorball Men’s World Championships 2016 – Total bed nights
Events Bidding and Hosting Events hosted in Auckland (2011-2024)
Sport Tourism Tourism spend at the Rio 2016 Olympic Games (competition days only)
Events Bidding and Hosting Events hosted in Rio de Janeiro (2011-2024)
Sporting Impact Continental distribution of competing nations at global multisport games in 2016
Events Bidding and Hosting Top 10 Past Sports Cities (2011-2017)
Sporting Impact Nation breakdown of the two most recent FINA World Championships (25m)
Events Bidding and Hosting Selected major events secured by Budapest
Sporting Impact Continental distribution of competing nations at world championships in 2016 – Top 10
Events Bidding and Hosting Top 10 Future Sports Cities (2018-2024)
Continental distribution of competing nations at selected continental
Events Bidding and Hosting Top 25 events over the 2013-2016 Olympic cycle Sporting Impact
championships in 2016
328 © and database right 2017 Sportcal Global Communications Ltd. All Rights Reserved © and database right 2017 Sportcal Global Communications Ltd. All Rights Reserved 329You can also read