Electrifying' How government fleets can use new technology to drive EV adoption - Mevo
←
→
Page content transcription
If your browser does not render page correctly, please read the page content below
‘electrifying’
            How government fleets can use new
               technology to drive EV adoption

An analysis of the benefits of car-share to complement the New Zealand
 Government’s commitment to electric vehicle adoption and the flow-on
                   effects of non-traditional attitudes towards transport.

                                                                   March 2021
                    Finn Lawrence & Erik Zydervelt // Founding Directors // Mevo
                                            founders@mevo.co.nz // mevo.co.nz

                                                                          Page 1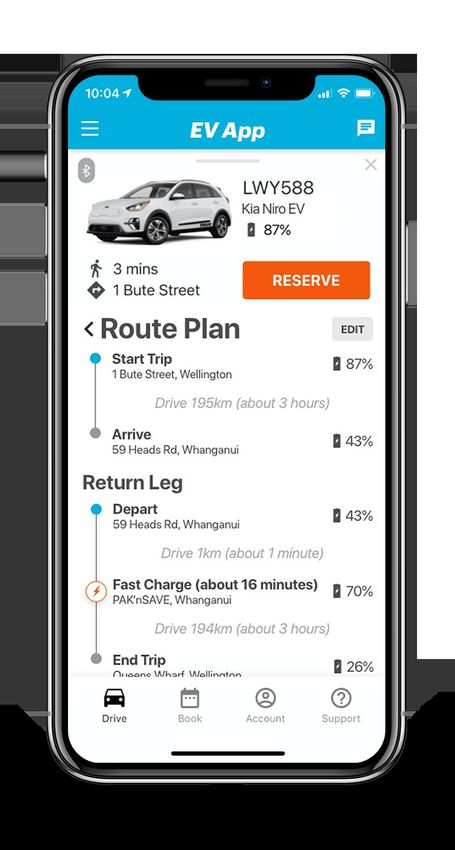
Preface
In December of 2020, the New Zealand Government made a commitment to a one
to one transition of its fleet from internal combustion engine (ICE) vehicles to bat-
tery-powered electric vehicles (BEV). You can find the statement from Labour below1
(and more in appendix 1*).

   “We will also require some Government agencies to purchase electric vehicles for
   their fleets, and decrease the number of vehicles in the Government fleet.”

                                We believe more can be done.

In this paper, we draw on local insights to highlight the benefits of car-sharing in the
context of Aotearoa New Zealand. We will use this research to provide solutions that
will have a positive impact on Kiwis environmentally, socially, and economically.

As we move into the 2020s, we must focus on building futuristic cities and communi-
ties, designed to last far beyond our lifetime. This includes diverse, robust, and equita-
ble transport systems, divorced from the traditional norms we’ve adopted and contin-
ued over the last 135 years, since the original advent of the motorised carriage.

Climate change has been described as this generation’s ‘nuclear-free moment’2 and
implementing bold changes to our transportation system should have the same ef-
fect on our reputation as a clean green nation. However, we do not believe this policy
is as radical as critics may try to make it sound. We instead believe this is simply an
evidence-based approach, using technology available today, and acting with the haste
and care required to address the climate crisis.

             We’d love to hear your thoughts, or if you have any questions,
           please don’t hesitate to get in touch with us: founders@mevo.co.nz

1         New Zealand Labour Party, New Zealand declares climate emergency. NZ Labour Party, January
26 2021, https://www.labour.org.nz/news-climate-emergency
2         Amanda Larsson, Jacinda Ardern’s ‘Nuclear-Free Moment’: Here’s three things that would make
it a reality, Greenpeace, February 2021, https://www.greenpeace.org/new-zealand/story/jacinda-ard-
erns-nuclear-free-moment-heres-three-things-that-would-make-it-a-reality/

Page 2
Summary
We have analysed New Zealand’s existing (predominantly ICE) government fleet and
its carbon impact. We have also further investigated the potential outcome of a full
transition to BEVs, and finally, outline what a mixed-use fleet (serving both the public
and private sectors) could look like. This mixed-use fleet model could be used by cor-
porate fleets as well and will ultimately impact how Kiwis view private car ownership
as a whole.
While reducing carbon emissions is one of our end goals here, we also must consider
that transport itself needs to fundamentally change to support this. We are confident
in our ideals that the fewer cars on the road, the better off we will be, which is why we
look towards a solution that reduces overall cars as well as using BEVs where neces-
sary.
We have found that by switching government fleets to a mixed-use model with the
help of a third-party provider we save money, emissions, and stress on the behalf of
the government workers trying to implement these electrification targets. You can find
the potential carbon savings below, as well as our methodology and explainers on the
transportation research we’ve relied upon.
Our modern alternative option can be adopted in a bottom-up as well as top-down
fashion, allowing individual government employees to drive the change in our trans-
port system, alongside CEOs, CFOs, procurement and fleet managers.
Potential CO2 Emissions
16,000 vehicle NZ Government Fleet, over three years
Internal Combustion Engine vehicles (status quo)
269,872 tonnes
One for one Battery Electric Vehicle replacement (planned)
154,384 tonnes 43% reduction
30% fleet size reduction, BEV replacement, EV Car Share
76,976 tonnes 72% reduction
- 50,000 100,000 150,000 200,000 250,000 300,000
Page 3Car Ownership in New Zealand
New Zealanders have a love affair with cars and private vehicle
ownership. So much so that our country has one of the highest
3rd rates of private car ownership in the world of 802 light vehicles
per 1,000 people in 20183. This is primarily made up of internal
combustion engine vehicles which release emissions into our
atmosphere, further adding to the current climate crisis. An
highest rate of car average passenger car emits approximately 4.6 metric tons of
ownership in the world carbon dioxide each year4, without accounting for the carbon
emissions to manufacture these vehicles.
Nearly all of New Zealand’s transport is fuelled by crude oil, accounting for 21% of our
country’s total emissions, while less than 1% of this transport is powered by renew-
able energy5. While light passenger vehicles are considered less harmful to our envi-
ronment than heavier transport options (often powered by diesel) the electric vehicle
technology we have available could still be utilised to represent a significant CO2 re-
duction.
As of 1 November 2020, there was a combined total of 23,046 new and used EVs on
NZ roads – and we saw an increase of 1,187 new EV sales since December 20196.
This number is well short of the 2016 commitment New Zealand’s Cabinet made to
reach 64,000 electric vehicles on our roads by the end of 20217.
3 Carolin Haenfling, Average age of vehicle fleet [Factsheet], Wellington: Environmental Health
Intelligence Programme, Massey University, February 2021, https://www.ehinz.ac.nz/assets/Fact-
sheets/Released_2020/NumberMotorVehicles_released022020.pdf
4 United States Environmental Protection Agency, Greenhouse Gas Emissions from a Typical
Passenger Vehicle, United States Environmental Protection Agency, February 2021, https://www.epa.
gov/greenvehicles/greenhouse-gas-emissions-typical-passenger-vehicle
5 Energy Efficiency and Conservation Authority, Transport Fuel, Energy Efficiency and Conserva-
tion Authority, February 2021, https://www.eeca.govt.nz/why-energy-matters/energy-opportunities/
transport-fuel/
6 AA Motoring, AA Charged: What happened in 2020, and what will 2021 bring?, AA Motoring,
February 2021, https://www.aa.co.nz/cars/motoring-blog/aa-charged-what-happened-in-2020-and-
what-will-2021-bring/#:~:text=As%20of%201%20November%202020,EV%20sales%20since%20De-
cember%202019
7 Ministry of Transport, Te Hōtaka mō ngā Waka Hiko - Electric Vehicles Programme, Ministry
of Transport, January 2021, https://www.transport.govt.nz/area-of-interest/environment-and-cli-
mate-change/electric-vehicles-programme/#:~:text=Programme%20announced,by%20the%20end%20
of%202021
Page 4Traditional Attitudes
The way we own cars is extremely inefficient - most The average car is in use
cars spend 95% of their lifetime parked8. Howev- just 5% of the time
er, people insist on paying a premium price for car
ownership including petrol, engine maintenance, and
insurance. Many peoples’ private car will be their
second-largest purchase after their home.
Not only are these vehicles inefficient in terms of
usage, but New Zealand cars depreciate massively 95% idle
in value compared with the rest of the world. 2017
research shows that Kiwi cars with an average
odometer 14,000 km per year will have depreciated
by 53.67 per cent on their recommended retail prices the year they were sold9. This
depreciation ranks higher than the United Kingdom, the United States, and Switzer-
land.
In addition to the costs outlined above, the cost of petrol has exponentially increased
and drawn the ire of many New Zealanders. Our pre-tax fuel prices are among the
highest in the OECD and have outstripped many countries in their exponential growth
since 201010.
Continued investments in roading and parking have only exacerbated the issue by
continuing to promote widespread private car ownership as the default way to get
around. The cost to local businesses of lost productivity resulting from congestion in
Auckland alone is estimated to be over $2bn every year11.
As a nation, we have many other transport options beyond private vehicles. With pub-
lic transport such as buses, trains and ferries; taxi alternatives such as Uber and Ola;
car-share; and active transportation such as walking, scootering and cycling - we have
more options than ever before with a lower cost of entry than private car ownership.
However, these options have failed to move the needle in reducing our emissions and
8 David Z. Morris, Today’s Cars Are Parked 95% of the Time, Fortune, February 2021, https://for-
tune.com/2016/03/13/cars-parked-95-percent-of-time/
9 Rob Maetzig, New Zealand has highest car depreciation rate in the world, says study, Stuff.
co.nz, February 2021, https://www.stuff.co.nz/motoring/news/89145417/new-zealand-has-highest-
car-depreciation-rate-in-the-world-says-study
10 Commerce Commission New Zealand, Market study into retail fuel, Commerce Commis-
sion, February 2021, https://comcom.govt.nz/about-us/our-role/competition-studies/fuel-mar-
ket-study?target=documents&root=109412
11 Karen Rutherford, Auckland congestion costing businesses $2 billion a year, Newshub, Febru-
ary 2021, https://www.newshub.co.nz/home/money/2018/03/auckland-congestion-costing-busi-
nesses-2-billion-a-year.html
Page 5more can be done to find solutions to minimise car ownership. New Zealanders are locked into a cycle of vehicle ownership and many associated environmental indica- tors are moving in the wrong direction. For every electric car bought in New Zealand in 2018, kiwis bought 64 mostly-diesel double cab utes12. The latest data from the Environmental Health Indicators New Zealand (EHINZ) re- vealed that collectively, New Zealanders spent an average of 150.4 million hours trav- elling to work every year. Almost three quarters (73.5%) of all commuting time was as a driver of a private vehicle, and 6.4% was a passenger in a private vehicle13. This percentage is significant when compared with pedestrian travel (9.2%), public transport (6.5%) and bicycle travel (2.1%). However, we Almost 80% of New Zealand’s have seen that the appetite for multi-modal commuting is as the driver or transport is there with Auckland Lime users passenger of a private car taking more than 2 million trips within a year of Lime’s launch14. This diverse transport pro- file primarily applies to condensed, inner-city areas since public and active transport in rural parts of New Zealand is not yet fit for purpose. Under-investment in public transport is com- pounded by our private car obsession; why take the bus to work if it’s expensive, infrequent, and crowded, when you already own a car? Conversely, high rates of private car ownership make the case for public trans- port investment difficult if nobody is riding it. Solutions are needed that provide a true alternative to private car ownership, without the sunk-cost effects of actually owning a car; that is, that driving it for all your journeys comes at a low perceived cost. Encouraging Kiwis to rely on multi-modal transport and getting rid of individual- ly owned private vehicles as the default standard will have a positive impact on our emissions profile and the health of every day New Zealanders. Continued investment in public transport, cycling and walking infrastructure must be paired with creative solutions to provide access without ownership to private cars for when it’s required. 12 Bernard Hickey, NZ’s addiction to double-cab utes is going to make carbon neutral by 2050 impossible, The Spinoff, February 2021, https://thespinoff.co.nz/business/04-11-2018/nz-has-a-dou- ble-cab-ute-addiction-and-its-killing-our-climate/ 13 Patrick Hipgrave, Commuting time by mode of transport. [Factsheet], Wellington: Environmen- tal Health Intelligence Programme, Massey University, February 2021, https://www.ehinz.ac.nz/indica- tors/transport/main-mode-of-transport-to-work/ 14 Laine Moger, Lime e-scooters one year on: More than two million trips in the first year, more to come, Stuff.co.nz, February 2021, https://www.stuff.co.nz/auckland/116493077/lime-escooters-one- year-on-more-than-two-million-trips-in-the-first-year-more-to-come Page 6
Our Existing Government Fleet
New Zealand’s Government agencies currently have a fleet of approximately 16,000
vehicles, the majority of which use internal combustion engines. While accurate usage
information from our government fleets isn’t readily available, we estimate from our
analysis that much like private vehicles, the government fleet is likely only being used
5% of the time.

While many departments may report an internal utilisation of around 20-30%, typically
this is measured as a percentage of office hours - excluding evenings and weekends,
when the vehicles are parked. Across a whole week, this results in a real utilisation of
5-7% - not materially better than the average car. This is a result of a lack of alterna-
tive options for peak use times, meaning fleets must be procured with extra capacity.

In the below example, we examine low carbon transition options in a fictitious scenario
of a government department with a fleet composed of 100 vehicles. This fleet uses
only ICE vehicles, in line with the most recent government fleet findings where electric
vehicles made up less than one per cent15. We use hypothetical data which mimics the
data we would find when doing an emissions audit on any government department
(data sources and carbon equivalents can be found in *Appendix 2).

Current state emissions of an ICE fleet
The department has data which shows that 40 of their fleet cars travel 20,000km
per year, 30 cars travel 15,000km per year, and 30 cars travel 10,000km per year. It
will retain its fleet for three years before rolling it over. Additionally, the department
spends approximately $1.5m per year on taxis, travelling around 500,000km, and the
same distance again in rental cars.

We calculate the department’s total travel distance over a three-year period:

   Source                 Quantity       Km/Year        Years       Total (km)
   Fleet Car              40             20,000         3           2,400,000
   Fleet Car              30             15,000         3           1,350,000
   Fleet Car              30             10,000         3           900,000
   Taxi Travel            1              500,000        3           1,500,000
   Rental Car Travel      1              500,000        3           1,500,000

15     New Zealand Government Procurement, Reducing government fleet emissions, New Zealand
Government Procurement, February 2021, https://www.procurement.govt.nz/broader-outcomes/re-
ducing-emissions-and-waste/reducing-government-fleet-emissions/

                                                                                      Page 7
And subsequently the total carbon emissions over the three-year period, including
20% of the vehicles’ built carbon cost, based on a 15-year average lifespan:
Source Unit Quantity kg CO2-e/unit Total CO2-e (t)
Fleet Cars Car 100 1,315 131.5
Fleet Car Travel Km 4,650,000 0.198 920.7
Taxi Travel Km 1,500,000 0.225 337.5
Rental Car Travel Km 1,500,000 0.198 297.0
Total (t) 1686.7
Current carbon impact
We see that if this department continued in a business as usual scenario with its com-
bustion-engine fleet, it would emit a total of 1,686.7t CO2-e over the next three years,
made up of 131.5t of built emissions from its fleet vehicles, and 1,555.2t of operating
emissions from its fleet, taxi, and rental car travel.
An analysis of a 1:1 switch
While switching our fleets from ICE to BEVs is a great first step, this government com-
mitment also represents a huge opportunity for world-leading change. A one to one
transition will rob us of the chance to fundamentally shift our attitudes towards ve-
hicle ownership, especially with one of the highest rates of private vehicle ownership
per capita in the OECD.
To understand the effects of a fully BEV government fleet, we must look at the emis-
sions we are likely to save. It is important to remember that the aim of these mea-
sures is to meet New Zealand’s national targets under the Paris Climate Accord16.
Estimated EV fleet emissions
If the department replaces its ICE cars with BEVs, it can reduce its emissions substan-
tially. While BEVs have no tailpipe emissions, we include carbon as a result of elec-
tricity generation and delivery, and, as with our ICE example, 20% of the vehicle’s built
carbon cost (accounting for 3 years of an average vehicle’s 15-year life).
The department selects the Hyundai Ioniq as it’s preferred vehicle - a mid-range, bat-
tery-electric vehicle with more than 300km range from each charge.
16 Ministry for the Environment, About New Zealand’s emissions reduction targets, Ministry for
the Environment, February 2021, https://www.mfe.govt.nz/climate-change/climate-change-and-gov-
ernment/emissions-reduction-targets/about-our-emissions#:~:text=New%20Zealand’s%20target%20
under%20the,levels%20for%20that%20same%20period.&text=Find%20out%20more%20about%20
the%20Paris%20Agreement
Page 8If the department changes only the model of its fleet cars to BEV, we can calculate the
emissions over a three-year period below:
Source Unit Quantity kg CO2-e/unit Total CO2-e (t)
Fleet EVs Car 100 2,141 214.1
Fleet EV Travel Km 4,650,000 0.025 116.3
Taxi Travel Km 1,500,000 0.225 337.5
Rental Car Travel Km 1,500,000 0.198 297.0
Total (t) 964.9
The potential impact of a fully-EV fleet
We see that by making the switch to EVs, this department emits a total of 964.9t
CO2-e, made up of ~214t of built emissions from its fleet vehicles, and ~750t of oper-
ating emissions from its fleet, taxi, and rental car travel.
Our example department has reduced its ground transport emissions by almost 43%
by making this change, avoiding around 720t of CO2-e emissions over a three-year pe-
riod. While its operating emissions have reduced by just over 50%, the built emissions
of their new EVs are higher than the ICE vehicles they replaced.
Further emission reductions are possible as taxi and rental car suppliers make the
move to BEVs over time.
Cost to facilitate this transition:
One thing to be aware of is the cost of installing electric vehicle chargers in govern-
ment buildings, and the administration this kind of undertaking can bring. In this sce-
nario, the government department has installed 100 EV charging stations to facilitate
this transition, at a cost of between $10,000-20,000 each ($1-2m project cost), on
top of the approximate incremental $1.5m on the purchase of the BEV vehicles.
Page 9Positive impacts of free-floating car share Free-floating car-share is a concept that has existed in Wellington since 2018. This model of transport allows users to rent a car for as little time as they like for a fixed minute, hourly, or daily rate. The cars can be returned anywhere within a large area of the city, in nearly any council parking space, allowing users to leave cars behind for others to use, and limiting the amount of time these cars spend idle. Users can also use these cars for trips from the CBD to the airport and vice versa, which is ideal for travellers who only need a car for a short amount of time. The pricing of a free-floating car-share includes all operating costs and admin involved with insurance, recharging (or fuelling for hybrids), and parking. Within a given city, the vehicles can usually be found within a short walk, and the positioning of cars is active- ly managed by the provider to position them close to businesses who are using them. Research from the Wellington City Council has shown that for each free-floating car- share vehicle that is available, approximately 11 private cars are taken off the road17, reducing traffic congestion and emissions. This is possible because free-floating shared cars are frequently in use over 30% of the time - or around 8 hours per day - taking 3-5+ trips from as many different drivers in this time. Our solution - reducing the size of the government fleet and incorporating a third party car-share manager Government departments could save money, reduce emissions, and streamline many of their operations by adopting any of the following approaches: 1. Downsizing fleets as they move to electric vehicles, supplementing the delta with access to a free-floating EV car-share. The magnitude of any Government Depart- ment fleet downsizing should depend on the relevant use case, and heavier down- sizing can be performed over time as existing vehicles reach end-of-life. 2. Adopting EV car sharing to replace some portion of their taxi and/or rental car spend, and accessing immediate cost savings of up to 30%. 3. Installing technology into their remaining fleet vehicles to allow for app-based access, live battery level monitoring, and detailed usage statistics. By aligning their vehicle technology supplier with their shared EV supplier, departments can addi- tionally benefit from a shared user experience across their fleet. 17 Wellington City Council, Car share schemes driving force for eco-city status, Wellington City Council, February 2021, https://wellington.govt.nz/news-and-events/news-and-information/ news/2020/09/car-share-schemes Page 10
For our fictitious government department, we can broadly categorise three types of
vehicle use when analysing a potential transition:

• Regular use is composed of trips that occur on a repeated basis and can be fore-
  cast well ahead of time e.g. quarterly site visits.

• Peak use is composed of trips that are sporadic and can’t be well forecast e.g. sup-
  plier or client meetings.

• Remote use covers trips that can’t usually be done in a fleet car, e.g. city to airport
  (taxi) or travel in a different city (rental car).

The chart below shows an example before and after comparison of adopting a shared
EV solution to supplement lower-used fleet vehicles, and replace most taxi and rental
car travel.

 Travel Mode                    Fleet Vehicles                   Taxi        Rental Cars

     Use Type           Regular                   Peak                   Remote

 Travel Mode              Fleet Vehicles                    Shared EVs

     Use Type           Regular                   Peak                   Remote

We can observe several key benefits of this approach:

• Immediate cost savings of ~30% from reduced taxi spend

• Comparable costs for rental car replacement, while maintaining a single supplier
  and user experience

• An approximate 30% smaller required fleet base, delivering savings both in the cap-
  ital and operating cost from fewer required parking spaces and less management
  overhead

                                                                                   Page 11
Additionally, if the incoming fleet EVs are fitted with new technology, multiple benefits can mitigate fleet electrification challenges: Driver experience • App-based booking and lock/unlock for fleet EVs. • Single interface and user-experience for a majority of vehicle use (fleet and shared EVs). • EV route planning including charging sta- tion stops, live battery levels, and instruc- tional information on charging the select- ed EV. Battery management • Live battery readouts of fleet vehicles, and whether they are plugged in and charging. • Allocation of drivers to vehicles based on the planned route and current charge level. • Automatic scheduling of charging time between trips, based on projected use and battery level. Charging station installation Optionally, departments could choose to leverage third-party ground operations teams to manage some or all of their operational needs, resulting in: • Fewer or no charging stations needing to be installed (EV charging managed off- site). • Monitoring and management of onsite charging stations (ensuring vehicles are connected etc). • Optional management of fleet EV cleanliness and servicing. Government departments using travel booking platforms can also leverage this tech- nology to present their fleet vehicles as travel options for appropriate trips. This pres- ents additional opportunities for savings by redirecting travel that would have gone to a third-party on to internal assets. Page 12
Emission reductions from shared EVs
Our example government department decides to replace a portion of its fleet, taxi, and
rental car use with shared EVs. Analysing its fleet data, it assesses that it can comfort-
ably lose the 30 least-utilised fleet cars from its Wellington office building (30% of its
fleet) and that 75% of its taxi and rental car use is able to be replaced by free-floating
car-share in Wellington and Auckland.

While total travel distances remain unchanged, we can see the new distance from
each source:

   Source                                   Quantity Km/Year        Years   Total (km)
   Fleet EV                                 40         20,000       3       2,400,000
   Fleet EV                                 30         15,000       3       1,350,000
   Taxi Travel                              1          125,000      3       375,000
   Rental Car Travel                        1          125,000      3       375,000
   Shared EV (Fleet Replacement)            1          300,000      3       900,000
   Shared EV (Taxi Replacement)             1          375,000      3       1,125,000
   Shared EV (Rental Car Replacement) 1                375,000      3       1,125,000

Resulting in emissions over a three-year period:

   Source                 Unit         Quantity         kg CO2-e/unit Total CO2-e (t)
   Fleet EVs              Car          70               2,141           149.8
   Fleet EV Travel        Km           3,750,000        0.025           93.8
   Taxi Travel            Km           375,000          0.225           84.4
   Rental Car Travel      Km           375,000          0.198           74.3
   Shared EV Travel       Km           3,150,000        0.025           78.8
                                                        Total (t)       481.1

Leveraging shared EVs to reduce fleet size and consolidate its ground transport, this
department emits a total of ~481t CO2-e, made up of ~150t of built emissions from
their fleet vehicles, and 331t of operating emissions from its fleet, taxi, rental car, and
shared EV travel.

In this example, our department has reduced its ground transport emissions by 71.5%
and its operating emissions by almost 78%, compared with an ICE fleet option.

Compared with an EV fleet option, the total carbon emissions are reduced by almost
50%, and operating emissions are reduced by around 56%.
                                                                                      Page 13
Fewer vehicles need to be purchased and maintained by the department, saving addi-
tional money on charging stations, parking spaces, and maintenance. The department
also benefits from around $330k in annual savings from switching the bulk of their
taxi spending to shared EVs.
This department’s transition - replacing 30% of their fleet travel, and 75% of their rent-
al car and taxi spend - has underwritten around 150 shared BEVs across two cities.
These vehicles, however, are able to be used by other departments and businesses,
encouraging them to also go electric. Notably, these vehicles are also able to be used
by the public - instead of sitting idle in a garage during the nights and weekends.
And since each of the ~150 shared EVs replaces about 11 private cars, this results in
more than 1500 cars being taken off the road for good.
Emissions Comparison
The below table summarises and compares the possible carbon emission reduction for
our fictitious Government Department within these three scenarios:
ICE Fleet Vehicles 1,687 tonnes
1:1 BEV Transition 965 tonnes
30% Fleet Reduction, BEV Example Government Department
481 tonnes
+ EV Car Share Transport CO2-e over three years
Page 14The Solution in Context
The example calculations in this document are based on a fleet of 100 cars. This
makes the numbers absolutely gargantuan when applying the emissions profile to our
16,000 strong government fleet:
ICE Fleet Vehicles 269,920 tonnes
1:1 BEV Transition 154,400 tonnes
30% Fleet Reduction, BEV All of Government Fleet (16,000)
76,960 tonnes
+ EV Car Share Transport CO2-e over three years
The transformative effects of this solution are made possible by focusing on using
fewer vehicles as well as using cleaner vehicles. Sharing vehicles across Government
Departments, the private sector, and members of the public, means that each vehi-
cle is much better utilised. Sharing the sunk cost of vehicles means that other, more
environmentally friendly transport choices are encouraged alongside shared car use.
A government-wide transition to EV car-sharing as outlined (30% of fleet vehicles, ma-
jority of taxi and rental car spend) would subsidise around 25,000 shared EVs across
every major centre in New Zealand, and take more than a quarter of a million private
cars off the road.
Ripple Effects of Our Solution
The three scenarios we’ve explored represent significant savings in both carbon emis-
sions and government spending, but there are further benefits to this scheme.
• The flow-on benefits to the second-hand BEV market of a government transition
are significant in a 1:1 scenario and increased in the case where the government
leverages EV car-share. Car share vehicles are replaced more often than fleet vehi-
cles, leading to higher turnover and more availability on the second-hand market
• By leveraging an EV car share to supply a percentage of its fleet, taxi, and rental car
demand, the government is able to underwrite shared electric vehicles that can be
used by the public in the evenings, weekends, and holidays, massively accelerating
EV uptake and taking thousands of vehicles off the road for good.
• Government use will require dedicated electric vehicle chargers all across the coun-
try, meaning our charging infrastructure will boom for everyone’s benefit.
• By contracting the technology in government fleet EVs to a third party, government
Page 15workers receive 24/7 support from dedicated experts on BEVs. This will alleviate
anxiety around using BEV technology for drivers and managers.
• This third party technology will also help those government workers that aren’t
well-versed in BEVs plan their journeys and be more aware of their vehicle’s charge
so mishaps are less frequent.
• Car-sharing complements both public transport and active forms of transportation.
A recent study in the United States from Car2go found that 20% of respondents
reported an increased level of walking when using the car-share service18.
• And as mentioned previously, by being the first country to introduce this type of
scheme we will solidify our place as one of the most committed countries to ad-
dressing climate change.
Conclusion
The climate emergency is upon us, and with every day we delay action, the eventual
cost to overcome it increases. Conversely, evidence-based, actionable solutions with
order-of-magnitude impacts exist - if only we can stop to reimagine the future.
In this paper, we have outlined how pragmatic changes to how the New Zealand Gov-
ernment resources its ground transportation can generate enormous change; envi-
ronmental, financial, and social. But, the opportunity for this change isn’t limited to the
public sector - any business or individual can choose to be part of the climate solution,
and re-design the way they move.
We invite you to join us in building a better transport future: one where we use re-
sources more efficiently, get people where they need to go more effectively, and live in
our cities and communities more sustainably.
Start a conversation with us: founders@mevo.co.nz
Acknowledgements
Rhiannon Hughes and Sam Sinnott from Sling & Stone, for pulling it all together.
The Mevo Team, Board, Partners and Members for making it all possible.
18 Elliot Martin & Susan Shaheen, The Impacts of Car2go on Vehicle Ownership, Modal Shift, Ve-
hicle Miles Traveled, and Greenhouse Gas Emissions: An Analysis of Five North American Cities, Inno-
vative Mobility Research, February 2021, http://innovativemobility.org/wp-content/uploads/2016/07/
Impactsofcar2go_FiveCities_2016.pdf
Page 16Appendices
Appendix 1: New Zealand’s history of climate commitments
1992 New Zealand signs the United Nations Framework Convention on
Climate Change, committing to undertake voluntary actions to reduce
emissions to 1990 levels by 200019.
1997 New Zealand signs the Kyoto Protocol. Legally binding emission reduc-
tion targets are applied to individual developed countries.
2010 New Zealand joins 89 other countries in making a voluntary pledge to
reduce or limit greenhouse gas emissions by 2020 as part of the Can-
cun Agreements.
2011 New Zealand pledges to reduce greenhouse gas emissions to 50% be-
low the 1990 levels by 2050 at the Durban conference.
2013 New Zealand announces a target to reduce greenhouse gas emissions
to 5% below our 1990 emissions by 2020 in line with the updated Kyo-
to Protocols.
2015 New Zealand finalises our nationally determined contributions (NDC)
with a target of reducing greenhouse gas emissions to 30% below
2005 levels by 2030. The target is equivalent to an 11% decrease
below 1990 levels and represents a progression on our target for the
period to 2020 (which was -5%).
2016 New Zealand ratifies the Paris Agreement which will take effect from
2020. Our NDC will therefore apply from 202120.
2019 New Zealand passes the Climate Change Response (Zero Carbon)
Amendment Act with a target of net zero carbon emissions by 205021.
2020 New Zealand’s government declares a climate emergency, joining at
least 38 other countries across the globe. In this announcement the
government commits to electrifying its vehicle fleet and becoming
carbon neutral by 202522.
19 New Zealand Foreign Affairs and Trade, Our climate change targets, New Zealand Foreign
Affairs and Trade, February 2021, https://www.mfat.govt.nz/en/environment/climate-change/meet-
ing-our-targets/
20 Ministry for the Environment, About the Paris Agreement, Ministry for the Environment, Feb-
ruary 2021 https://www.mfe.govt.nz/climate-change/why-climate-change-matters/global-response/
paris-agreement
21 Ministry for the Environment, Climate Change Response (Zero Carbon) Amendment Act,
Ministry for the Environment, February 2021, https://www.mfe.govt.nz/climate-change/zero-car-
bon-amendment-act
22 Labour Voices, New Zealand declares climate emergency, NZ Labour Party, February 2021,
https://www.labour.org.nz/news-climate-emergency
Page 17Appendix 2: C02 and vehicle data sources Sourced from The Ministry for the Environment’s Emission Factors Guide 2020: • Operational emissions of a “Medium” combustion engine vehicle (Toyota Corolla) used for fleet combustion-engine and rental car per-km figure: 0.198kg CO2-e/km • Operational emissions of a “Large” battery electric vehicle (Hyundai Ioniq) used for fleet and shared EV per-km figure: 0.025 CO2-e/km • Operational emissions of Taxi Travel, per-km figure: 0.225 CO2-e/km Sourced from The Car Guide: • Toyota Corolla kerb weight: 1,315kg • Hyundai Ioniq kerb weight: 1,529kg Sourced from the Environmentally Best Cars 2019 Report produced by Green Motor- ists (Sweden): • Combustion engine cars, built emissions per kg of kerb weight: 5kg CO2-e (heading 4.3.1, page 8), resulting in built emissions of 6,575kg for Toyota Corolla at 1,315kg kerb weight • Battery electric cars, built emissions per kg of kerb weight: 7kg CO2-e (heading 4.3.2, page 8), resulting in built emissions of 10,703kg for Hyundai Ioniq at 1,529kg kerb weight Sourced from Ministry of Transport: Average age of a light passenger vehicle in NZ as 14.4 years, rounded to 15 years, meaning 20% of a vehicle’s built emissions are costed in it’s three-year use by our ex- ample Government Department: • 1,315kg CO2-e built emissions for a Toyota Corolla over three years • 2,141kg CO2-e built emissions for a Hyundai Ioniq over three years Sourced from Mevo internal data: • Average customer savings vs taxi for short trips in Wellington: 30% Page 18
You can also read