Indian Logistics: Deciphering Storage Space Dynamics and more - March 2018 - JLL India
←
→
Page content transcription
If your browser does not render page correctly, please read the page content below
Indian Logistics:
Deciphering Storage Space
Dynamics and more...
March 2018
Preface
            India’s logistics and warehousing sector is rapidly transitioning through a revolutionary phase.
            There have been multiple initiatives associated with large investments (both domestic &
            international) within this segment, clearly underscoring the upcoming trend. Of course, not to forget
            that India’s logistics industry was recently rewarded with Infrastructure status, thereby providing the
            impetus for added interest and therefore investments.
            As per the Fiscal Budget for 2018, there is a clear push for the logistics sector and an expected
            increase in investment of INR 5.97 trillion in creating and upgrading its infrastructure. With clear
            demarcations for cold storage and ICDs being established, other sectors are also under the scanner
            and their potentials are being analysed. While these are exciting times for the warehousing sector,
            there are other sub-sectors of storages that are undergoing a transformational change too.
            Through this incisive White Paper, we have tried to understand the current market dynamics of
            various storage spaces for different commodities across India, including -

                  COLD              CONTAINER              AGRICULTURE    LIQUID    SPECIALIZED WAREHOUSING
                STORAGE              STORAGE                 STORAGE     STORAGE     STORAGES

            This thought leadership piece also tries to provide an in-depth evaluation of
            the warehousing market across the top 8 cities. Whilst also examining the fact
            that the post GST era will see Tier II & III cities witness increased potential for
            logistics and ancillary services, this syndicated study also tries to appraise the
            investment proposition for each of the above sub-sectors.
            We hope you will find it an interesting read.

                                                                                              Ramesh Nair
                                                                                              CEO & Country Head
                                                                                              JLL, India

1
    Indian Logistics: Deciphering Storage Space Dynamics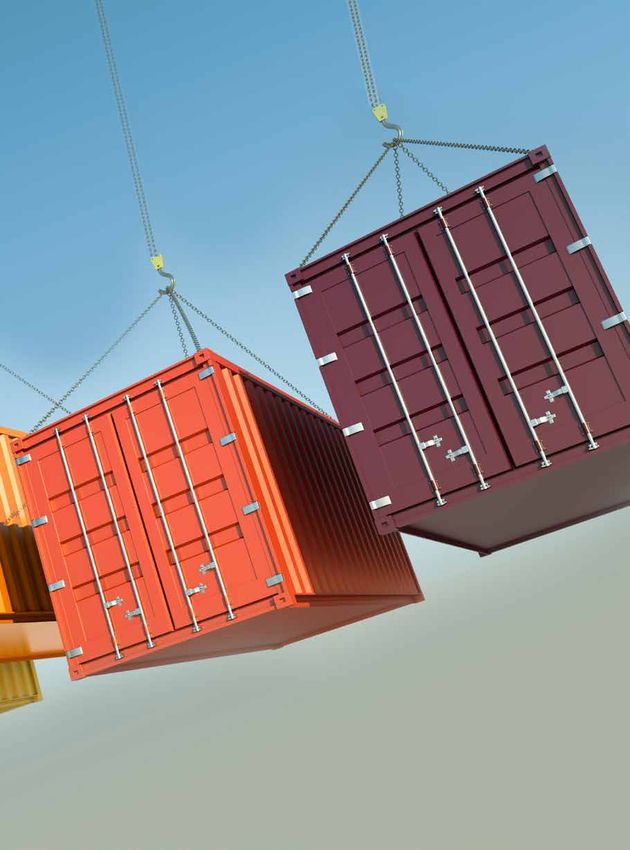
2
Indian Logistics: Deciphering Storage Space Dynamics

Storage Space Dynamics across India

                                     Agriculture Storage         Total Installed capacity,
                                    Capacity in India, 2017                2017
                                           131.8                        21.0
                                           Million MT                 Million TEUs

                         AGRICULTURE STORAGE                   CONTAINER STORAGE

                                 Agriculture Storage area in        Total throughput,
                                         India, 2017                       2017
                                           152.3                         13.7
                                          Million Sq Ft                Million TEUs

3
    Indian Logistics: Deciphering Storage Space Dynamics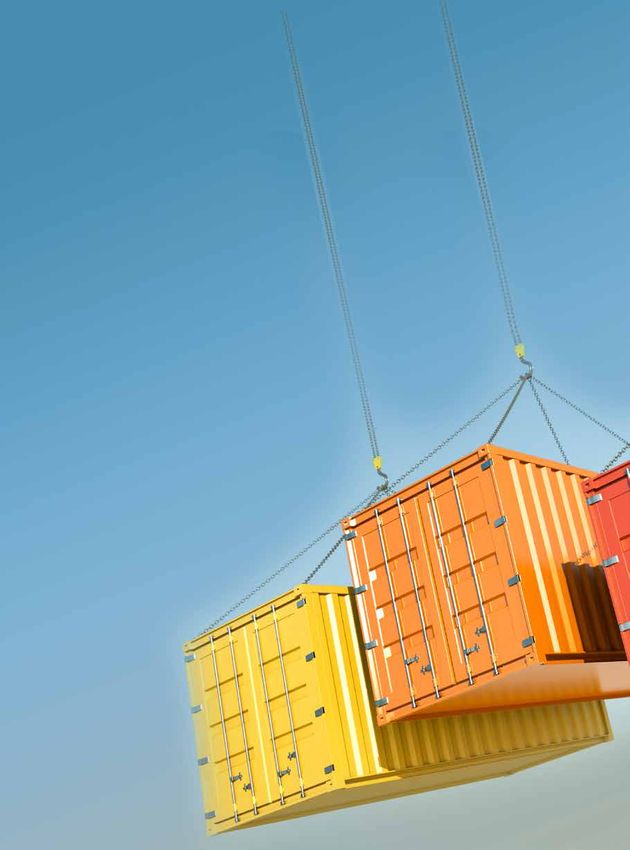
Throughput of liquid bulk cargo            Cold Storage Capacity
handled at major ports in 2017                 in India, 2017
         201.0                                     36.6
          Million MT                              Million MT

  LIQUID STORAGE                          COLD STORAGE                                          WAREHOUSE

                                            Cold Storage area in                            Warehousing Stock 2017 is
                                                India, 2017
                                                                                                      139.8
                                                   42.3                                            Million Sq Ft
                                                Million Sq Ft                               for Grade A and Grade B in
                                                                                           8 Primary Locations in India

                                  10%                                        8%

                                  Source: Central Bank Sri Lanka Report

                                                                                                                                 4
                                                                          Indian Logistics: Deciphering Storage Space Dynamics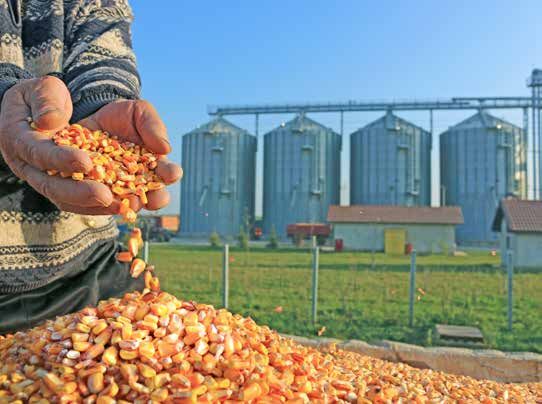
AGRICULTURE STORAGE
                                                                                                                             Agricultural Warehousing
                                                                                                                             involves storage of
                                                                                                                             agricultural products such
                                                                                                                             as food grains, cereals, oil
                                                                                                                             seed, sugar, pulses, spices,
                                                                                                                             fruits and vegetables, etc.

                                                                      SECTOR UPDATE IN INDIA
                                                                               Agriculture Storage Capacity
                                                                      140.0        117.8   117.5           127.0         131.8
            Agriculture Storage                                       120.0                                                                       Agriculture Storage
           Capacity in India, 20171                                   100.0                                                                       area in India, 20171

               131.8                                                                                                                                   150
                                                      Million Tonne

                                                                       80.0

                   Million MT                                          60.0                                                                            Million Sq Ft
                                                                       40.0
                                                                       20.0
                                                                        0.0
                                                                                   2014    2015            2016          2017

                                           Agriculture Storage capacity in India is growing at 4% CAGR (2014-17)
                                                                Source: Warehousing Development & Regulation Authority (WRDA)1

                                    Agriculture Storage Capacity split across public and private sector

                                                                                                    15%
                                                                                                               27   %
                                                                                                               Private
                          Almost
                  73%                                                         28%
                                                                                                                   Sector
                                                                                                                                        The remaining
         of the organised warehouse
        sector is being controlled by                                                                              12%                    27%
                                                                                                                                      of the warehouse
        Government PSUs like Food
         Corporation Of India (FCI),                                                                                                  capacity is held by
     Central Warehousing Corporation                                                                                                  private sector and
      (CWCs) and State Warehousing
                                                                              9%                                                        co-operatives.
           corporations (SWCs) 1
                                                                       73 %
                                                                       Public
                                                                                                     36%

                                                                        Sector
           Food Corporation of India (FCI)        Central Warehouse Corporation(CWC)              State Warehouse Corporation (SWC)    Co-operatives     Private Sector
                    1
                     Source: Warehousing Development & Regulation Authority (WRDA), Annual Report 2015-16 ( http://wdra.nic.in/) and JLL Analysis

5
    Indian Logistics: Deciphering Storage Space Dynamics
Exports of Indian                                                                 Hub of processed food
             agricultural products                                                                  India is emerging as a sourcing
            Indian exports included                                                                 hub for processed
           INR 187.91 billion worth                                                                 foods thereby
             of agriculture products                                                                increasing the
                         in Q1 FY17 2                                                               requirement of agriculture storage

                                                    GROWTH DRIVERS
                                Fair price shop are slowly                Union Budget 2018 has proposed
                                 diminishing, paving way                  expansion of warehouse depository and
                                 for the private players to               specific exports and imports related
                                          enter this sector               measures in the agriculture sector

                                                                          CHALLENGES
                                                                         Private sector is not getting        Inefficient logistic
                                                              competitive rentals as the government           management
                                                                 offers storage spaces at low prices          resulting in wastage

                                                                                    2%                   With advanced and developed
      MAJOR PLAYERS                                                                                      mechanism of agri-warehouses
                                                                                            21%
                                                                                                         the storage and process losses
                                                                                                         which are more than 60% of the
                                                                   41%       Post Harvest
                                                                                                         total share, can be minimized
                                                                               Losses

                                                                                             23%
                                                                                                             Transportation Loss   Processing Losses
                                                                                                             Harvesting Losses     Threshing Yards Loasses
                                                                              13%                            Storage Losses

                                                                                                         1
                                                                                                          Source: Warehousing Development &
                                                                                                         Regulation Authority (WRDA), Annual Report
                                                                                                         2015-16 ( http://wdra.nic.in/ ) and JLL

                                                                 EXISTING DEMAND AND SUPPLY
                                                                                                                    DEMAND SUPPLY
                                      DEMAND                               SUPPLY

                                                                                                                 HIGH        LOW STABLE

                                 INVESTMENT DYNAMICS
                                                                                                                         INVESTMENT
      SHORT                            MEDIUM                             LONG
      TERM                             TERM                               TERM
                                                                                                             POSITIVE         STABLE       NEGATIVE

2
    https://tradingeconomics.com/india/exports-of-agricultural-products                                                                                      6
                                                                                                    Indian Logistics: Deciphering Storage Space Dynamics
COLD STORAGE
Cold storages are climate
controlled storages for
keeping products at given
temperature suiting product
needs. These include
commodities such as frozen
food, pharma products, fruits
and vegetables, etc.
SECTOR UPDATE IN INDIA
Cold Storage Capacity in India
40 31.8 32.8 34.9 36.6
Cold Storage Capacity (Mn MT)
35
Cold Storage Capacity in Cold Storage area in
30
India, 20173 India, 20173
36.6 60.0
25
20
Million MT 15 Million Sq Ft
10
5
0
2014 2015 2016 2017
Cold Storage capacity is growing at 5.0% CAGR (2014-17)
3
Source: Ministry of Agriculture & Ministry of Food Processing Industries and JLL
Total Cold Storage Capacity 100%
25%
of the storage is
used for storing
multiple items Mild Chill (10-20 degree C)
25% This 25% storage
caters to storage of Sub-tropical fruits, Dairy
products, Chocolate, Seeds
high value commodity
100% and hence it has high
investment potential
Chill (0-10 degree C)
Fresh Fruits and
for private players due Vegetables, Fresh meat,
75%
of the storage is
Total Cold Storage
Capacity
to the higher rental
yield associated with it
Fish, Dairy, Pharmaceutical
Frozen (below -0 degree C)
used for storing compared to government Frozen vegetables and fruit,
public storages Other items like -ice-cream,
horticulture butter, fish and meat products
crops including 75%
potatoes1 Storage used for storing multiple items Storing horticulture crops including potatoes
Source: JLL and Report on Cold Chain, 2015 and 2016 by Ministry of Agriculture & Ministry of Food Processing Industries (http://nccd.gov.in/Meetings.html)
3
7
Indian Logistics: Deciphering Storage Space DynamicsGROWTH DRIVERS
Growth in FMCG sector of around 9.2% Growth in pharma sector India - 2nd largest producer
CAGR (2011-2016) indicating higher of around 11% CAGR (2011- of Fruits and Vegetables in
demand for food and grocery items 2017) also indicates increasing the world is growing at 12%
which has cold storage requirement 4 demand for cold storage5 CAGR (2009-15)6
CHALLENGES
Low supply of quality cold storage has
lead pharmaceutical tenants to either use
temperature controlled reefer containers for
temporary storage or invest additional amounts
in existing cold stores for improvements
MAJOR PLAYERS
High Operating Cost - USD 60 in India vs USD
30 in US as the energy consumption in India is
higher as well as infrastructure is inadequate7
Infrastructural challenge needs to
be dealt in such a way that the operational
cost decreases and efficiency increases, in
order to make this sector lucrative
EXISTING DEMAND AND SUPPLY
DEMAND SUPPLY
DEMAND SUPPLY
HIGH LOW STABLE
INVESTMENT DYNAMICS
INVESTMENT
SHORT MEDIUM LONG
TERM TERM TERM
POSITIVE STABLE NEGATIVE
4
Indian FMCG Industry Analysis Report, IBEF, 2017
5
Indian Pharmaceutical Industry Analysis Report, IBEF, 2017
6
JLL; http://apeda.gov.in/apedawebsite/six_head_product/FFV.htm - APEDA ; http://www.freshfel.org/docs/FAQ/Fact_Sheet_-_world_production_2009_-_2013.pdf
7
http://indiacoldchainshow.com/retail-cold-chain-challenges-opportunities/ 8
Indian Logistics: Deciphering Storage Space DynamicsLIQUID STORAGE
The liquid storage tank
facilitates the storages of
liquid bulk such as crude,
petroleum products,
chemical and edible oil.
SECTOR UPDATE IN INDIA
Ports & Refineries with liquid storage facility
The liquid bulk cargo are
currently handled across
23 ports and 21 refineries
BHATINDA
NUMALIGARH DIGBOI
PANIPAT
BONGAIGAON GUWAHATI
MATHURA
GUJARAT
JAMNAGAR KANDLA BINA
MUNDRA BARAUNI
BEDI SIKKA
DAHEJ KOLKATA
HAZIRA
PIPAVAV VADODARA HALDIA
MUMBAI
JNPT PARADIP
VISAKHAPATNAM
MORMUGAO
TATIPAKA KAKINADA
KRISHNAPATNAM
KARWAR
MANGALORE MAJOR PORTS
ENNORE NON-MAJOR PORTS
COCHIN CHENNAI REFINERY
KARAIKAL
VIZHINJAM
TUTICORIN
9
Indian Logistics: Deciphering Storage Space DynamicsThroughput of liquid bulk cargo handled at Major Ports
Throughput of liquid 250
Traffic handeled (In million tonnes)
187 189 196 201
bulk cargo handled at CAGR is growing at
200
major ports in 2017 the rate of
201
Million MT
150
3%
100
50
0
2014 2015 2016 2017
Source: JLL; Ports, IBEF Report 20171
GROWTH DRIVERS
Rise in Development of infrastructure
import and like Airport, Seaports and
export of Freight Lines which would
liquid bulk cargo increase POL consumption
MAJOR PLAYERS
CHALLENGES
Constraint capacity of the existing ports -
Growth rate is moderate as the ports have
constraint capacity to handle liquid storage. Growth
rate will increase once the ports start expanding
their capacity of handling liquid bulk cargo
EXISTING DEMAND AND SUPPLY
DEMAND SUPPLY
DEMAND SUPPLY
HIGH LOW STABLE
INVESTMENT DYNAMICS
INVESTMENT
SHORT MEDIUM LONG
TERM TERM TERM
POSITIVE STABLE NEGATIVE
10
Indian Logistics: Deciphering Storage Space DynamicsCONTAINER STORAGE
CONTAINER STORAGE IS
DONE ACROSS THE FOLLOWING
STORAGE FACILITIES
CFS - Container Freight Station
ICD - Inland Container Depot
PFT - Private Freight Terminals
SECTOR UPDATE IN INDIA
Container Throughput in Major & Non-Major Ports
15.0 11.5 12.5 13.7
Total throughput
Total Installed capacity
(FY 16-17)
13.7
(FY 16-17) 10.0
Million TEU
21.0
Mn TEUs 5.0
Mn TEUs8
0.0
2015 2016 2017
Major Ports Non Major Ports
Source: JLL; Ports, IBEF Report 2017
Container traffic is
growing at a pace of 9%
CAGR (2015-17)8
Container handling at the Non- APM Terminals Pipavav, Adani International
Major ports which is growing at 22% Container Terminal & Mundra International
CAGR (2015-2017) has outpaced Container Terminal are contributing to the
growth at the Major ports8 growth of non-major ports
8
Source: Indian Ports Association and Indian Container Market report of 2017, 2016 & 2015, Drewry & Gateway research
(http://containersindia.in/pdf/CI%20REPORT-2017-FI-FI-f.pdf) and JLL
11
Indian Logistics: Deciphering Storage Space DynamicsCFS (Container freight station): These are located
near ports and offer services for handling and
temporary storage of import/export laden and with
customs and other agencies. They are competent to
clear goods for home use, warehousing, temporary
admissions, re-export, temporary storage for
onward transit and outright export.
GROWTH DRIVERS
Proposition of new ports and additional capacity
augmentation of existing ports will boost growth
in CFS. However, the implementation of Direct Port
Delivery (DPD) will still be a treat to the growth of CFS
MAJOR PLAYERS
CHALLENGES
Direct Port Delivery (DPD) to cut down the
dwell time and transaction cost by moving
the containers direct from the port to the
customer instead of routing them via CFS.
With DPD coming into picture use of CFS
will decrease in the near future
EXISTING DEMAND AND SUPPLY
DEMAND SUPPLY
DEMAND SUPPLY
HIGH LOW STABLE
INVESTMENT DYNAMICS
INVESTMENT
SHORT MEDIUM LONG
TERM TERM TERM
POSITIVE STABLE NEGATIVE
12
Indian Logistics: Deciphering Storage Space DynamicsCONTAINER STORAGE IS
DONE ACROSS THE FOLLOWING
STORAGE FACILITIES
ICD - Inland Container Depot
These are dry ports equipped for handling and temporary
storage of containerized cargo, where in hinterland
customers can receive port services more conveniently.
It offers services related to customs department, carriers,
freight forwarders, customs brokers etc. to facilitate exporters
and importers for smooth handling of cargo.
GROWTH DRIVERS
Despite of the over supply scenario the whole sector is bound
to experience high demand in future with the completion
of Dedicated Freight Corridor which will facilitate easy
transport of large volume of cargo which will increase
the use of ICD
MAJOR PLAYERS
CHALLENGES
The major challenge in this sector is the over
supply scenario of ICD compared to the stagnant
demand, reflected in the fact that the container
market is growing at a stable growth rate of 9%
EXISTING DEMAND AND SUPPLY
DEMAND SUPPLY
DEMAND SUPPLY
HIGH LOW STABLE
INVESTMENT DYNAMICS
INVESTMENT
SHORT MEDIUM LONG
TERM TERM TERM
POSITIVE STABLE NEGATIVE
13
Indian Logistics: Deciphering Storage Space DynamicsPFT - Private Freight Terminals
ICD facilitated rail connections are PFTs. They deal with
rail based cargo including container. They allow for single
end user like manufacturer, consumer, etc. to own a
freight terminal with private rail siding.
GROWTH DRIVERS
Going forward the The Indian Railways
government approach of have given approval to
modal shift from road to the scheme allowing
rail is bound to boost the PFTs on railway land
growth of PFTs adjacent to stations
MAJOR PLAYERS
CHALLENGES
The major challenge in this
segment is of getting suitable
land with private rail siding
EXISTING DEMAND AND SUPPLY
DEMAND SUPPLY
DEMAND SUPPLY
HIGH LOW STABLE
INVESTMENT DYNAMICS
SHORT
TERM
MEDIUM
TERM
INVESTMENT
LONG
TERM
POSITIVE STABLE NEGATIVE
14
Indian Logistics: Deciphering Storage Space DynamicsSPECIALIZED STORAGE
Free Trade & Warehousing Zones (FTWZ)
FTWZ is a special category of Special Economic Zones
which is a mega-trading hub with a focus on trading and
warehousing for various types of cargo like temperature
controlled cargo, dry cargo, containerized and bulk cargo, etc.
GROWTH DRIVERS MAJOR PLAYERS / OPERATORS
• The benefits offered by FTWZ OF FTWZ IN INDIA
are like Deferred duty wherein
custom duty is payable only when
commodities are sold and not
when they are imported and are Arshiya Northern FTWZ,
Khurja, Uttar Pradesh
also exempted from payment of tax,
thereby reducing the logistics costs
• GST implementation to reduce tax Hari Fertilizers, Ralhupur,
Adani Ports and SEZ Uttar Pradesh
hurdles significantly FTWZ, Mundra, Gujarat
Arshiya FTWZ, Nagpur,
CHALLENGES Maharashtra MAJOR PLAYERS
Arshiya FTWZ, Panvel, Maharashtra
Karanja FTWZ in JNPT SEZ
• The growth of this sector Infrastructure, Fab City SPV, Ranga
Uran, Maharashtra Reddy, Telangana
depends on EXIM opportunity Lepakshi Knowledge
and the associated norms offered Hub, Andhra Pradesh
ISPRL, Karnataka
by the country J. Matadee Free Trade Zone,
Chennai, Tamil Nadu
• Transhipment opportunity offered Notified Operational FTWZs
Cochin Port Trust, Kerala Notified FTWZs
by FTWZ is not fully utilised as India FTWZs with in-principal Approval
has a small share and slow growth
of transhipment good
EXISTING DEMAND AND SUPPLY
DEMAND SUPPLY
DEMAND SUPPLY
HIGH LOW STABLE
INVESTMENT DYNAMICS
INVESTMENT
SHORT MEDIUM LONG
TERM TERM TERM
POSITIVE STABLE NEGATIVE
Source: Special Economic Zones of India website by Ministry of Commerce & Industry Department of Commerce
15
(http://www.sezindia.nic.in/asez-special-zones-notified-2005.asp)
Indian Logistics: Deciphering Storage Space DynamicsData / Document Storage
Document / Data storage is the process of handling documents
in such a way that information can be created, shared, organized,
stored efficiently and appropriately within a large warehouse
to store possessions in hard / file format or even soft / scanned
format for easy retrieval, when required.
GROWTH DRIVERS
Document / Data storage As such, operators
facilities are most often used are able to achieve
by companies for storage of high occupancy
MAJOR PLAYERS files & data. With shrinking rates and good
office sizes, storage and filing returns for this
is often outsourced new-entry format
With only a few brand leader in the country at present,
growth opportunity exists for a brand that is well positioned
and offers high quality and easily accessible facilities.
CHALLENGES
Data / Document storage Local operators are
market in India is still at an fragmented and most
early stage of development. of them operate from
However, the potential is large informal storage space
EXISTING DEMAND AND SUPPLY
DEMAND SUPPLY
DEMAND SUPPLY
HIGH LOW STABLE
INVESTMENT DYNAMICS
INVESTMENT
SHORT MEDIUM LONG
TERM TERM TERM
POSITIVE STABLE NEGATIVE
16
Indian Logistics: Deciphering Storage Space DynamicsWAREHOUSING
17
Indian Logistics: Deciphering Storage Space DynamicsSECTOR UPDATE IN INDIA
Top 8 Cities - Grade A and Grade B Warehouse Stock & Vacancy, 2017*
37.16
40 19% 20%
Warehouse Space (Mn sqft)
35 18%
14% 16%
30 28.04 16%
15.02 14%
25 30.88 14% 11%
11% 12%
20 18.63 23.34 9% 11% 10%
10% 7% 13.79 11.24
15 9% 6% 8%
10.60 11.60 6%
6.04 5% 6%
10 4% 5.24 8.70
8.00 4%
5 4.42 2%
6.27 8.03 8.98 8.55 3.69 2%
4.70 3.60 2.54
0 0.66 0%
NCR DELHI BENGALURU PUNE MUMBAI CHENNAI AHMEDABAD KOLKATA HYDERABAD
Warehousing
Stock 2017
139.8
Million Sq Ft
For Grade A & Grade B in
8 Primary Locations
TOP NATIONAL PLAYERS Grade A Grade B Vacancy (%) Grade A Vacancy (%) Grade B
Hike in the supply of Grade A Stabilisation in the Supply
Stock Market
Stock has substantially Grade A and Grade B Stock is
increased post-GST lementation expected to stabilise in 2020-2021
Top 8 Cities - Grade A and Grade B Warehouse Stock Projections*
15% CAGR (2014-16) 21% CAGR (2017-19) 20% CAGR (2020-21)
Pre - GST Implementation Post - GST Implementation
297.0
300.0
Warehouse Space (Mn sqft)
246.5
250.0
204.0
200.0 170.3 180.2
153.9
150.0 139.8
2017 - 2019 is expected to see 113.0 131.4
98.0 112.3
substantial increase in the supply 100.0 85.7 96.6
70.9 80.2
of warehouse stock owing to the 50.0 63.3 92.5 116.7
57.9 72.7
22.4 27.1 32.8 43.3
implementation of the GST which will 0.0
2014 2015 2016 2017 2018* 2019* 2020* 2021*
have a positive effect on warehousing
activities in India due to diminishing Grade A Grade B 2017 - GST is Implemented
state boundaries
Implementation of GST has made way for cost and operationally efficient
Hub & Spoke Model of warehousing and has shifted the end user demand
and developer supply from inefficient, low quality redundant warehouses
to large box, good quality Grade A warehouse
*Note: It does not take into consideration Grade-C, the stock owned by government, ICD, FTWZ and captive warehousing stock by manufacturing
companies that are within or beyond their premises. The warehouse stock and absorption data of the year 2017 have been estimated
Note: The future projections of stock for Grade A and B space is computed taking into consideration future supply of projects
and market conditions in each city. The projections are cumulative total stock
18
Indian Logistics: Deciphering Storage Space DynamicsNCR DELHI
Population (MN) Stock (MN Sq. ft.)* Absorption (MN Sq. ft.)#
WAREHOUSING
CORRIDOR - MARKET 27.2 37.1 4.7
DEMAND SCENARIO *Cumulative stock till 2017; # Stock absorbed in 2017
WAREHOUSING CORRIDOR - NCR DELHI
MAJOR LOCATIONS MARKET DEMAND MONTHLY RENTS (INR/ SQ. FT. / MONTH)
GRADE HIGH / STAGNANT / LOW A B
Delhi LOW NA 15 - 30
Gurgaon HIGH 19 - 21 10 - 18
Faridabad / Palwal STAGNANT 18 - 19 15 -18
Ghaziabad HIGH 17 - 19 14 - 18
Noida & Greater Noida HIGH NA 15 - 21
*NA - Not available
Sonipat HIGH 17 - 19 10 - 17
Panipat LOW NA 15 - 18
Bhadurgarh LOW NA 10 - 12
Rohtak LOW NA 12 - 18
Panipat
Note: National Capital Territory of Delhi is considered as the geographic boundary for population
Sonipat
Rohtak
Bahadurgarh New Delhi Ghaziabad
Greater Noida
Noida
Gurgaon
Faridabad
Pataudi
Daruhera
Palwal
Note: Rental range is indicative only. Actual rents may vary as per specifications, location, size of the land and property as well as target use. Rentals are on BUA.
Source: Delhi Population (20-10-2017). Retrieved 20-10-2017, from http://worldpopulationreview.com//
*It does not take into consideration Grade-C, the stock owned by government, ICD, FTWZ and captive warehousing stock by manufacturing compa-
nies that are within or beyond their premises. The warehouse stock and absorption data of the year 2017 have been estimated
19
Indian Logistics: Deciphering Storage Space DynamicsBENGALURU
Population (MN) Stock (MN Sq. ft.)* Absorption (MN Sq. ft.)#
WAREHOUSING
10.8 18.6 1.8 CORRIDOR - MARKET
*Cumulative stock till 2017; # Stock absorbed in 2017
DEMAND SCENARIO
WAREHOUSING CORRIDOR - BENGALURU
MAJOR LOCATIONS MARKET DEMAND MONTHLY RENTS (INR/ SQ. FT. / MONTH)
GRADE HIGH / STAGNANT / LOW A B
Tumkur Road HIGH 14 - 16 11 - 16
Hosur Road HIGH 18 - 22 15 - 18
Mysore Road STAGNANT 17 - 19 13 -17
Hoskote LOW 17 - 20 13 - 19
Note: Urban agglomeration of Bengaluru, including Bengaluru city and adjacent suburban areas, is considered as the geographic boundary for population
*NA - Not available
Tumkur
Dabaspet
Hoskote
Peenya
Narsapura
Kumbalgodu
Bommasandra
Attibele
Mysore Road
Note: Rental range is indicative only. Actual rents may vary as per specifications, location, size of the land and property as well as target use. Rentals are on BUA.
Source: Bengaluru Population (20-10-2017). Retrieved 20-10-2017, from http://worldpopulationreview.com//
*It does not take into consideration Grade-C, the stock owned by government, ICD, FTWZ and captive warehousing stock by manufacturing compa-
nies that are within or beyond their premises. The warehouse stock and absorption data of the year 2017 have been estimated
20
Indian Logistics: Deciphering Storage Space DynamicsPUNE
Population (MN) Stock (MN Sq. ft.)* Absorption (MN Sq. ft.)#
WAREHOUSING
CORRIDOR - MARKET 6.03 15.0 3.1
DEMAND SCENARIO *Cumulative stock till 2017; # Stock absorbed in 2017
WAREHOUSING CORRIDOR - PUNE
MAJOR LOCATIONS MARKET DEMAND MONTHLY RENTS (INR/ SQ. FT. / MONTH)
GRADE HIGH / STAGNANT / LOW A B
Chakan - Talegaon HIGH 24 - 30 18 - 22
Hinjewadi LOW 30 - 35 24 - 28
PCMC-Bhosari STAGNANT 24 - 30 20 - 25
Nagar Road HIGH 23 - 28 15 - 20
*NA - Not available
Note: Urban agglomeration of Pune, including Pune city and adjacent suburban areas, is considered as the geographic boundary for population
Chakan
Talegaon
Ranjangaon
Phulgaon
Tathwade
PCMC-Bhosari Koregaon Bhima
Hinjewadi Lonikand
Pune City
Shirwal
Note: Rental range is indicative only. Actual rents may vary as per specifications, location, size of the land and property as well as target use. Rentals are on BUA.
Source: Pune Population (20-10-2017). Retrieved 20-10-2017, from http://worldpopulationreview.com//
*It does not take into consideration Grade-C, the stock owned by government, ICD, FTWZ and captive warehousing stock by manufacturing compa-
nies that are within or beyond their premises. The warehouse stock and absorption data of the year 2017 have been estimated
21
Indian Logistics: Deciphering Storage Space DynamicsMUMBAI
Population (MN) Stock (MN Sq. ft.)* Absorption (MN Sq. ft.)#
WAREHOUSING
21.7 28.0 2.0 CORRIDOR - MARKET
*Cumulative stock till 2017; # Stock absorbed in 2017
DEMAND SCENARIO
WAREHOUSING CORRIDOR - MUMBAI
MAJOR LOCATIONS MARKET DEMAND MONTHLY RENTS (INR/ SQ. FT. / MONTH)
GRADE HIGH / STAGNANT / LOW A B
Bhiwandi HIGH 18 - 22 14 - 17
JNPT Vicinity / Panvel STAGNANT 22 - 25 15 - 25
*NA - Not available
Padgha
Note: Urban agglomeration of Pune, including Pune city and adjacent suburban areas, is considered as the geographic boundary for population
Vashere
Sawad
Bhiwandi
Mankoli
Taloja
Panvel
Rasayani
JNPT
Uran
Khopoli
Note: Rental range is indicative only. Actual rents may vary as per specifications, location, size of the land and property as well as target use. Rentals are on BUA.
Source: Mumbai Population (20-10-2017). Retrieved 20-10-2017, from http://worldpopulationreview.com//
*It does not take into consideration Grade-C, the stock owned by government, ICD, FTWZ and captive warehousing stock by manufacturing compa-
nies that are within or beyond their premises. The warehouse stock and absorption data of the year 2017 have been estimated
22
Indian Logistics: Deciphering Storage Space DynamicsCHENNAI
Population (MN) Stock (MN Sq. ft.)* Absorption (MN Sq. ft.)#
WAREHOUSING
CORRIDOR - MARKET 10.4 13.8 2.1
DEMAND SCENARIO *Cumulative stock till 2017; # Stock absorbed in 2017
WAREHOUSING CORRIDOR - CHENNAI
MAJOR LOCATIONS MARKET DEMAND MONTHLY RENTS (INR/ SQ. FT. / MONTH)
GRADE HIGH / STAGNANT / LOW A B
Poonamalle HIGH 25 - 28 20 - 22
Irungattukottai LOW 22 - 25 20 - 22
Sriperumbudur LOW 22 - 25 20 - 22
Oragadam HIGH 25 - 28 22 - 24
Marai Malai Nagar HIGH 25 - 28 22 - 26
Note: Urban agglomeration of Chennai, including Chennai city and adjacent suburban areas, is considered as the geographic boundary for population
Cholavaram - Redhills HIGH 15 - 20 13 - 15
Madhavaram- Puzal HIGH 18 - 22 16 - 20
Ennore - Manali LOW 18 - 20 15 - 18
Periyapalayam Road - Puduvoyal HIGH 13 - 18 12 - 15
*NA - Not available
Puduvoyal
Periyapalayam
Cholavaram
Redhills
Ennore
Puzhal
Manali
Madhavaram
Poonamalle
Irungattukottai
Sriperumbudur
Oragadam
Maraimalai Nagar
Note: Rental range is indicative only. Actual rents may vary as per specifications, location, size of the land and property as well as target use. Rentals are on BUA.
Source: Chennai Population (20-10-2017). Retrieved 20-10-2017, from http://worldpopulationreview.com//
*It does not take into consideration Grade-C, the stock owned by government, ICD, FTWZ and captive warehousing stock by manufacturing compa-
nies that are within or beyond their premises. The warehouse stock and absorption data of the year 2017 have been estimated
23
Indian Logistics: Deciphering Storage Space DynamicsAHMEDABAD
Population (MN) Stock (MN Sq. ft.)* Absorption (MN Sq. ft.)#
WAREHOUSING
7.8 4.3 0.7 CORRIDOR - MARKET
*Cumulative stock till 2017; # Stock absorbed in 2017
DEMAND SCENARIO
WAREHOUSING CORRIDOR - AHMEDABAD
MAJOR LOCATIONS MARKET DEMAND MONTHLY RENTS (INR/ SQ. FT. / MONTH)
GRADE HIGH / STAGNANT / LOW A B
Changodar - Bhayla HIGH 16 - 20 12 - 17
Aslali - Kheda HIGH NA 12 - 20
Sanand STAGNANT 17 - 19 14 -17
Note: Urban agglomeration of Ahmedabad, including Ahmedabad city and adjacent suburban areas, is considered as the geographic boundary for population
*NA - Not available
Chhatral
Kadi
Kalol
Sanand
Aslali
Changodar
Bavla
Goblej
Bhayala
Kheda
Note: Rental range is indicative only. Actual rents may vary as per specifications, location, size of the land and property as well as target use. Rentals are on BUA.
Source: Ahmedabad Population (20-10-2017). Retrieved 20-10-2017, from http://worldpopulationreview.com//
*It does not take into consideration Grade-C, the stock owned by government, ICD, FTWZ and captive warehousing stock by manufacturing compa-
nies that are within or beyond their premises. The warehouse stock and absorption data of the year 2017 have been estimated
24
Indian Logistics: Deciphering Storage Space DynamicsKOLKATA
Population (MN) Stock (MN Sq. ft.)* Absorption (MN Sq. ft.)#
WAREHOUSING
CORRIDOR - MARKET 14.3 11.6 2.0
DEMAND SCENARIO *Cumulative stock till 2017; # Stock absorbed in 2017
WAREHOUSING CORRIDOR - KOLKATA
MAJOR LOCATIONS MARKET DEMAND MONTHLY RENTS (INR/ SQ. FT. / MONTH)
GRADE HIGH / STAGNANT / LOW A B
Dankuni HIGH 20 - 24 18 - 22
*NA - Not available
Kalyani STAGNANT NA 9 - 12
Sirakol STAGNANT 11 - 14 9 - 12
Uluberia STAGNANT 12 - 16 10 - 14
Alampur / Dhulagarh HIGH 16 - 20 14 - 18
Note: Urban agglomeration of Kolkata, including Kolkata city and adjacent suburban areas, is considered as the geographic boundary for population
Kalyani
GT Road
Dankuni
Dhulagarh
Alampur
BT Road
Uluberia
Sirakol
Diamond Harbour
Note: Rental range is indicative only. Actual rents may vary as per specifications, location, size of the land and property as well as target use. Rentals are on BUA.
Source: Kolkata Population (20-10-2017). Retrieved 20-10-2017, from http://worldpopulationreview.com//
*It does not take into consideration Grade-C, the stock owned by government, ICD, FTWZ and captive warehousing stock by manufacturing compa-
25
nies that are within or beyond their premises. The warehouse stock and absorption data of the year 2017 have been estimated
Indian Logistics: Deciphering Storage Space DynamicsHYDERABAD
Population (MN) Stock (MN Sq. ft.)* Absorption (MN Sq. ft.)#
WAREHOUSING
9.5 11.2 1.8 CORRIDOR - MARKET
*Cumulative stock till 2017; # Stock absorbed in 2017 DEMAND SCENARIO
WAREHOUSING CORRIDOR - HYDERABAD
MAJOR LOCATIONS MARKET DEMAND MONTHLY RENTS (INR/ SQ. FT. / MONTH)
GRADE HIGH / STAGNANT / LOW A B
Kompally / Medal HIGH 15 - 17 11 - 14
Shamshadabad HIGH 16 - 20 12 - 14
*NA - Not available
Cherlapally STAGNANT 15 - 17 11 - 14
Uppal / Negole STAGNANT 17 - 20 14 - 16
Patancheru STAGNANT 12 - 15 10 - 13
Note: Urban agglomeration of Hyderabad, including Hyderabad city and adjacent suburban areas, is considered as the geographic boundary for population
Balanagar LOW 17 - 20 14 - 16
Medchal
Kompally
Patancheru
Balanagar
Cherlapally
Secunderabad
Uppal
Shamshabad
Note: Rental range is indicative only. Actual rents may vary as per specifications, location, size of the land and property as well as target use. Rentals are on BUA.
Source: Hyderabad Population (20-10-2017). Retrieved 20-10-2017, from http://worldpopulationreview.com//
*It does not take into consideration Grade-C, the stock owned by government, ICD, FTWZ and captive warehousing stock by manufacturing compa-
nies that are within or beyond their premises. The warehouse stock and absorption data of the year 2017 have been estimated 26
Indian Logistics: Deciphering Storage Space DynamicsEMERGING WAREHOUSING
LOCATIONS
While the top eight cities are witnessing fabulous growth; GST
implementation has taken away the state barrier in storage. Going
forward, location would be a major selection criteria irrespective of
the state. And as a result, tier - II cities are coming into focus. JLL has
identified select cites other than the top eight and evaluated their
potential to become the next growth centre of logistics
LUDHIANA & AMBALA
8 PRIMARY CITIES
AND 30 MAJOR
CHANDIGARH
DEHRADUN
NCR DELHI EMERGING CITIES
JAIPUR
LUCKNOW & KANPUR SILIGURI
JODHPUR
GUWAHATI
GWALIOR
PATNA
AHMEDABAD BHOPAL
KOLKATA
INDORE RANCHI
SURAT
RAIPUR
NASIK NAGPUR
BHUBANESWAR
AURANGABAD
MUMBAI
HYDERABAD
PUNE VISAKHAPATNAM
VIJAYAWADA
BELGAUM
GOA
TIRUPATI
BENGALURU CHENNAI
8 PRIMARY CITIES 30 MAJOR EMERGING CITIES
MANGALORE
COIMBATORE
KOCHI
TIRUCHIRAPPALLI
MADURAI
TUTICORIN Source: JLL Internal Research
27
Indian Logistics: Deciphering Storage Space DynamicsMETHODOLOGY ADOPTED
Parameters taken into consideration
Population of Road Road Distance
the city Connectivity from Port
Presence of Airport Manufacturing Number of Consumer Price Index (CPI)
in the City Potential IEMs filed for Industrial Workers
Human Development Ease of Doing 6 Hours Distribution
Index (HDI) Business Potential
6 Hours Distribution Potential and Composite Logistics Score Index
3.05
Surat
Favorable Locations
2.85
2.65
Better Warehouse - Conducive
2.45 Nasik
Tirupati
Composite Score Index
Coimbatore
Vijayawada Jaipur
2.25 Ranchi
Goa Indore Madurai
Bhopal
Jodhpur Raipur Vapi Ludhiana & Ambala
2.05 Visakhapatnam Indore Kochi Kanpur & Lucknow
Tiruchirappalli
Mangalore Gwalior
1.85
Bhubaneswar Chandigarh
Belgaum Aurangabad
1.65
Guwahati
Patna
Dehradun
1.45
Siliguri
1.25
0 20 40 60 80 100 120 140 160 180
6 Hours Distribution Potential (Million Persons)
Increasing population catered
Source: JLL Internal Research
Disclaimer: Composite Score index is based on various qualitative and quantitative parameters and Distribution Coverage potential is based on
the derivation of population catered / serviced for distribution is arrived from a software based om distances from respective city center covered
by existing road network with an assumption of avg. achievable travel speed depending upon the different types of road (40kms/hrs for NH and
Expressways and 30 km/h SH and other district roads).
28
Indian Logistics: Deciphering Storage Space DynamicsIMPACT OF GST ON WAREHOUSING
Impact: Organizations will now be able to explore a
HUB AND different distribution model instead of the traditional
SPOKE TO carrying and forwarding (C&F) distributor-based models.
RULE Growing demand for Larger Hubs / Regional Distribution
Centre as well as Smaller ‘Spoke’ warehouses
Impact: Post GST, the focus would shift on efficiency rather
than tax saving through smaller warehouses. Companies
CONSOLIDATION to re-structure their warehousing portfolio to bring in larger
‘supply - chain’ efficient warehouses, typically built to their
specific warehouse requirements
Impact: State-border check points for scrutiny and
QUICKER location based tax compliance, which accounts
SUPPLY for almost 60% of a truck’s transit time, can hugely
reduce, thus facilitating quicker supply
EFFICIENT Impact: Efficient warehouse management is expected to
boost the sector as the warehouses are expected to have
AND LARGER that ‘economics of scale’ thus increasing Per Cubic Metre
WAREHOUSES storage efficiency of warehouses.
MORE
Impact: Existing organized warehousing developers
ORGANIZED can expect significant increase in demand. More
LOGISTICS organized players are expected to enter the sector.
PLAYERS
Impact: Warehousing developers are
LARGER investing in larger logistic parks and
INVESTMENTS buying land at strategic locations
REDUCED Impact: Reduction in tax cascading may lead to
COST TO lower cost of production and distribution which
CUSTOMERS can be eventually passed on to consumers.
29
Indian Logistics: Deciphering Storage Space DynamicsAccess to long tenure Borrow from India
funds from insurance Infrastructure Financing
and pension funds Company Ltd (IIFCL)
IMPACT OF
INFRASTRUCTURE
Logistics sector to get
credit on long term basis
STATUS OF Access to funds as
External Commercial
at competitive rates
LOGISTICS Borrowings (ECB)
Indian logistics sector being
granted infrastructure status
Warehousing Facilities: minimum
Cold Chain Facility: minimum
investment of INR 25 crores and
investment of INR 15 crores and
minimum area of 100,000 sq.ft.
minimum area of 20,000 sq.ft.
Multi-modal Logistics Park: minimum
investment of INR 50 crores and
minimum area of 10 acres
Consolidation of warehousing space
near to consumption centers
Demand for better Last mile distribution
infrastructure and centers for in-city
compliant properties distribution
Higher emphasis
TOP Customized
on EHS
compliance
TENANT solutions for easy
operations
TRENDS
Demand from Data centers Buy vs Lease decision -
in industrial areas due to critical factor considering
high power requirements the new IFRS rules in USA
Emphasis on labor, automation and socio-
economic development around locations
30
Indian Logistics: Deciphering Storage Space DynamicsINVESTMENT PROPOSITION
Select Foreign & PE Investments in Indian Logistics Sector
INVESTOR INVESTEE INVESTMENT
(INR CRORES)
YEAR INVESTOR INVESTEE INVESTMENT
(INR CRORES)
KKR TVS Logistics 242 2012 New Silk Route VRL Logistics 206
Everstone Transpole Everstone
Capital Logistics 220 2014 Capital
AS Cargo 277
Warburg Embassy Warburg
Pincus Group 1750 2015 Pincus
Ecom Express 850
Warburg Stellar Value Everstone Shree Kailash
Pincus Chain 850 2016 Capital Logistics 200
IndoSpac Macquire + Logos + Assetz
CPPIB 3,200* 2,800
Ivanhoe’
Ascendas Arshiya 534 Turnit Capital FWS Undisclosed
2017 Mahindra Life
Ascendas FirstSpace 3,800 IFC 600
Space
More than 10,000 Crore invested in 2017 Alibaba XPRESSBEES 224
Disclaimer: Information provided above is collated by JLL from *3 stage deals totalling $ 1.3 Bn with $500 Mn. (Rs. 3,200) invested in JV
various sources. JLL has not verified the investments proposed IndoSpace Core, $700 million for buying additional industrial and logistics
herein and do not take any responsibility on its authenticity. parks and an additional $100 Mn. Investment in IndoSpace Fund III
Sector-wise Private Equity Investments across Asset Classes (2014-YTD 2017)
100% 5% 5% 4% 4%
5% 9% Logistics sector
90% 16% 10% 2%
Total investment flows accounts for
9%
80% 11%
INR 17% 30% 1%
125,000 crores
70%
60% 40% 20%
40%
of private equity invested
across the real estate
from 2014 till date; 42%
50% market in 2017 in India
in the form of equity 40%
30% 59%
47%
20% 38% 35%
10%
0.0
2014 2015 2016 2017YTD
Residential & Township IT & Commericial Entity Retail Warehousing & Infra Others
Source: JLL Analysis
31
Indian Logistics: Deciphering Storage Space DynamicsSUMMARY FINDINGS
SECTOR DYNAMICS INVESTMENT DYNAMICS
SHORT TERM MEDIUM TERM LONG TERM
AGRICULTURE
Majority of supply is controlled by government. High
demand for quality storage of high valued commodities
storage that minimizes loss. Invest with caution for specific
high rent paying commodities in the short term.
COLD STORAGE
Dearth of quality space and good infrastructure in cold
storages definitely calls for investments in the sector.
However, given the inconsistency of power and high tariff
for the same, also calls for investment with caution only
after diligence on basis of infrastructure.
LIQUID STORAGE
Constrained / limited growth of liquid traffic in Indian ports in the
recent past have had an impact on demand for liquid storage.
Additionally, captive storage facilities and direct pipelines access
have further reduced demand for private developers, except for
near ports which handles good volume of liquid cargo.
CONTAINER STORAGE
Container Freight Station (CFS): Implementation of DPD will
be a threat to the growth of CFS in the medium to long term.
Inland Container Depot (ICD): Growing container handling
capacity for Indian port and gradual modal shift from road to
rail is expected to boost the sector in the medium to long term.
Private Freight Terminals (PFT): Going forward the
government approach of modal shift from road to rail is
bound to boost the growth of PFTs.
FREE TRADE & WAREHOUSING ZONES (FTWZ)
Implementation of GST and much needed clarity on FTWZ
norms is expected to bring back the occupier’s interest in
the sector in the medium to long term.
DATA & DOCUMENT STORAGE
Nascent and growing market in the country making it a
potential investment domain in short to medium term.
WAREHOUSING
Implementation of GST has made way for cost and
operationally efficient Hub & Spoke Model of warehousing
and has shifted the end user demand and developer supply
from inefficient, low quality redundant warehouses to large
box, good quality Grade A warehouses. Strong demand and
investment foreseen in short to medium term.
Investment Positive Stable Negative
32
Indian Logistics: Deciphering Storage Space DynamicsWAY FORWARD
Promising and futuristic Policy and
Infrastructure environment for the Logistic
sector exists in India today, and is creating
the most encouraging impact in
revolutionizing the logistics sector
and taking it to the next level of
evolutionary phase.
POLICY LEVEL CHANGES MULTI-MODAL CONNECTIVITY EMBRACE TECHNOLOGY
Infrastructure Status: Logistics Sector Road, Rail & Waterways
Logistics sector to get credit on long Post the completion and commission A number of start-ups are coming
term basis at competitive rates from of DFC, large volume of cargo can easily up to support and fill the gaps
financial institution and access to funds be transported via rail. This is going in the existing fragmented and
as External Commercial Borrowings to be time and cost efficient and the unorganised Indian logistics
(ECB), as well as access long tenure logistics sector is bound to experience industry. These start-ups cater to
funds from insurance and pension funds high demand in future across storage the demands of the specialised
and borrow from India Infrastructure spaces connected to railway facilities deliveries including last mile
Financing Company Ltd (IIFCL) Sagarmala initiative is going to distribution or reverse logistics and
GST Implementation promote port led development use technology to provide services
The implementation of GST has made involving modernization of existing like tracking and fleet visualisation,
way for cost and operationally efficient port and construction of new ports route optimization, real-time driver
Hub & Spoke Model ofwarehouses. It to enhance transportation through tracking, etc. Examples of logistics
is also shifting them industry model coastal shipping. Additionally, the start-ups: LEAP, 4tigo, ElasticRun,
from inefficient, low quality redundant Inland waterways has a vision to Locus, Loginext, Shadowfax, FarEye
warehouses to big box, good quality connect major logistic nodes through and many more
Grade A warehouse transportation through rivers
Indian Government’s increasing thrust on core infrastructure sector is eminent from the all-time high allocation of funds (INR 5.97
trillion) in Budget 2018. This is poised to improve the transport and logistics sector (e.g. railways, roads & highways, maritime, civil
aviation etc.). The country is gradually improving its logistics positioning as seen in the Logistics Performance Index (LPI), wherein
India’s rank has jumped by impressive 19 position to reach 35th rank. The sector indeed has a potential to embrace lot more
positive changes and has a long way to go.
33
Indian Logistics: Deciphering Storage Space DynamicsJLL
27.60+ INDUSTRIAL Services nearly
million sq ft built SERVICES: 43
up area transacted Cities in India
SNAPSHOTS
351 Team of
38
transactions
concluded personnel in 8 cities
1,487 118
acres of land transacted consulting work delivered
*Numbers as on Jan, 2018
Feasibility & Project / Equity
Market Study partner Search
Land Acquisition/
Business Disposal
Location Advisory
JLL INDUSTRIAL SERVICES:
SERVICE OFFERINGS
Supply Chain
Consulting
Business Plan & Entry
Strategy Formulation Individual Asset &
Portfolio Acquisition /
Disposal
Lease Acquisitions -
Ready Built & BTS
34
Indian Logistics: Deciphering Storage Space DynamicsAbout JLL
JLL (NYSE: JLL) is a leading professional services firm that specializes in real estate and investment management. A Fortune
500 company, JLL helps real estate owners, occupiers and investors achieve their business ambitions. In 2017, JLL had
revenue of $7.9 billion and fee revenue of $6.7 billion; managed 4.6 billion square feet, or 423 million square meters; and
completed investment sales, acquisitions and finance transactions of approximately $170 billion. At the end of 2017, JLL
had nearly 300 corporate offices, operations in over 80 countries and a global workforce of 82,000. As of December 31, 2017,
LaSalle had $58.1 billion of real estate assets under management. JLL is the brand name, and a registered trademark, of Jones
Lang LaSalle Incorporated. For further information, visit www.jll.com
JLL has over 50 years of experience in Asia Pacific, with over 37,000 employees operating in 96 offices in 16 countries across
the region. The firm won the ‘World’s Best’ and ‘Best in Asia Pacific’ International Property Consultancy at the International
Property Awards in 2016 and was named number one real estate investment advisory firm in Asia Pacific for the sixth
consecutive year by Real Capital Analytics and ranked among Fortune Magazine’s World’s Most Admired Companies list third
year in a row. www.ap.jll.com
About JLL India
JLL is India’s premier and largest professional services firm specializing in real estate. With an extensive geographic footprint
across 10 cities (Ahmedabad, Delhi, Mumbai, Bangalore, Pune, Chennai, Hyderabad, Kolkata, Kochi and Coimbatore) and
a staff strength of 9,300 the firm provides investors, developers, local corporates and multinational companies with a
comprehensive range of services including research, analytics, consultancy, transactions, project and development services,
integrated facility management, property and asset management, sustainability, industrial, capital markets, residential,
hotels, health care, senior living, education and retail advisory.
The firm was awarded the Property Consultant of the Decade at the 10th CNBC-Awaaz Real Estate Awards 2015 and the Best
Property Consultancy in India at the International Property Awards Asia Pacific 2016-17. For further information, please visit
www.jll.co.in
Industrial Services Business Enquiries
N Srinivas Yogesh Shevade Chandranath Dey
Managing Director Senior Vice President Senior Vice President &
Industrial Services Head of Industrial Transaction Head Industrial Consulting
Srinivas.N@ap.jll.com Yogesh.Shevade@ap.jll.com Chandranath.Dey@ap.jll.com
+91 98454 45495 +91 96197 11280 +91 90999 71598
Author Co-Author Strategic Inputs
Ishita Kachru Shristy Singh Sujash Bera
Senior Executive Executive Manager
Industrial Services Industrial Services Industrial Services
Ishita.Kachru@ap.jll.com Shristy.Singh@ap.jll.com Sujash.Bera@ap.jll.com
+91 98305 43922
Acknowledgement: Charmy Shah & Arjun Malkani - Intern, Industrial Consulting and all the members of Industrial Services team
jll.co.in
Jones Lang LaSalle © 2018 Jones Lang LaSalle IP, Inc. All rights reserved. All information contained herein is from sources deemed reliable; however, no representation or
warranty is made to the accuracy thereof.
Indian Logistics: Deciphering Storage Space DynamicsYou can also read