Towards a Queensland-India - trade and investment strategy Overview
←
→
Page content transcription
If your browser does not render page correctly, please read the page content below

Overview
Towards a Queensland–India
 trade and investment strategy
           August 2018
Mumbai

                                    Bengaluru
                                  (Bangalore)

                                                                                                                       Brisbane

      Trade and Investment Queensland office

      Tourism and Events Queensland office

                                                 Trade and Investment Queensland (TIQ) is the Queensland Government’s dedicated
                                                 global business agency. Through TIQ, the Queensland Government has one of Australia’s
                                                 largest international networks of 15 trade and investment offices in 12 markets.

                                                 Our international presence promotes Queensland goods and services, and facilitates
                                                 investment attraction to Queensland. Led by trade and investment commissioners, the
                                                 offices are a vital connection between international investors and business opportunities
                                                 in Queensland. They provide local expertise in foreign markets, facilitate business
                                                 introductions, and assist inbound and outbound delegations, helping our businesses
                                                 expand their international footprint.

                                                 TIQ’s India office was established in Bengaluru (formerly Bangalore) in 2004. It is
                                                 complemented by the India office of Tourism and Events Queensland, located in Mumbai.

2 Overview: Towards a Queensland-India trade and investment strategy
Foreword
Queensland has a strong and important relationship with India and
it is important that this relationship continues to deepen.

Queensland’s future in the Asian century is bright.            We have the opportunity to expand on our current
                                                               agricultural trade with increased value-adding to
Global growth is shifting east and driving strong
                                                               meet the demands of India’s growing and discerning
demand for what Queensland has – safe food,
                                                               middle class.
abundant resources, trusted services, unmatched tourism
experiences, outstanding skills and knowledge,                 We have the opportunity not only to grow our resource
and a secure environment in which to invest.                   industries and help India develop its own, but also
                                                               to be a part of India’s transition to renewable energy
Last year the Queensland Government launched the
                                                               technologies.
Advancing Trade and Investment – Queensland Trade
and Investment Strategy 2017–2022 with the aim of              And we have the opportunity to dramatically expand our
positioning Queensland as Australia’s most innovative          services sector in education, health care, technology
and dynamic trading economy.                                   and tourism.

Now, we are focusing on building stronger ties with            However, in order to build a relationship of lasting value –
India through growing bilateral trade and investment.          one that builds on the Gold Coast 2018 Commonwealth
Our relationship is grounded in our shared cultural heritage   Games legacy, it cannot be one-sided or based on trade
as members of the Commonwealth, and the Trade and              alone. Our ties with India run deeper than that.
Investment Queensland office in Bengaluru demonstrates
                                                               The fact is that 49,000 people living in Queensland
Queensland’s ongoing commitment to India.
                                                               were born in India. That means Queensland is home
With India already the world’s largest democracy and           to a rich Indian diaspora which forms the foundation
set to become the world’s second-largest economy,              of strong people-to-people relationships between us.
our relationship represents an enormous opportunity            These interpersonal relationships have a compounding
for Queensland to play a supporting role to this               effect and are a key enabler of investment and trade.
economic powerhouse.
                                                               As we seek comment on this document over the coming
And last year I travelled to India to investigate what this    weeks, I look forward to hearing your views on how we
role could entail and promote India’s investment in            can strengthen this critical, enduring relationship.
our state.
                                                               The Queensland Government’s objective is to secure
My Government’s Advance Queensland agenda is all               jobs and prosperity for Queenslanders, leverage existing
about positioning Queensland for the future. Because in        capabilities to solve shared challenges, and embrace
a changing world, standing still is to fall behind.            emerging opportunities, as we play a greater role in the
                                                               great Indian growth story.
This paper is the first step to mapping our existing strong
ties with India and creating an even greater bond as we
make ourselves part of India’s amazing growth story.

                         The Honourable Annastacia Palaszczuk MP
                         Premier of Queensland
                         Minister for Trade

                                                                       Overview: Towards a Queensland–India trade and investment strategy 3
Table of contents
Section                                                                Page

Invitation to participate                                                 5
India’s growth story                                                     6
Our relationship                                                         16
Next steps                                                               23

4 Overview: Towards a Queensland-India trade and investment strategy

INVITATION TO PARTICIPATE

    We are seeking your support to develop a Queensland–India
    trade and investment strategy – together we can put our best foot
    forward to build enduring relationships.

Next steps

  STEP                                STEP                                            STEP
  ONE                                 TWO                                             THREE

  This document is the                Consultation will take                          The final Queensland–India
  first step in a journey             place between August and                        trade and investment
  which will culminate in             September 2018.                                 strategy will aim to
  the development of a                                                                articulate the best way to
                                      Stakeholders from
  Queensland–India trade                                                              increase investment and
                                      Queensland and India in
  and investment strategy.                                                            trade between Queensland
                                      both the private and public
                                                                                      and India.
                                      sectors will be invited to
                                      comment on this document
                                      and to be involved in
                                      the development of a
                                      Queensland–India trade
                                      and investment strategy.

                  To be involved, please email your submission to
                              tiq.info@tiq.qld.gov.au
                                     or write to
                         Trade and Investment Queensland
                     PO Box 12400, Brisbane Qld 4003 Australia
                             See tiq.qld.gov.au for details on closing dates.

                                                              Overview: Towards a Queensland–India trade and investment strategy 5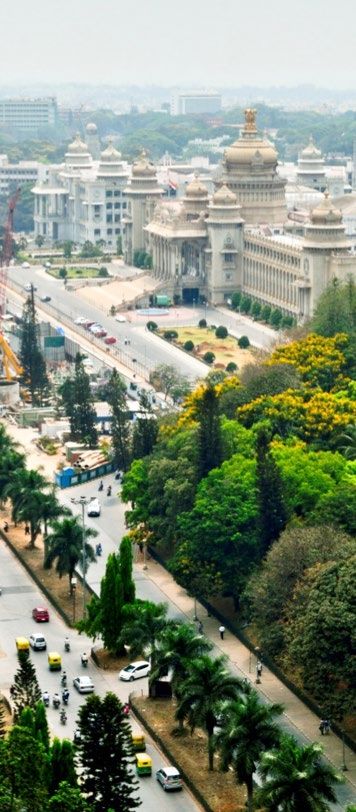
India’s growth story
         • A
            lready the world’s largest democracy, India is also       • N
                                                                          early 30% of India’s population now has access to
           set to become the world’s second-largest economy              the internet and there are expected to be nearly two
           and most populous nation.                                     billion connected devices in India by 2020.
         • India’s size and geography have resulted in multiple       • India is becoming more competitive as a preferred
            regional markets, each with specific characteristics          place to do business, with a number of structural
            and opportunities.                                            reforms planned to further improve the ease of
                                                                         doing business.
         • T o meet the needs of its growing urban population,
            significant investment is planned in India to develop      • T here are a number of flagship government programs
            sustainable cities and infrastructure.                        underpinning the economic development and reform
                                                                          agenda in India today, including Make in India,
         • India has a comparatively young population and its
                                                                          Digital India, Financial Inclusion, Smart Cities, Skill
            middle class is rapidly increasing, with more people
                                                                          India, Clean India, and Startup India. These programs
            moving to urban areas. Shifting demographics and
                                                                          provide a useful foundation for trade and investment
            associated increases in demand for health services
                                                                          efforts between Queensland and India.
            will present opportunities to invest in health care
            infrastructure and establish a universal health            • A
                                                                          s India grows to become one of the world’s largest
            coverage system.                                             economies, Queensland has an opportunity to
                                                                         become an active partner and form strong and
         • T he increasing population of both India and the world
                                                                         enduring relationships.
            will heighten the need for sustainable approaches to
            food and energy production.
         • India’s economy is becoming more regulated,
            providing benefits to government, citizens and
            businesses.

6 Overview: Towards a Queensland-India trade and investment strategy
INDIA’S GROWTH STORY

           Already the world’s largest democracy, India is also set to become
           the world’s second-largest economy and most populous nation.

India’s economy
Gross domestic product rankings and forecast 2016, 2060                                             The world is watching India as it continues on its growth
                                                                                                    trajectory to overtake China as the most populous nation.
  Rank                        2016                                2060                              India is forecast to rise through the global gross domestic
  1                           China                               China                             product (GDP) rankings, potentially emerging as the second-
                                                                                                    largest economy by 2050.
  2                           EU                                  India

  3                           US                                  US                                A nation’s economics are intrinsically linked to its population,
                                                                                                    because it contributes to both production (in terms of available
  4                           India                               EU
                                                                                                    workforce) and overall domestic consumption. To truly
                                                                                                    appreciate the journey that India is taking, it is important to
                                                                                                    consider the rate of change, as well as the forecast size of
Gross domestic product in real terms1                                                               the country.
A$, trillions, 2010–2060
                                                                                                    India’s rapidly increasing momentum will have implications
80                                                                                                  and opportunities for mature economies around the world,
                                                                       China
                                                                                                    including Queensland.
60

40                                                                        India
                                                                                                    Key observations
                                                                                                    • India’s GDP is currently upwards of A$3.5 trillion, and its
20                                                                                                     economy is forecast to be the fastest growing economy
                                                                       Australia                       through to 2050, by which time it will surpass the US and EU
  0                                                                                                    economies to be the world’s second-largest behind China.
   2010           2020          2030           2040           2050          2060                    • In recent years the Indian economy has not realised some of
                                                                                                       the more ambitious growth previously forecast. Nevertheless,
                                                                                                       strong future growth is still expected, with India’s economy in
                                                                                                       2060 forecast to be nearly eight times larger than in 2017.
Indian nominal gross domestic product per capital2
A$, 2000–2023

4,500
4,000
3,500                                                                                                            Key question
3,000                                                                                                            • H
                                                                                                                    ow should businesses position
2,500                                                                                                              themselves to respond to increasing
2,000                                                                                                              demand for goods and services?
1,500
1,000
  500
    0
     2000              2005           2010        2015          2020          2025

1. OECD GDP long-term forecast 2013–2060; Exchange Rate 1 A$ to 1 USD$: 0.7508 (as at 15 May 2018)
2. IMF Gross Domestic product per capita (current prices); Exchange Rate 1 A$ to 1 USD$: 0.7508 (as at 15 May 2018)

                                                                                                                Overview: Towards a Queensland–India trade and investment strategy 7
INDIA’S GROWTH STORY

          India has a comparatively young population and its middle class is
          rapidly increasing, with more people moving to urban areas.

India’s demographic trends
Total population, millions, 2000–2060                                                              As the world’s population continues to grow, greater pressures
                                                                                                   are being placed on the world’s resources.
 2,500
                                                                          India                    As India becomes a wealthier country, so too do its people;
 2,000                                                                                             a burgeoning middle class of a comparatively young and growing
                                                                                                   population will have higher levels of disposable income to spend
 1,500                                                                                             on goods and services not previously accessible.
                                                                         China
 1,000                                                                                             The way that people live will have an impact on their
                                                                                                   consumption patterns and will drive both trade and government
    500                                                                                            investment in services and infrastructure.
                                                                    Australia
        0                                                                                          Key observations
            2000 2010 2020 2030 2040 2050 2060
                                                                                                   • India is likely to overtake China to become the world’s most
                                                                                                      populous country in the next decade and is forecast to
                                                                                                      continue growing until it peaks in around 2060 with over two
India’s population by broad age group, millions, 2015                                                 billion people.

   248        250                                                                                  • G
                                                                                                      DP per capita is 250% higher today than it was in 2000
                         231                                                                         and by 2022 it is forecast to be 50% higher again than it is
                                    196                                                              today (2017: A$2,641).
                                               152
                                                                                                   • T he Indian middle class3 represents around 50% of the
                                                          115                                        country’s population. Its population is also skewed towards
                                                                       72                            the young, with 53.6% of the country’s total population under
                                                                                  45                 30 years’ of age.
                                                                                                   • India has a large working-age population which, between
    0-9       9-19 20-29 30-39 40-49 50-59 60-69 70+                                                  2010 and 2030, is expected to grow by a further 241 million
                                                                                                      people.
Proportion of Indian population in urban areas % 2000-2025                                         • O
                                                                                                      ne-third of India’s population currently lives in urban areas,
                                                                                                     which is expected to increase to 42.5% by 2025.
50
40
30
20                                                                                                         Key question
10                                                                                                         • W
                                                                                                              hat new trade and investment
  0                                                                                                          opportunities are emerging as the
   2000             2005           2010            2015           2020           2025                        demographics of India change?

3. Defined as spending between $2 and $10 per day
Data sources: IMF; United Nations Department of Economic and Social Affairs, Population Division – World Population Prospects; World Bank; United Nations – World Cities Report 2016

8 Overview: Towards a Queensland–India trade and investment strategy
INDIA’S GROWTH STORY

         India’s size and geography have resulted in multiple regional
         markets, each with specific characteristics and opportunities.

  India’s key regional markets
                                                                                       When considering the Indian market, its size and regional
                                                                                       variation mean that individual opportunities are better identified
                                                                                       and pursued on a state or union territory basis.

                                                                                       Key observations
                                                                                       • India is a federal union, comprising twenty-nine states and
                  10                    4                                                 seven union territories. This number has changed in recent
                                                                                          times, with three new states formed in 2000 and another
                                                                                          created in 2014.
          3                     9                      6
                                                                                       • E ach region has unique elements, such as its reform agenda
                                                                                          and key development initiatives, ease of doing business,
                       1                                                                  new sector-specific hubs and zones, and official languages.
                                    8
Trade and                                                                              • In terms of state domestic product, the major states are
Investment                                                                                located in central and southern regions of India.
Queensland’s               5     7
office in
Bengaluru
(Bangalore)                     2

                                                                                               Key question
                                                                                               • H
                                                                                                  ow can India’s regional specialisations and
                                                                                                 expertise be accessed?

        State / Union          Nominal GSDP       Population (m)      Area (km2)             Official language       Specialisations and key markets5
        Territory              A$ billion4

                                                                                                                     Largest cotton producer in India, and Mumbai is a national
  1     Maharashtra                         552               112.4                308,252   Marathi
                                                                                                                     finance hub, home to the Indian stock exchange

                                                                                                                     Diversified manufacturing sector, including automotive,
  2     Tamil Nadu                          315                72.2                130,060   Tamil                   engineering, pharmaceuticals, and textiles. Largest number
                                                                                                                     of factories and industrial workers in India

                                                                                                                     Significant refining capacity, one of India’s largest producers
  3     Gujarat                             295               60.4                 196,244   Gujarati
                                                                                                                     of crude oil (onshore)

  4     Uttar Pradesh                       294               199.8                240,928   Hindi                   Largest producer of food grains in India

                                                                                                                     IT hub of India and home to the fourth-largest technology
  5     Karnataka                           253                61.1                191,791   Kannada                 cluster in the world. The state also has sector-specific special
                                                                                                                     economic zones for key industries (eg IT, biotechnology)

  6     West Bengal                         207                91.3                 88,752   Bengali                 Largest producer of rice and fish in India

  7     Andhra Pradesh                      172                49.7                160,205   Telugu                  Brackish-water shrimps and freshwater prawns

  8     Telangana                           166                35.0                112,077   Telugu, Urdu            Pharmaceuticals

  9     Madhya Pradesh                      163                72.6                 22,429   Hindi                   Rich in natural resources (fuels, minerals) including coal

  10    Delhi                               135                16.8                  1,483   Hindi                   India’s biggest milk market, and a top tourist destination

                                                                                                                    4. GSDP at current prices, exchange rate used: A$1₹= INR 50.68;
                                                                                                                       5. Based on State Budgets 2018–19 PRS Legislative Research

                                                                                                     Overview: Towards a Queensland–India trade and investment strategy 9
INDIA’S GROWTH STORY

          To meet the needs of its growing population, significant investment
          is planned in India to develop sustainable cities and infrastructure.

Increasing infrastructure demand
Number of Indian cities by population size                                                          The combination of India’s increasing population and
Units, 2000–2020                                                                                    urbanisation means that existing cities will be placed under
                                                                                                    additional stress, while at the same time new cities will emerge.
  10 million+            1–5 million   300,000–500,000                                              Significant investment will be required to provide relevant
  5–10 million            500,000–1 million                                                         infrastructure and services.
                                                                 238
250                                                                                                 The demand for new, high-capacity infrastructure and services
                         212                                 2          7                           provides opportunities for domestic and international
                     3          6                                                                   businesses to partner with India throughout design, delivery and
200                                                                60
                                                                                                    management stages.
                          56
150
                                                                   76                               Key observations
                          64                                                                        • T he latest data from the United Nations shows that from 2015
100
                                                                                                       to 2020, the number of Indian cities with more than 300,000
                                                                                                       people will increase by 26, which includes 4 new or bigger
 50                       83                                       93
                                                                                                       cities with more than 1 million people.
                                                                                                    • R
                                                                                                       ecent government infrastructure initiatives include the
     0                                                                                                Smart Cities Mission, which involves development of
                         2015                                    2020                                 100 smart cities by 2020, part of a larger plan to develop
                                                                                                      industrial corridors connecting big metropolitan hubs.
Indian government infrastructure spending                                                           • O
                                                                                                       ver the past five years, India has invested A$750 billion in
% of GDP, 2012–2017                                                                                   infrastructure and has allocated A$79 billion in the
                                                                                                      2017–18 budget. It is estimated that around A$5,722 billion
 5               Central               State                                                          of infrastructure investment will be required by 2040.
                                                             4.4%           4.5%
                                                                                                    • T he Delhi–Mumbai Industrial Corridor is a major
 4                                                                                                     infrastructure program comprising many large-scale projects
         3.5%         3.4%          3.5%        3.5%                                                   (including new industrial cities), which aims to expand
                                                                                                       India’s manufacturing and services sector.
 3
                                                                                                    • S
                                                                                                       ignificant Indian transport projects include the Sagarmala
                                                                                                      Project, which provides infrastructure to transport goods to
 2
                                                                                                      and from ports quickly and efficiently (A$237 billion), and
                                                                                                      the Bharatmala Project, which creates a road network to link
 1                                                                                                    India’s west-to-east land borders (A$2.8 billion).

 0
         2012         2013          2014        2015         2016           2017
                                                                                                         Key question
                                                                                                         • H
                                                                                                            ow can we partner in designing and delivering
                                                                                                           these large-scale infrastructure projects?

Data sources: United Nations Department of Economic and Social Affairs, Population Division – World Urbanisation Prospects; Reserve Bank of India; Global Infrastructure Hub

10 Overview: Towards a Queensland–India trade and investment strategy
INDIA’S GROWTH STORY
The increasing population of both India and the world will heighten
the need for sustainable approaches to food production and
energy production.
Sustainability for the future
Indian food demand, tonnes As the world’s population continues to grow, greater pressures
Millions, 2010–2030 are being placed on the world’s resources.
350
Food grains Apart from the obvious issues of depleting finite natural
300 resources, there are also challenges relating to non-finite
250 resources, such as food, demand for which is forecast to rise by
200 at least 20% over the next 15 years.
150
Vegetables Sustainability is not just about finding greener, renewable
100 sources of energy and other consumables, but also about
50 improving agricultural performance. This includes upgrading
0 infrastructure and supply chains, and improving processes to
2010 2020 2030 gain efficiencies, improve yield and reduce waste.
Cereal and rice yield, kg/hectare Key observations
Thousands, 2016
• A
s India’s population and wealth grows, food demand will
10 will increase – compared to 2010 levels, the demand in 2030
Rice for food grains and vegetables is forecast to increase by
8
Cereal 31% and 55% respectively.
6
• Increasing food demand creates ongoing challenges in India,
4 where yield rates lag behind other countries and the world
average – Indian yields are less than half of those of the USA
2
and China.
0 • T hese challenges can be attributed to capacity constraints in
USA China Japan World India the rural transport networks, variable awareness about crop
treatment, limited access to new farming technologies, and
India’s wastage of agricultural produce dependence on rainfall from an irregular monsoon.
2013
Value loss value
Commodity / crop Total loss (%) (in Rs. crore)
Milk
Meat
0.9%
2.7%
4,409
1,235
Key questions
Marine fish 10.5% 4,315 • H
ow can Queensland help India to create a
Inland fish 5.2% 3,766
more efficient agriculture sector through the
Egg 7.2% 1,320
sharing of agtech and specialist services?
Poultry meat 6.7% 3,942 • G
iven Queensland’s sophisticated supply
Cereals 4.7% – 6.0% 20,698 chains and export capabilities, how can
Pulses 6.4% – 8.4% 3,877 we encourage storage and distribution
Oilseeds 3.1% – 10.0% 8,278 innovation in India?
Fruits and vegetables 4.6% – 15.9% 40,811
Data sources: Indian Food Security Portal, 2030 Food Demand and Supply Projections; World Bank database; Food and Agricultural Organization of the UN; India’s CIPHET
Overview: Towards a Queensland–India trade and investment strategy 11INDIA’S GROWTH STORY
India’s economy is becoming more regulated, providing benefits to
to government,
government, citizens
citizens andand businesses
businesses.
Increased regulation of the Indian economy
Gross tax revenue per capita Like many developing economies, India has long maintained a
A$, 2012–2018 (F = forecast) large informal sector, which poses challenges for international
investment and trade.
278 The Indian Government has taken recent steps to increase
+12% 252 regulation and digitise the economy. This presents benefits to
217 government, Indian citizens (through increased public spending)
187 and established businesses, which can leverage and depend on
173
159 more efficient regulations, systems and supply chains.
138
Key observations
• G
ross tax revenue in India has been steadily increasing
and has grown by 12% per annum since 2012. Increases in
tax revenues are partly due to recent initiatives of the
Indian government to encourage greater participation in
2012 2013 2014 2015 2016 2017 2018F
tax systems.
• A
new goods and services tax (GST) was introduced in
Volume of electronic payments July 2017, which will further add to taxation revenues by
Millions, 2016–2017 extending the tax base. The GST allows the free movement of
goods and services between states, and significantly reduces
+49% ‘red tape’ and other costs for businesses.
998.5
• F ollowing demonetisation of Rs 500 and 1,000 banknotes
671.5 (which led to the withdrawal of 86% of all bank notes
from circulation), the government announced a number of
measures to encourage digital transactions, including zero
transaction fees on digital payments and no service taxes
on digital transactions of values up to Rs 2,000.
• In the year following demonetisation, digital transactions in
Nov-16 Nov-17 India have increased both in terms of volume (up 49%) and
value (up 29%).
Value of electronic payments
A$, trillions, 2016–2017
Key question
+29% • H
ow do recent and proposed changes to the
2.39
1.85 Indian economy impact our relationship and
future opportunities?
Nov-16 Nov-17
Data sources: Indian Food Security Portal, 2030 Food Demand and Supply Projections; World Bank database; Food and Agricultural Organization of the UN; India’s CIPHET
12 Overview: Towards a Queensland–India trade and investment strategyINDIA’S GROWTH STORY
Nearly 30% of India’s population now has access to the internet
and there are expected to be nearly two billion connected devices
in India by 2020.
Technology usage
People with access to the internet in India Access to the internet significantly improves information and
% population, 2007–2016 communication flows and enables ecommerce opportunities.
30 This in turn allows consumers to access new products and
25 services. At the same time, enterprises have greater reach and
new digital channels, both domestically and also in terms of
20 inbound and outbound international markets.
15
10 Key observations
5 • T he number of Indians with access to the internet has
0 increased dramatically over the last 10 years, from less than
5% of the population in 2007 to almost 30% in 2016.
2007 2010 2013 2016
• T his figure is expected to continue growing, with the
McKinsey Global Institute estimating that by 2025 there
will be 700–900 million smartphone users with mobile
Mobile device subscriptions in India
internet access.
Units, billions, 2007–2016
• Internet access is heavily skewed towards mobile use –
1.2 in 2016 Indians accessed the internet through their mobiles
1.0 nearly 80% of the time. The number of mobile devices in
India is also rapidly growing.
0.8
• India is on the verge of a digital revolution, which presents
0.6 many opportunities in financial services and IT services
0.4 (eg digital health solutions that can impact reach and
delivery of rural health care). These opportunities are further
0.2 supported by government initiatives including Startup India
0.0 and Digital India.
2007 2010 2013 2016
Key questions
Connected devices in India • I n what ways can we use technology and
Units, billions, 2017–2020 digital channels to better engage Indian
1.9 customers?
• W
hich technology-enabled products and
services will be in high demand as more of
India’s growing population gains access to
0.6
smart devices and the internet?
2017 2020
Data sources: World Bank database; Deloitte TMT India Predictions 2017; McKinsey Global Institute – India’s Ascent; StatCounter Global Stats
Overview: Towards a Queensland–India trade and investment strategy 13INDIA’S GROWTH STORY
India is becoming more competitive as a preferred place to do
business, with a number of structural reforms planned to further
improve the ease of doing business.
Ease of doing business
India ease of doing business
Rankings, 2012–2017
To be successful, we should understand the differences between
131 134 134 131 Queensland and Indian cultures and learn how to navigate the
130
relationship-based business environment.
100
Key observations
• Indian business is strongly relationship-based, preferencing
businesses that have an established local presence and
network. Partnering is often the recommended option for
foreign businesses entering the Indian market as partners
can provide invaluable knowledge and existing relationships.
• R
ecent reforms have significantly improved India’s global
ranking in terms of ease of doing business.
2012 2013 2014 2015 2016 2017
• T he changes include structural reforms related to starting
a business, obtaining credit, taxation, trading across state
borders, enforcing contracts and resolving insolvency.
India business confidence • T he government is looking to implement additional reforms
Index, 2012–2017 to further improve its ranking, including simpler registration
of firms, better enforcement of contracts and improved
56.2 56.5 58.3
54.8 53.9 processes for opening bank accounts.
49.9
• S
ince May 2014 the Indian government has taken many
positive steps to implement its pro-business and pro-
investment agenda and has announced to the world that
India is open for business.
Key questions
• W
hat are the challenges of doing business in
2012 2013 2014 2015 2016 2017
Queensland and India?
• H
ow can we better appreciate our cultural
differences and similarities with a view to
forming enduring relationships?
Data sources: World Bank, Confederation of Indian Industry
14 Overview: Towards a Queensland–India trade and investment strategyINDIA’S GROWTH STORY
As India grows to become one of the world’s largest economies,
Queensland has an opportunity to become an active partner and
form strong and enduring relationships
Supporting India’s growth story
Even by today’s measures, India is a significant economic power The next period of growth for India will not be without
that dwarfs not only Queensland, but Australia as a whole. challenges. However, challenges come with opportunities,
This imbalance will become even more pronounced as India and Queensland is well-placed to be an active partner with
continues on its growth journey. By 2050 it is expected to have India in supporting mutual growth through building on our
an economy which is almost 60 times the size of Queensland. existing strong relationship.
While India is a growing nation, growth is largely focused on Prioritising shared challenges faced by both India and
domestic consumption, with limited participation in global Queensland is one way to provide a focus that will result in
exports (with the exception of services exports) when compared rapid innovation that benefits both partners, and bolsters the
to other developing economies. relationship that exists today.
Like all growing nations, India needs to consider energy security,
food security, health care, education and future infrastructure.
While hungry for all of these and more, India is also a nation
with a large workforce and the potential for self-sufficiency by
adopting smarter processes and technologies.
INDIA AUSTRALIA QUEENSLAND
People
= 25m
GDP
= US$250b
GDP Growth
= 1%
Data sources: The World Bank Database; PWC – The World in 2050; KPMG analysis
Overview: Towards a Queensland–India trade and investment strategy 15Our relationship
• Q
ueensland and India share a cultural heritage • India hosts our Trade and Investment Queensland
as members of the Commonwealth and have office in Bengaluru (Bangalore). Likewise, Queensland
a rich history of our people sharing experiences, is host to an Honorary Consul for India in Brisbane,
ideas and expertise. as well as an active branch of the Australia India
Business Council.
• T he trade relationship between Queensland and India
is strong and growing. • G
iven the potential to deepen this relationship,
Queensland is seeking to build stronger ties
• T he ties between Queensland and India are stronger
with India.
than just trade and investment. Queensland is home
to a rich Indian diaspora – 49,000 Queensland
residents were born in India. This represents strong
community-based relationships with India.
• T his relationship already supports significant
economic development and investment in
infrastructure in Queensland and supports
employment in numerous fields throughout the state.
16 Overview: Towards a Queensland-India trade and investment strategyOUR RELATIONSHIP
Queensland is home to a large and diverse Indian diaspora –
49,000 residents of Queensland were born in India. This supports
strong community-based relationships.
Our people – Queensland’s Indian diaspora
The United Nations’ estimates that, in 2017, there were
16.6 million Indians living abroad. While the growing number of
Key observations
Queensland residents born in India demonstrates a quantifiable • Q
ueensland is home to more than 10% of Australia’s growing
link, there are also rich cultural connections of the Indian Indian-born population. The diaspora is an active part of
diaspora that sit behind the numbers. Queensland society and maintains links with India.
Queensland’s community of Indian-born residents contributes • Q
ueensland’s urban centres attract the largest number
to the state’s celebrated multicultural society. of Indian residents; the greater Brisbane area is home to
35,335, or 72% of the state’s total.
Estimated resident population of Queensland
(born in India) Thousands, 2006–2016
Case study
2016 49 Queensland–India Women’s Business Advisory Circle
2015 44
Trade and Investment Queensland has created the
2014 40 Queensland–India Women’s Business Advisory Circle, a
2013 37 network for businesswomen in Queensland and India to
2012 35 support each other in doing business.
2011 30 Made up of business influencers, existing and new
2010 27 exporters, as well as facilitators such as Trade and
Investment Queensland and Austrade, this advisory
2009 25 circle is primarily a LinkedIn group where members can
2008 21 interact, seek and share advice, discuss export issues
2007 17 and share success stories.
2006 13
Queensland is home to a large and diverse Indian community, with at least 27 Indian associations:
• Arya Pratinidhi Sabha of Brisbane • G
lobal Organisation for Indian • Kshatriya Society of Brisbane
Family & Youth – Brisbane
• Australia–India Business Council • Malayalee Association of Queensland Inc
• G
lobal Organisation of People of Indian
• Australia–India Cultural & Business Society • Marathi Association of Queensland
Origin
• Australian Folklore Association • Punjabi Cultural Association Queensland
• Gujarati Association of Queensland
• Bengali Society of Queensland • Queensland Telugu Association
• Hindu Mandir Association Queensland
• Bihar Jharkhand Sabha of Australia & NZ • S
hree Sanatan Dharam (H) Association
• Hindu Society of Queensland
Queensland
• Brisbane Tamil Association Inc
• Hindustani Language School
• Tamil Association of Queensland
• Club De Goa
• India Australia Society
• The Odia Community of Australia
• F ederation of Indian Communities of
• Jvala Charitable & Cultural Society Inc
Queensland • V
HP (Vishva Hindu Parishad) of
• Kashmiri Pandits Australia Inc Australia Inc
Note: Not all organisations listed above will be actively approached for consultation; stakeholders (including those above) are invited to make submissions in relation to this document.
Further details on page 5.
Data sources: ABS Census 2016 QuickStats; High Commission of India (Canberra)
Overview: Towards a Queensland–India trade and investment strategy 17OUR RELATIONSHIP
The trade and investment ties between Queensland and India start
with people.
Our people – skilled visas and remittance to India
Skilled migration to Queensland Interpersonal relationships are a key enabler of trade in both
Visa holders, 2010–2017 goods and services. In order to understand fully the economic
relationship between Queensland and India, it is important to
Year Total inbound Origin: India understand the relationships between its people.
2017 20,480 3,353
The data and commentary on this page provide a snapshot of
2016 23,208 4,409 Indian migrants who are residing in Queensland and Australia,
2015 27,316 5,488 including those who hold temporary skilled working visas.
2014 30,850 5,691 As well as permanent migration, there is also temporary people
2013 31,265 4,578
movement between India and Queensland in the form of tourism
and education.
2012 27,774 2,738
2011 22,441 1,670
The movement of people is just the starting point for linkages
between India and Queensland.
2010 50,455 1,603
Key observations
• F oreign direct investment and trade in goods and services
follow interpersonal relationships; strong and enduring
relationships have a compounding effect on total trade.
• T he estimated remittance from Queensland to India
increased by more than 17% per annum from 2010 to 2016.
• A
consistent share of skilled migration to Queensland
comes from India, mainly within the hospitality sector.
Café / restaurant owners and chefs / cooks represented
39% of all primary visa holders in Queensland in 2017.
• ICT occupations represented 20% of all primary visa holders
in Queensland in 2017.
Estimated remittance from Queensland to India
A$, millions 2010–2016
Key questions
300 • H
ow can our relationships help us to do
business in Queensland and India?
200
• H
ow can we ensure our existing relationships
100
will benefit us into the future?
0 • W
hat would help us to develop new
2010 2011 2012 2013 2014 2015 2016
relationships in key sectors into the future?
Data sources: ABS 34120DO009_201516; ABS Census 2016 QuickStats; World Bank; DFAT Visa Data; KPMG analysis
18 Overview: Towards a Queensland–India trade and investment strategyOUR RELATIONSHIP
The goods trade relationship between Queensland and India is
strong and growing.
Bilateral goods trade
Queensland merchandise trade with India by category Bilateral trade of goods is perhaps the most fundamental
A$, billions, 2012–13 to 2016–17 measure of interaction between two regions, and often creates
economic dependencies with ongoing political implications.
10
Analysis of the trade relationship of India and Queensland can
9 be used as the basis for expanding the existing economic ties
Exports
8
and moving into adjacent sectors and regions or further up the
value chain.
7
6 Key observations
5 • T he trade relationship is characterised by exports from
Queensland to India, with limited growth in goods imported
4
into Queensland from India.
3
• A
round 67% of Queensland exports to India are coal and
2 related goods. Queensland exports around 71% of Australia’s
Imports total exports to India in this category.
1
• T he second-largest export category to India is fruit and
0
vegetables, with Queensland exporting around 57% of
2013-14 2014-15 2015-16 2016-17
Australia’s total exports to India in this category.
Queensland merchandise trade with India by category
A$, millions, 2016–17
Exports to Imports
Trade category India from India
Key questions
Food and live animals 938 28
• How can we continue to grow our goods trade?
Chickpeas 8736 –
Beverages and tobacco 0 0 • W
hat is required in order to move towards more
value-added goods trade?
Crude materials, inedible, except fuels 234 13
Mineral fuels, lubricants and related materials 6,234 20
Bituminous coal 6,233 –
Animal and vegetable oils, fats and waxes 0 2
Chemicals and related products, nes 8 128
Manufactured goods classified chiefly by
4 180
material
Machinery and transport equipment 11 196
Miscellaneous manufactured articles 5 171
Commodities and transactions not classified
1,817 21
elsewhere in the SITC
TOTAL 9,251 758
6: Representing 64.2% of Queensland’s total chickpea exports (A$1359.7M). In 2017-18, Queensland total chickpea exports fell by 51.6% to A$658.3M.
Data source: ABS 5368.0
Overview: Towards a Queensland–India trade and investment strategy 19OUR RELATIONSHIP
The services trade relationship between Australia and India is less
significant than the goods trade, but has the same characteristics
of Australia exporting more than it imports from India.
Bilateral services trade
Australian services trade with India Trade in services is a hallmark of the knowledge economy, and
A$, billions, 2012–13 to 2016–17 is often more heavily dependent on interpersonal relationships
compared to trade in goods.
4.5
Exports This section looks at Australia’s services exports on a balance
4.0 of payments (BOP) basis, to understand the linkages between
Australia and India. Note that BOP data is not available at the
3.5 Queensland level.
3.0
2.5 Case study
Imports Queensland Skills and Education Consortium
2.0
The Queensland Skills and Education Consortium (QSEC)
1.5 is delivering high-quality industry-focused skills programs
in India to foster employment. Its partners include TAFE
1.0
Queensland, Griffith University, Australian Retail College,
0.5 Intech Institute of Technology and FoodCoach Institute.
Since its establishment in 2016, QSEC has signed
0.0 training delivery agreements with several Indian states
2013-14 2014-15 2015-16 2016-17 and organisations, including Kerala, Chhattisgarh and
Jharkhand and the Skills Council for Mining Sector.
Australian services trade with India by category
A$, millions, 2016–17 Key observations
• S
ervices trade is also characterised by exports, with limited
Exports Imports
Trade category to India from India growth in imports from India.
Transport 37 28 • T he majority of bilateral trade in services is from travel-related
services, which includes all goods and services acquired for
Travel (including education-related) 3,854 –
personal use by travellers (including Indian students).
Insurance and pension services 6 0
• T he second-largest category for import services from India
Financial services 48 13 is telecommunications, computer and information services,
Telecommunications, computer and information driven by outsourcing by Australian businesses.
47 20
services
Personal, cultural and recreational services 19 –
Other 76 2 Key questions
Total 4,087 128 • W
hat are the key sectors we should focus on
in order to increase services trade?
• W
hat can be done to encourage new
relationships that can improve services trade?
Data sources: ABS 5368.0; ABS 5368.0.55.003; DFAT Trade in Services Australia
20 Overview: Towards a Queensland–India trade and investment strategyOUR RELATIONSHIP
Australian investment in India is at a record high; however, there is an
imbalance between this and Indian investment coming into Australia.
Bilateral investment
Australia–India FDI relationship Foreign direct investment (FDI) is an investment made by a
A$, billions, 2012–2016 company or individual in another country, in the form of either
establishing business operations or acquiring assets.
1.8
FDI usually involves more than just capital outlay, and commonly
1.6
includes the provision of management services. As such, this
1.4 Australia FDI to India investment relationship represents more than just the flow
of capital; it often centers around the exchange of mutually
1.2
beneficial ideas and expertise.
1.0
0.8
Key observations
India FDI to Australia
• T he relationship is one of Australian FDI into India, with a
0.6
lesser and diminishing FDI flow from India.
0.4
• India has become an increasingly popular destination for
0.2 Australian FDI (both in terms of absolute investment and
share of total outbound FDI).
0.0
2012 2013 2014 2015 2016 • A
lthough the reported FDI from India into Australia is
dropping, there is an ongoing wave of Indian companies
expanding operations into Australia, including newly
launched Ola Cabs.
Australia–India FDI relationship • H
owever, Australian FDI represents a decreasing component
A$, millions, 2012–2016 of India’s total inbound FDI, as the nation secures growing
amounts of FDI from other sources.
Category 2012 2013 2014 2015 2016
$m 1,337 1,161 955 897 886
Indian FDI in
% of total Indian
1.18% 0.93% 0.65% 0.48% 0.46%
Key questions
Australia
outbound FDI
% of total Australian
inbound FDI
0.23% 0.18% 0.14% 0.12% 0.11% • W
hat can we do to grow our bilateral
$m 1,265 1,318 1,530 1,610 1,759
investment relationship?
Australian FDI in
% of total Australian
0.28% 0.26% 0.28% 0.30% 0.32%
• H
ow can Queensland position itself as an
outbound FDI
attractive investment destination?
India
% of total Indian
0.58% 0.56% 0.52% 0.43% 0.41%
inbound FDI
Data sources: ABS 53520; OECD Database, IMF Database; KPMG Analysis
Overview: Towards a Queensland–India trade and investment strategy 21OUR RELATIONSHIP
It is important that we focus our efforts and provide targeted support
to leverage existing capabilities and help solve shared challenges.
Queensland’s strengths and our shared challenges
As noted in the Advancing Trade and Investment – Queensland Our shared challenges
Trade and Investment Strategy 2017–2022 (the Strategy),
Queensland possesses many natural and acquired competitive While there are certain challenges that are unique to
strengths (reliable and efficient infrastructure, natural resources, countries and regions, there are also shared and universal
cost of doing business, existing global presence), all of which have challenges. It makes sense to approach these issues
supported the growth of its major export industries – mining, together, so we can benefit from sharing resources and
food and agribusiness, tourism, and international education and expertise. Some of the challenges facing both India and
training. These industries form a strong foundation for future Queensland include:
growth, and provide a starting point from which value-added
• H
ow we limit our reliance on natural resources, and
opportunities can be identified.
find cleaner and renewable ways to meet our energy
Queensland is becoming the place to develop and invest in needs.
emerging industries such as robotics, drones, artificial intelligence, • H
ow we continue to feed a growing population in a
data and computing, renewable energy, clean technology and way that is efficient and sustainable in the long term.
emerging science. Further investments are attracting international
• H
ow we prepare for changing demographics and the
entrepreneurs and start-ups to Queensland, promoting
associated increase in demand for health services.
collaboration between researchers and businesses and growing
innovation networks within our regions and international hotspots. • H
ow we overcome health challenges and diseases
specific to tropical and subtropical climates.
Shared challenges will provide Queensland and India with a platform
for stronger collaboration and co-investment. Facing the uncertainties • H
ow we prepare for the impact of disruptive
of the future is always easier with the support of others. By working technologies and their impact on future employment.
together to overcome challenges, such as food security and • H
ow we ensure that our people have the right skills
sustainability, Queensland and India can help each other. and training to succeed.
Queensland’s strengths
Mining and METS Tourism Food and International
agribusiness education and
•M
ajor industry in •W
orld-class tourism
Queensland, contributing attractions and experiences •8
3% of Queensland is
training
A$21.6 billion in 2015–16. (including five World dedicated to agribusiness. •D
estination of choice, due
Heritage areas), welcome to safe communities and its
•S
trong comparative over 24 million domestic •S
trong comparative
advantages in mining; one of advantages in the enviable lifestyle, weather
and international visitors and locations.
the world’s largest exporters annually. Tourism generates production of beef, fish and
of seaborne coal. A$57.9 million per day in crustaceans, chickpeas, •P
roximity to Asian growth
overnight visitor expenditure cotton, sugar cane and markets and offers
•H
ome to 800 mining sorghum.
and mining equipment, across Queensland. affordable living for students
technology and services • Innovative agtech and and their families.
•W
ell connected to Asia
(METS) companies, with growth markets. related services, including •S
trong regional dispersion,
METS employing more robotics, bio-products, with significant education
people than mining directly. •M
ajor event capabilities (eg packaging materials, and exports outside of Brisbane.
hosting the Gold Coast 2018 digital wireless technologies.
Commonwealth Games).
•Q
ueensland’s third-largest
export, behind coal and
food.
22 Overview: Towards a Queensland-India trade and investment strategyNext steps
We are seeking your support to help develop a • W
hat do you view as the strengths of the
Queensland–India trade and investment strategy Queensland–India relationship?
that articulates the best way to increase investment
• W
hat are the key opportunities moving into the
and trade.
future?
Consultation will take place between August and • W
hat would enhance our trade and investment
September 2018. As part of this consultation, we will be relationship?
asking key stakeholders in Queensland and India the
following questions: dditional questions for stakeholder consideration are
A
highlighted throughout this paper.
T ogether we can put our best foot forward and continue
to build enduring relationships with India.
Overview: Towards a Queensland–India trade and investment strategy 23Front and back cover images (left to right):
Gold Coast coastline
Indian diaspora benefiting from international education services
Vidhan Soudha, Bengaluru (Bangalore)
QIMR Berghofer Medical Research Institute
Gold Coast
Indian diaspora benefiting from international education servicesYou can also read