Industry projections 2018 - Australian cattle
←
→
Page content transcription
If your browser does not render page correctly, please read the page content below
Industry projections 2018
Australian cattle MLA’s Market Intelligence – globalindustryinsights@mla.com.au
KEY POINTS KEY 2018 NUMBERS
Herd rebuilding to continue Slaughter:
Cattle supplies to remain tight with small increase in slaughter 7.4 million head
Drop in cattle on feed from record highs Carcase weights:
Strong international competition from US and Brazil 293kg/head
Production:
2.17 million tonnes cwt
Beef exports:
1.05 million tonnes swt
* Graphic illustrates year-on-year change
Summary
Cattle supplies are anticipated to remain tight in 2018 with only a small rise forecast in adult slaughter to 7.4 million head, as
the herd rebuild continues. A dry winter/spring across many parts of Australia resulted in higher than expected turn-off in the
second half of 2017, which is likely to result in another restricted year for cattle flow in 2018. If the three-month rainfall outlook
from the Bureau of Meteorology (BOM) comes to fruition, it is likely to see tight supplies in certain regions, particularly through
the mid part of the year.
After a record year for carcase weights in 2017, 2018 will likely see this drop back in line with long-term trends. This,
combined with the forecasted increase in slaughter, would see beef production lifting 1% to 2.17 million tonnes carcase
weight (cwt).
A lower number of cattle on feed is expected after the highs seen in 2017, where there were three consecutive quarters with
over one million head on feed. A decline towards the 850,000–950,000 head mark is expected, driven by increasing grain
prices combined with a growing gap between feeder and 100-day finished over-the-hook prices (¢/kg) – underpinned by
restockers continuing to pay premiums in the young cattle market and increased US competition in key grainfed export
markets.
It is shaping up to be a challenging year ahead for Australian beef exports, with expected increases in production and exports
from many of our major competitors, including the US and Brazil. Australia's boxed beef exports are still expected to edge
above one million tonnes shipped weight (swt) following the forecasted growth in production, which will be larger than any
year prior to 2013, as many strong international demand fundamentals remain in place. A key factor will be if the US consumer
continues increasing their per capita consumption – soaking up much of the growing US production and preventing a large
portion of product from entering export markets.
Prices will come under pressure in 2018 and 2019 as the aforementioned international competition intensifies, with a key
watchout being the premium Australia can continue to command for its high quality product. Restocker interest throughout
the year will again be a key driver of the Eastern Young Cattle Indicator (EYCI). The rally seen throughout October/November
2017, due to some good rainfall across Queensland and NSW, demonstrated restocker intent given the right conditions.
Industry projections 2018 – Australian cattle 1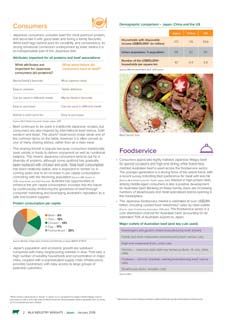
Assumptions
For the purpose of these projections, average seasonal
Figure 1: Australian rainfall outlook February to April 2018
conditions have been assumed for Australia's cattle
Chance of exceeding the median rainfall
producing regions out to 2022. The latest BOM three-
month outlook indicates a higher chance of 'above Legend
average' rainfall for many parts of WA, northern Australia Above 70% chance
and the east coast for the February to April period. The 65-70% chance
remainder of the country has a roughly equal chance of a 60-65% chance
55-60% chance
wetter or drier three months. 50-55% chance
45-50% chance
The Australian dollar fluctuated throughout 2017 but on Below 45% chance
average was slightly higher against the main currencies,
including the US dollar (3%), Chinese renminbi (5%) and
Japanese yen (6%). Notable exceptions were the lack of
any significant change against the Korean won, Euro and
Indonesian rupiah. The Australian/US exchange rate
moved 5US¢ higher over the course of the year, opening Source: Australian Bureau of Meteorology
at 73US¢, reaching a top of 80US¢ in September before
closing the year at 78US¢.
Figure 2: AUD currency movements
Index, January 2013 = 100
The major banks have contrasting views on the Australian 120
AUD/USD AUD/JPY AUD/WON
dollar for 2018 with predictions for the Australian/US 110
exchange rate ranging from 70US¢ to 85US¢. The main
100
determinants of our performance in 2018 will be
90
comparative economic performances, central banks’
monetary policy and the performance of key commodities. 80
70
Fluctuations in the Australian dollar are, as ever, 60
extremely difficult to predict. Hence, the status quo is
15
16
-15
-16
15
16
18
13
14
-13
-14
13
14
17
-17
17
p-
p-
p-
p-
p-
n-
n-
n-
n-
n-
n-
ay
ay
ay
ay
ay
Ja
Ja
Ja
Ja
Ja
Ja
Se
Se
Se
Se
Se
assumed for these projections, while noting where
M
M
M
M
M
Source: XE.com
changes in exchange rates may have a major influence.
Cattle herd and slaughter
Despite the dry winter and spring, the herd rebuild is still very much underway across many parts of the nation. The
southern regions of NSW and Victoria are expected to achieve pre-drought herd numbers in the coming year, with their
recovery helped along by comparatively higher and less volatile branding rates.
The success of the wet season in Queensland will set the stage for the year ahead and determine how supply (and
prices) should be expected to track. Queensland, which hosts about half the national beef herd, has not had a
substantial wet season since 2011–12 and will be thirsty for cattle given the right conditions. There has been somewhat
better rainfall than last year and the outlook for the rest of the northern wet season (February to April) slightly positive
which, if it comes to fruition, should lay solid foundations for the continued rebuild.
Female slaughter remains in rebuild territory, averaging 45% of the adult kill for the year-to-November. The rolling
annual total is likely to remain under 47% for the next few years as the rebuild progresses. Current projections have the
national herd reaching its pre-drought (2012) levels by 2020 under the assumption of average seasonal conditions
between now and then.
Figure 3: National cattle herd Figure 4: Female slaughter
million head %
30 60
Female % of slaughter Rolling 12 month average
29
28 55
27
26 50
25
45
24
23
40
22
21
35
20
05
06
09
02
08
03
04
07
01
10
16
15
12
13
14
17
11
19 5
20 5
20 5
20 9
20 9
19 0
19 2
19 4
96
19 8
00
20 2
2004
20 6
2008
20 0
20 2
2014
20 16
19 3
20 3
20 3
20 19f
20 8f
20 f
f
97
20 7
20 f
19 1
20 1
2011
2021f
20
22
17
20
20
20
20
20
20
20
20
20
20
20
20
20
20
20
20
20
9
9
0
1
9
9
0
9
9
0
0
1
1
0
0
9
9
0
1
1
19
19
19
20
Source: ABS, MLA forecasts Source: ABS
Industry projections 2018 – Australian cattle 2The poor winter and spring across a number of regions in 2017 temporarily halted or undid many producers’ herd
rebuilding efforts in the affected areas. This has meant many young cattle were pushed into feedlots in 2017 due to lack
of decent pasture – stock that otherwise would have been finished in the paddock and sent to market in 2018. This is
part of the reason there is an expectation of tighter slaughter numbers than previously forecast in 2018, as these
producers look to rekindle rebuilding efforts.
Overall, there should be some improvement in adult slaughter next year with a 3% lift to 7.4 million head. From 2019,
slaughter levels are expected to return to long-term averages as the herd numbers grow.
As mentioned above, the impact and recovery from the Figure 5: Annual adult cattle slaughter
drought years has been by no means uniform and, as such, million head
10
availability of slaughter cattle will vary across the nation.
Cattle flow from Victoria and southern NSW should see 9
some decent improvements in 2018, while WA and NT, 8
which both went largely unaffected through the drought 7
years, will continue to perform as the season dictates. Both 6
Queensland and SA will likely see the tightest supplies
5
and strong restocker demand, should weather provide the
4
opportunity. 16 17f 18f 19f 0f 1f 2f
19 5
20 5
15
20 9
20 9
19 0
19 2
19 4
96
19 8
00
20 2
2004
20 6
2008
20 0
20 2
2014
19 3
20 3
20 3
97
20 7
19 1
2001
2011
9
9
0
20 20 20 20 202 202202
9
9
0
9
9
0
0
1
1
0
0
9
9
1
19
19
19
20
Source: ABS, MLA forecasts
As always, seasonal conditions will play a critical role in
the pace of slaughter throughout the year and a lot is still
riding on how the northern wet season plays out. It is likely that the winter months will be tight in 2018 compared to
2017, if average seasonal conditions prevail, before supplies potentially improve towards the end of the year.
Female slaughter will likely remain relatively low for the next few years given the rebuild and, when combined with the
ongoing growth in the proportion of Meat Standards Australia (MSA) cattle, there should be an improving quality of
product coming through the system. It is important to note, however, that ultimately the female kill will increase as the
herd comes out of the rebuild, increasing the reliance on our manufacturing markets.
Cattle on feed
The number of cattle on feed reached record highs in 2017 with three consecutive quarters of over one million head on
feed (March, June and September). Heightened investment in the lot feeding sector, growing global demand for high
quality grainfed product and lower grain prices at the start of 2017 incentivised many lot feeders to increase numbers
and retain cattle for longer. Additionally, the dry winter and spring conditions across much of Queensland also resulted
in a greater number of cattle placed on feed rather than finished in the paddock.
Cattle on feed numbers are forecast to drop below one million head in 2018, to average around the 850,00–950,000
head mark.
This expected decline in cattle on feed is being driven by Figure 6: Feedlot price movements
a number of factors, including the fall in grain harvests Index Jan-2014 = 100
240
(the 2017–18 winter harvest was down an estimated 23% 220
Feeder steer prices
100 day OTH grainfed steer prices
and summer is forecast to fall 41% nationally – ABARES), 200
Darling downs feed wheat
the subsequent lift in feed grain prices in late 2017 and 180
160
the growing gap between feeder (¢/kg) and finished (¢/kg)
140
prices. 120
100
More specifically, when comparing prices at the end of 80
2017 to those two years earlier, feeder prices have only 60
2014 2015 2016 2017
eased 2% to 305¢/kg live weight (lwt) while the Source: MLA, Profarmer (feed grain price)
Queensland 100-day over-the-hook (OTH) grainfed steer
indicator dropped 9% to 507¢/kg carcase weight (cwt).
This fall in the 100-day OTH indicator, which is now at its Figure 7: Record number of cattle on feed in 2017
‘000 head
lowest level since mid-2015, is weighing heavily on feedlot 1,100
margins. The performance and quality of Australian grain 1,000
crop yields in 2018 will have a major impact on whether 900
this number recovers. 800
700
The expected drop in cattle on feed will have a flow
600
through impact on grainfed exports, which also reached
500
new highs in 2017. Considering the headwinds for finished
400
cattle in the increasingly competitive international market,
05
09
06
08
04
15
16
10
12
14
07
13
17
11
20
20
20
20
20
20
20
20
20
20
20
20
20
20
there is likely to be some downward pressure on exports Source: ALFA, MLA
(more in the Competitor section).
Industry projections 2018 – Australian cattle 3Carcase weights and production
Adult carcase weights increased almost 10kg year-on-year in 2017 to 298kg, following record numbers of cattle on feed
and a low proportion of female slaughter. In the last 10 years, carcase weights have increased across both males (1.4kg/
year) and females (2.8kg/year) on the back of improved genetics, management techniques and growth in the feedlot
sector.
In 2018, carcase weights are expected to ease from the record levels of 2017, back in line with long-term trends, but will
still be the second highest calendar year average on record, at 293kg. There are a number of key drivers behind this
year-on-year decrease, mainly the aforementioned drop in the number of cattle on feed, higher grain prices impacting
supplementary feeding and female slaughter proportion likely to plateau. Females are on average 65kg (carcase weight)
lighter than their male counterparts, so the proportion of female slaughter has a strong correlation to total average
carcase weights.
Total beef production for 2018 is expected to lift to 2.17 million tonnes cwt – an increase from both 2016 and 2017 levels,
but well down on the drought impacted levels of 2013–2015. Overall, the modest increase in slaughter is expected to
more than outweigh the anticipated drop in carcase weights.
Figure 8: Male and female carcase weights Figure 9: National beef and veal production
Adult cwt (kg) Male Female million tonnes cwt
350 2.6
325
2.4
300
2.2
275
2.0
250
225 1.8
200 1.6
16 16 17f 18f 19f 0f 1f 2f
03
04
05
06
07
08
09
10
11
12
13
14
15
17
19 5
20 5
15
20 9
20 9
19 0
19 2
19 4
19 6
19 8
20 0
20 2
2004
20 6
2008
20 0
20 2
2014
19 3
20 3
20 3
19 7
2007
19 1
2001
2011
9
9
0
9 20 20 20 20 202 202202
9
0
9
9
0
9
9
0
1
1
0
20
9
9
0
1
20
20
20
20
20
20
20
19
20
20
20
20
20
20
20
Source: ABS Source: ABS, MLA forecasts
Competitors - US, Brazil and India
Competition across many of our international markets is likely to intensify in 2018, with forecasted increases in
production from many of Australia's competitors, in particular the US and Brazil.
United States
According to the United States Department of Agriculture, the US is on track for their biggest ever year of beef
production in 2018 and then again in 2019. Strong returns in recent years incentivised cow-calf producers to accelerate
the US herd recovery and a couple years of record corn production have all helped lead to this potential record year of
production. The increases in production (4% in 2017 and 5% forecast for 2018) are being driven by both increasing calf
crops and growing carcase weights. The latest female slaughter percentage indicates US herd expansion is slowing, but
not yet over.
The US also gained renewed access into China in 2017, however will need to comply with some rigorous requirements,
including the prohibition of the use of hormone growth promotants (HGP). It is expected it will take a number of years for
volumes to become significant, due to costs incurred in producing HGP-free beef in the US and question marks on
China's willingness to pay those premiums.
Demand for beef from domestic US consumers has also Figure 10: US beef production
seen significant increases on the back of growing million tonnes cwt
13.5
consumer confidence and strong economic indicators,
13.0
along with shifting attitudes to animal fats and increased
12.5
retail focus on beef. US beef per capita consumption
12.0
grew by 3-5% in 2016 and 2017, with many industry
11.5
experts forecasting this to continue in coming years.
11.0
From Australia's perspective, it is critical that domestic
10.5
consumption keeps pace or exceeds the rate of increase
10.0
in production, otherwise this excess beef will be flowing
00 01 02 03 04 05 06 07 08 09 010 011 012 013 014 015
20 f
f
20 f
20 f
16
20 f
20 1f
20
22
19
18
17
20 20 20 20 20 20 20 20 20 20 2 2 2 2 2 2
2
20
20
into our competing export markets, particularly Japan
Source: USDA November WASDA forecast
and Korea.
Industry projections 2018 – Australian cattle 4Brazil
2017 was a challenging year for the Brazilian beef industry with very slow economic growth, restricted market access,
the 'weak meat' scandal in late March and corruption involving the country's largest meat processing company.
Despite all this, beef production increased in 2017 and female cattle slaughter registered an increase for the first time in
recent years indicating that Brazil may be coming out of its latest retention phase. Consequently, beef production is
expected to rise in coming years, outstripping growth in domestic consumption and lifting beef exports significantly.
While Brazil continues to be restricted in some of Figure 11: Brazil exports by destination
Australia's major markets such as the US, Japan and ‘000 tonnes swt MENA China/Hong Kong Russia Chile Other
1,400
Korea, they will continue to be a price setter in the lower
value segments in the Middle East and China, which sets 1,200
a baseline for these markets. China and the Middle East 1,000
are becoming increasingly important markets for Brazil,
800
with the decline of Russia and Venezuela as export
destinations, and combined now account for almost 65% 600
of Brazil's exports. 400
200
The Brazilian beef industry will remain focused on
improving its market access, productivity, sanitary status 0
f
16 17
05
09
00
02
06
08
04
15
03
10
12
14
07
13
01
11
and eating quality. However, the current political and 20 20
20
20
20
20
20
20
20
20
20
20
20
20
20
20
20
20
economic uncertainty could compromise further Source: GTA Year ending October
investments in the beef industry.
India
The Indian beef and buffalo meat sector remains a volatile market. Despite this, India is currently the largest bovine meat
exporter in the world. Beef production in India is predominantly a by-product of the dairy industry and, on the back of
private investment and government support in the dairy sector, herd size and bovine production and exports are
expected to increase in coming years.
India is heavily reliant on one export destination with close to 50% of exports destined for Vietnam (most will then flow
over the border to China) and is a low quality, low value frozen boneless product. However, India has started to expand
their international footprint and, though unlikely to ever gain access to high value markets such as Japan, US and Korea,
there may be some impact on Australian exports in markets they have entered such as Indonesia. Ongoing disruptions
from its own domestic processing regulations, limited market access and lack of FMD-free status will continue to
severely restrict India's presence in many markets. The Australian beef industry's credentials as a safe and high quality
meat supplier with an integrated traceability system should continue to differentiate Australian from Indian product in
most key export markets.
Domestic demand
Australia's domestic beef consumption (absolute) has been tracking sideways since the 1990s and has only seen a
sharper drop in the last three years, following significant increases in beef retail prices. The average retail price of beef
for the first three quarters of 2017 was on par with 2016,
Figure 12: Retail prices by protein
which was the highest on record. Beef's pricing relative to ABS retail price A¢/kg Beef Chicken Pork
chicken highlights the competitive pricing pressures it is 2,500
220% Index 360% Index
facing. Beef was at a 220% retail price index to chicken in to Chicken
290% Index
to Chicken to Chicken
2000, which jumped to an average 360% index so far in 2,000
2017. During this time, beef's average retail price has
almost doubled, while chicken's has only gone up 12%. 1,500
Consumer research is showing that as the retail price of 1,000
red meat has trended upwards since 2013, consumers
increasingly claim price to be the main reason for eating 500
less red meat, above health or animal welfare/
environment concerns. Maintaining value share will be a 0
Mar-00
Sep-00
Mar-01
Sep-01
Mar-02
Sep-02
Mar-03
Sep-03
Mar-04
Sep-04
Mar-05
Sep-05
Mar-06
Sep-06
Mar-07
Sep-07
Mar-08
Sep-08
Mar-09
Sep-09
Mar-10
Sep-10
Mar-11
Sep-11
Mar-12
Sep-12
Mar-13
Sep-13
Mar-14
Sep-14
Mar-15
Sep-15
Mar-16
Sep-16
Mar-17
Sep-17
challenge if beef's price premium to chicken/pork grows
larger. Source: ABS
Industry projections 2018 – Australian cattle 5Despite some of these recent challenges, Australians Figure 13: Retail fresh meat value share in Australia – 2017
remain one of the largest per capita consumers of beef in
the world, with beef having the highest share of retail
sales of any fresh meat in Australia in 2017, around 36%
share of fresh meat sales (by value) (Source: AC Nielsen Beef – 36%
Homescan). Chicken – 26%
Lamb – 13%
Australia's changing demographic provides some macro
challenges for beef with two broad trends of increased Pork – 13%
migrations from Asian countries (where pork is the Seafood – 9%
dominant protein), and an ageing population who
Other – 3%
consume less red meat for health/functional/price
reasons. The most recent ABS survey showed that more
than a quarter of Australia's residents are now born
overseas and for the first time in Australia's history, the
majority of these people born abroad are from Asia rather Source: AC Nielsen Homescan, MAT to 30/12/2017
than Europe.
International demand
The global economy has a much more positive outlook than this time last year with key regions, including the US and
many parts of Asia, registering improvements in key economic indicators. Along with this, many developing markets are
also marked for some significant improvements in household wealth, which generally flows through to an increase in
protein consumption. This, combined with natural population growth, should see beef consumption continue to expand
on a global level.
Australian beef exports ended 2017 in line with 2016 levels Figure 14: Australian beef and veal exports
at 1.01 million tonnes swt, with both chilled and frozen ‘000 tonnes swt Japan US Korea Greater China Other Forecast
1,400
product consistent year-on-year. There have been some 1,200
changes in the destination of our exports for the year, with 1,000
an uplift in volumes going to Japan and China helping to 800
offset a drop off in volumes to Korea and Indonesia. 600
400
Australia's slightly improving supply situation comes at the
200
same time global supply is expected to increase by over
0
one million tonnes in 2018. In other words, Australian beef 16 17f 18f 19f 0f 1f 2f
95
20 5
15
20 9
20 9
96
98
20 0
20 2
20 4
20 6
20 8
10
12
20 4
20 3
13
19 7
20 7
20 1
20 1
0
0
1
20 20 20 20 202 202 202
9
0
0
9
0
0
0
0
0
0
1
20
20
20
19
19
19
19
exports will be competing in a global market with a very Source: DAWR, MLA forecasts
strong supply of beef. As a result, global beef prices will
likely come under pressure, reinforcing the need for Australia to continually position itself as a superior supplier of high
quality product.
Australian beef exports are expected to slightly increase to 1.04 million tonnes swt in 2018, in line with production.
Although this increase is modest on 2017 volumes and is down on 2013–2015 levels, it will still be bigger than any year
prior to 2013.
The US and China are forecasted to be the two key growth countries for beef consumption globally in coming years (in
absolute terms) and both countries will be critical in soaking up growing world beef supply. The recent jump in US
domestic per capita consumption of around one kilogram equates to 295,000 tonnes that was retained domestically in
the US rather than exported (this is equal to approximately 30% of Australia's beef exports). The other key market in the
equation is China/Hong Kong, which now accounts for 30% and 50% of Brazil and Uruguay's exports, respectively.
Industry projections 2018 – Australian cattle 6Japan
Japan finished 2017 as Australia's biggest export market for beef, despite tough competition faced from the US
throughout the year. Volumes to Japan increased by 11% to 292,000 tonnes swt driven by growth across both frozen
grainfed (+20%) and frozen grassfed (+18%) beef, with the chilled segment remaining stable.
There have been a few key reasons behind this growth, one of which was Japan's frozen beef imports hitting safeguard
volumes in July 2017, which saw tariffs on frozen beef from 'non-EPA' nations (e.g. US, NZ, Canada) 'snapback' to 50%
until 1 April 2018. This has given Australia a 22.8% tariff
advantage for frozen beef exports over this time, with Figure 15: Japan beef imports rising*
‘000 tonnes swt US Australia Canada New Zealand Other
Australian frozen beef exports only incurring a 27.2% tariff 600
under the Japan-Australia Economic Partnership 500
Agreement (JAEPA). 400
300
Some other key factors contributing to this growth are the
ongoing high costs and tight supply of local beef, 200
increasing interest in leaner meat (akami) and steaks and 100
strengthening of the True Aussie brand, which is now 0
15
10
12
14
16
13
f
11
17
recognised by 40% of Japanese consumers.
20
20
20
20
20
20
20
20
Source: Japan Ministry of Finance, *Year-to-November beef imports
Please read the Japan beef snapshot for more information on the opportunities and challenges for the industry.
United States
Beef exports to the US ended 2017 just below 2016 levels at 234,000 tonnes swt, and continue to be challenged by
domestic supply constraints and rising US beef production. However, robust US domestic demand driven by an
increased retail focus on beef (resulting in lower retail prices) has helped absorb much of this increased US production.
Manufacturing beef is still dominant, accounting for 63% of Australian exports.
The US continues to take a growing share of Australian chilled grassfed exports reaching 58,000 tonnes swt in 2017
compared to 21,000 tonnes swt in 2010. This chilled product is utilised in both the foodservice and retail channels with
US consumers perceiving grassfed beef as better for
animal welfare and the environment and more 'natural' – Figure 16: Australian chilled grassfed exports
helping grassfed beef to find its way onto more menus ‘000 tonnes swt US Rest of the world
180
and into more stores in the US. 160
140
On the back of a continuing strong economy and low 120
unemployment, the US beef market is expected to remain 100
robust with continued demand for lean Australian 80
manufacturing beef and ongoing demand for chilled 60
grass/pasture-fed product. 40
20
0
16 17
7
8
9
10
11
2
13
14
15
Please read the US beef snapshot for more information on
0
20
0
0
1
20
20
20
20
20
20
20
20
20
20
the opportunities and challenges for the industry. Source: DAWR
Korea
For the first time in five years, there was a decline in Australian beef exports to Korea in 2017, down 17% to 149,000
tonnes swt. The increase in US production and consequent easing of US beef prices has created strong competition for
Australia in this market. This, combined with Australia's triggering of the Korean safeguard tariff (increasing the tariff
from 29% to 40%) and reduced local production, saw the
US become the largest supplier to Korea in 2017. While Figure 17: Australian exports to Korea
‘000 tonnes swt Grainfed Grassfed
the competition from the US in Korea is expected to 200
remain strong, Australia is well positioned to continue to 175
grow with Australia's reputation as a clean green supplier 150
underpinning the demand from local supermarket 125
shoppers that want a trusted product for their family. 100
75
50
Please read the Korea beef snapshot for more 25
information on the opportunities and challenges for 0
00
01
02
03
04
05
06
07
08
09
10
11
12
13
14
15
16
17
the industry.
20
20
20
20
20
20
20
20
20
20
20
20
20
20
20
20
20
20
Source: DAWR
Industry projections 2018 – Australian cattle 7China
Over recent years, Australia's beef exports to China have been relatively volatile, with changing import protocols and the
easing of restrictions placed on other countries impacting exports. In 2017, beef export volumes to China increased,
after a significant drop in 2016. Almost all of this growth has been driven by frozen grassfed product (+22%), which
makes up around 70% of Australian exports to the market.
This reflects the growing Chinese consumer demand for Figure 18: Australian beef exports to China
quality and safe imported beef as China's economy shifts ‘000 tonnes swt
180
to become more consumption-driven. 160
140
+17%
Looking forward, China remains a very price-sensitive 120
market and hence a challenging destination for Australian 100
80
exports. Changes in market access for Australian chilled 60
product are also ongoing. Australia was the sole approved 40
supplier of chilled beef to China up until 2017, but China 20
0
has now granted access to the US, approving 37 16 17
06
07
08
09
10
11
12
13
14
15
20 20
20
20
20
20
20
20
20
20
20
20
establishments, and New Zealand on a preliminary six- Source: DAWR
month trial basis involving 10 establishments.
Please read the China beef snapshot for more information on the opportunities and challenges for the industry.
South-East Asia
It was a mixed bag for exports to South-East Asia (SEA) in 2017. Shipments to Australia's major destination in the region,
Indonesia, were down 19% while shipments to Australia's second largest destination, the Philippines, jumped
significantly (+13%). The growth in the Philippines has predominantly consisted of frozen manufacturing cuts, while
volumes to Indonesia have fallen with the increasing presence of cheaper Indian buffalo meat.
Please read the SEA beef snapshot for more information on the opportunities and challenges for the industry.
Other markets
The Middle East was stable in 2017, with some slight declines in Australia's biggest markets for beef (Saudi Arabia and
Dubai) offset by increases in some of Australia's smaller markets in the region such as Kuwait, Abu Dhabi and Qatar.
Volumes to Europe have dropped off in 2017 across both the UK and other destinations, caused partly by high Australian
cattle prices and growing competition for limited quota allocation.
Please read the Global beef snapshot for more information on the opportunities and challenges for the industry.
Market access
Maintaining favourable access conditions and reducing both economic and non-tariff barriers will continue to be a key
lever in improving Australian beef's global competitiveness. Changes in global political dynamics have seen the desire
for liberalised global trade slow, with a general trend towards smaller regional or bilateral trade agreements, along with
the renegotiation of agreements as protectionist talk has gained momentum in some major economies. The increase in
protectionism, led particularly by the US's new approach to global trade, does pose a risk for Australian exports, but in
some circumstances presents opportunities.
Figure 19: Japan import tariffs under JAEPA*
In line with scheduled tariff cuts and quota relaxations, % Australia Frozen Australia Chilled US Frozen US Chilled
there will be changes in access for Australian beef 55
Non-FTA suppliers frozen tariff snapback to 50% until April 2018
imports into key North Asian partner markets in 2018. 50
45
Import tariffs on Australian chilled beef into Japan will be
40
reduced from the current 29.9% to 29.3% in April 2018 35 Tariff spread
under the Japan-Australia Economic Partnership 9.2% to 11.6% Tariff spread
30 15% to 19%
Agreement (EPA), while chilled beef from other suppliers 25
with no-EPA will continue to attract 38.5% tariff. In terms 20
of frozen beef, the tariff on Australian product will be 15
nt 18 19 1
20 r 2 r 22 r 23 r 24 r 25 r 26 r 27 r 28 r 29 r 30 r 3
1
27.2% (down 0.3% from the current 27.2%), versus 38.5% re pr pr
r pr p p p p p p p p p p p
Cu 1A 1A 1A 1A 1A 1A 1A 1A 1A 1A 1A 1A 1A 1A
for non-EPA suppliers.
Source: DFAT *pending entry into force of CPTPP tariff on both frozen
and chilled beef to Japan will fall to 9% over 15 years
Industry projections 2018 – Australian cattle 8January 2018 saw a reduction in tariffs under the Korea- Australia Free Trade Agreement (KAFTA). Import tariffs for
Australian beef (both chilled and frozen) are now 26.6%, down from 29.3% in 2017. However, Australian product still
faces a tariff disadvantage with the US, who have a 5.3% tariff advantage and also a much larger safeguard volume due
to the Korea-US FTA (KORUS) coming to force two years ahead of the KAFTA.
An encouraging development in January 2018 saw the
Figure 20: KAFTA and KORUS beef tariff schedules
conclusion of Comprehensive and Progressive Trans- KAFTA safeguard (RHS) KORUS safeguard (RHS) KORUS beef tariff KAFTA beef tariff
Pacific Partnership (CPTPP) negotiations and
% tariff rate ‘000 tonnes
announcement that the 11 member countries would sign 35 400
30 350
the agreement in March 2018. The CPTPP will add
25 300
significant value to the Australian beef industry, 250
20
particularly through improved access in key beef markets 200
15
such as Japan, Mexico and Canada, complementing 150
10
gains derived from other free trade agreements Australia 100
5 50
has concluded to date and maintaining the
0 0
competitiveness of Australian beef, particularly in Japan. 17 18 19 20 21 22 23 24 25 26 27 28
29
20 20 20 20 20 20 20 20 20 20 20 20
20
Expeditious entry into force of the CPTPP agreement will
Source: DFAT and USDA FAS
be integral to realising potential benefits.
In the year ahead, Australia is engaged in a number of trade talks globally. Priorities include the EU, in anticipation of the
launch of the Australia-EU FTA, and UK, regarding the upcoming 'Brexit', along with continued support for expeditious
entry into force of the CPTPP. In addition, there are new opportunities for Australian exporters with the ratification of the
Peru-Australia Free Trade Agreement (PAFTA) and Mexico formally extending access to the 200,000 tonne tariff-free
global beef quota to the end of 2019. By far the biggest opportunity remains overcoming the plethora of non-tariff trade
barriers with many of our existing trade partners.
Live exports
2018 will likely mirror 2017 for live exports, which were restricted by the tight domestic supply (especially in the north),
high cattle prices and ongoing uncertainty around import policies. Australian live cattle exports for 2017 were back 22%
to just under 855,000 head.
There have been some extraordinary years for live
Figure 21: Live cattle exports
exports, with the liquidation of Australia's 30-year high million head Indonesia Vietnam Other Forecast
cattle herd through 2014 and 2015. However, 2017 saw a 1.4
significant contraction in export cattle, largely due to 1.2
fewer available supplies as the herd rebuilding 1.0
commenced. Over the next few years some increases in 0.8
live export are expected from the 2017 levels as the herd 0.6
recovers, but it is unlikely to get back to recent highs. 0.4
0.2
South-East Asia remains the key export region for 0
f f f f f
05 06 07 08 09 10 11 12 13 14 15 16 17 18 19 20 21 22
Australia's live cattle, taking over 80% of Australia's live 20 20 20 20 20 20 20 20 20 20 20 20 20 20 20 20 20 20
cattle, with Indonesia (60%) and Vietnam (19%) the leading Source: ABS (pre-2015), DAWR, MLA forecasts
destinations.
Shipments of feeder and slaughter cattle to Indonesia in 2017 totalled 499,000 head, back 16% from a year ago. High
Australian cattle prices, the Indonesian government's agricultural policy goal to achieve self-sufficiency for major
commodities including beef, along with price stabilisation methods that enabled the import of Indian Buffalo Meat are
the prominent factors in reduced cattle exports to the country. The prospects for 2018 remain uncertain, depending in
part on implementation of the 5:1 (five feeder cattle imports to one breeder) policy requirements, which would see an
increase in breeder exports occurring next year. The Indonesian government's 5:1 policy is scheduled for the first audit
in December 2018.
Cattle exports to Vietnam reached just above 165,000 head in 2017, down 15% from year-ago levels. Australian cattle
sales are relatively subdued due to the availability of local (regional) cattle combined with the tight supply and higher
prices of Australian cattle. Demand for beef increases in the lead up to Vietnamese New Year festival in February, which
should help support demand for Australian cattle.
Industry projections 2018 – Australian cattle 9Prices
Beef and cattle prices are likely to come under some pressure in 2018 as international competition intensifies and supply
increases. The impact of this will partly depend on the level of restocker activity and strength of the underlying demand
for beef in Australia and overseas.
Australian cattle prices roughly realigned themselves with US beef and cattle prices in 2017. The relative price difference
between finished cattle in both countries (in US dollar terms) returned to long-term averages with Australia at a 20%
discount, after hitting a massive 57% discount in the grip of drought (and record US prices) and a historic premium when
both indicators crossed over for the first time in 2016.
While Australia appears to be back in sync with the US, currency movements and the rise in Australian cattle prices over
the past three years have made South America a more competitive supplier to the global market. Up until 2015,
Australian cattle prices tracked relatively closely to those in Brazil, Uruguay, Paraguay and Argentina. However, steers in
Australia are now tracking close to a 50% premium to
those in Brazil. Figure 22: Global cattle price spread closes
US¢/kg Argentina Australia Brazil Paraguay Uruguay US
Currently, the EYCI, heavy steer and medium cow 400
indicators all remain below where they tracked this time 350
in 2017, with finished cattle prices still historically high – 300
above any level prior to mid-2015. Restockers have
250
played a prominent role in the high levels the EYCI has
200
maintained during 2016 and 2017. There has been a
recent shift in the price premiums that restockers typically 150
pay between the northern and southern states, with 100
2010 2011 2012 2013 2014 2015 2016 2017
Queensland the driving force while Victorian restocker Source: MLA (Australia); Esalq/Cepea (Brazil); INAC (Uruguay); USDA (US); IPCVA (Argentina,
demand has eased. Paraguay), Steiner, USDA, CME (22 Nov. 17). Cattle specifications vary between indicators.
The rally of the EYCI seen in October/November 2017
(from a two-year low in late September) with some good
Figure 23: Eastern Young Cattle Indicator
¢/kg cwt 2016 2017 2018 5-year ave
rainfall across Queensland and northern NSW 750
demonstrate restocker intent given the right conditions. 700
650
In the November price rally, Queensland restockers
600
showed their appetite, purchasing 52% of EYCI eligible
550
cattle in saleyards across the state at a 54¢/kg cwt
500
premium to feeders. In contrast, Victorian restockers
450
secured 14% of the market and premiums to that of feeder
400
buyers narrowed from 20¢ earlier in the year to 7¢/kg cwt.
350
Restocker requirements for cattle have lessened in Jan Feb Mar Apr May Jun Jul Aug Sep Oct Nov Dec
Source: MLA
Victoria as herds have been largely rebuilt – the state's
herd size is forecast to return to average levels this year.
Figure 24: Australian cattle prices
Queensland restockers may enter the market in force in ¢/kg cwt Heavy steer Medium cow Trade steer
800
2018 if feed supplies allow. However, this may pull both
young and finished cattle higher, again potentially placing 700
Australia out of sync with global competitors. 600
500
As always, prices will be impacted both positively and
400
negatively by a number of variables such as seasonal
300
conditions, trading environment, currency fluctuations and
the pace of recovery in Australian beef production. 200
2010 2011 2012 2013 2014 2015 2016 2017
Source: MLA
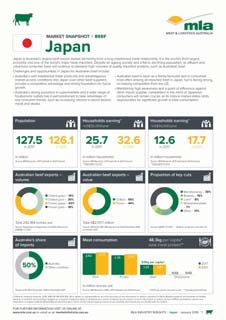
Industry projections 2018 – Australian cattle 10Situation and outlook for the Australian cattle industry
% change % change
2013 2014 2015 2016 2017e 2018 f 2018 f on 2017 f 2019 f 2020 f 2021 f 2022 f 2022 f on 2017 e
Cattle numbers ('000 head)*
cattle 29,291 29,100 27,413 26,845 27,245 27,550 27,916 28,373 28,954 29,370 8%
percentage change 3.1% -0.7% -5.8% -2.1% 1.5% 1.1% 1.3% 1.6% 2.0% 1.4%
Slaughterings ('000 head)
cattle 8,344 9,226 9,007 7,288 7,175 7,400 3% 7,700 7,900 8,050 8,200 14%
calves 690 688 667 542 480 550 15% 565 575 600 600 25%
total 9,034 9,914 9,675 7,830 7,655 7,950 4% 8,265 8,475 8,650 8,800 15%
Avg carcase weight (kg)
cattle 278.0 276.8 279.1 288.2 297.9 292.9 -2% 295.0 297.2 298.8 300.5 1%
calves 64.5 64.9 55.6 53.9 48.4 55.0 14% 55.0 55.0 55.0 55.0 14%
Production ('000 tonnes carcase weight)
beef 2,319 2,554 2,514 2,101 2,137 2,167 1% 2,272 2,348 2,405 2,464 15%
veal 40.4 41.3 32.9 24.2 23.2 30.3 30% 31.1 31.6 33.0 33.0 42%
total beef and veal 2,359 2,595 2,547 2,125 2,161 2,198 2% 2,303 2,379 2,438 2,497 16%
Cattle exports ('000 head)
cattle 850 1,292 1,332 1,126 855 850 -1% 900 900 900 900 5%
Beef exports** ('000 tonnes)
total, carcase weight 1,611 1,881 1,888 1,497 1,493 1,537 3% 1,637 1,709 1,761 1,811 21%
total, shipped weight 1,099 1,287 1,285 1,018 1,015 1,045 3% 1,114 1,163 1,198 1,232 21%
Domestic utilisation ('000 tonnes c/c weight)***
total, carcase weight 736 702 646 614 654 661 1% 666 670 678 685 5%
kg/head**** 31.8 29.9 27.1 25.2 26.4 26.3 26.1 25.9 25.8 25.7
Source: ABS, DAWR, MLA forecasts f = forecast (in italics)
* From 2016 is an MLA estimate based on ABS Data - Figures as of 30th June e = estimate
** excl. canned/misc, shipped weight
*** Beef and veal production plus imports, less exports of beef and veal and canned/processed beef, carcase weight
**** kg/head consumption calculated from total carcase weight divided by Australian population
Market snapshots
MLA's market snapshots aim to give producers a
better understanding of what’s driving demand in
the main markets where Australian red meat is
consumed. These will enable producers to be
more informed when having discussions with
their supply chain partners and – armed with a
better understanding of where their product is
going – make more informed business decisions
about their own production and on-farm
investments.
To view market specific snapshots click here
© Meat & Livestock Australia, 2018. ABN 39 081 678 364. MLA makes no representations as to the accuracy of any
information or advice contained in MLA’s Australian cattle industry projections 2018 and excludes all liability, whether in Click here for
contract, tort (including negligence or breach of statutory duty) or otherwise as a result of reliance by any person on such MLA’s Terms
information or advice. All use of MLA publications, reports and information is subject to MLA’s Market Report and of Use
Information Terms of Use. Please read our terms of use carefully and ensure you are familiar with its content.
Industry projections 2018 – Australian cattle 11You can also read