Supporting Papers Paper 1: Trends and drivers for the global and Australian wool industry
←
→
Page content transcription
If your browser does not render page correctly, please read the page content below
Supporting Papers

                         Paper 1: Trends and drivers for the global and
                         Australian wool industry

1   Supporting Papers to the report to the NSW Department of Primary Industries
     from Miracle Dog,Poimena Analysis, Scott Williams Consulting and DAFWA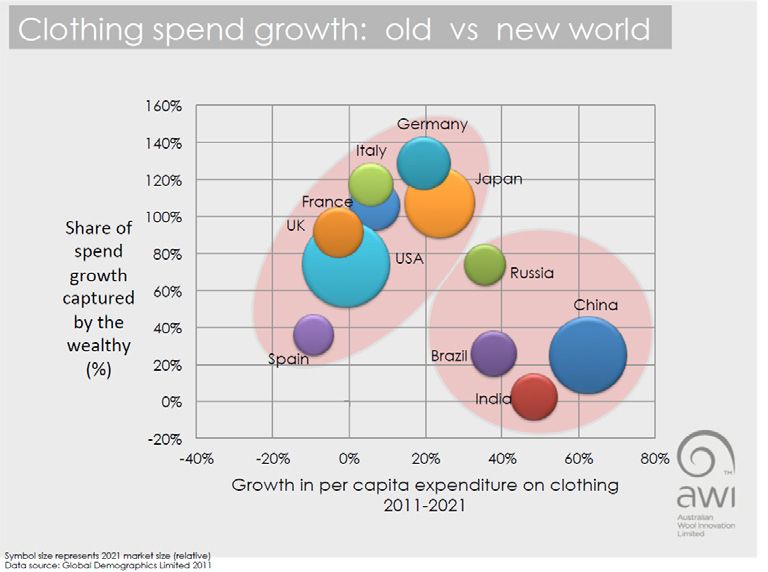
Published by the NSW Department of Primary Industries

NSW Wool Industry and Future Opportunities
A report to the NSW Department of Primary Industries from Miracle Dog, Poimena Analysis, Scott Williams
Consulting and DAFWA

Authors:
    Russell Pattinson (Miracle Dog)
    Chris Wilcox (Poimena Analysis)
    Scott Williams (Scott Williams Consulting)
    Kimbal Curtis (Department of Agriculture and Food Western Australia)

First published February 2015

www.dpi.nsw.gov.au
Acknowledgments
Photos courtesy of SheepConnect NSW - a project of Australian Wool Innovation Limited and NSW Department of Primary Industries.

JTN 13403

© State of New South Wales through the Department of Trade and Investment, Regional Infrastructure and Services, 2015.
You may copy, distribute and otherwise freely deal with this publication for any purpose, provided that you attribute the NSW Department of
Primary Industries as the owner.

Disclaimer: The information contained in this publication is based on knowledge and understanding at the time of writing (February 2015).
However, because of advances in knowledge, users are reminded of the need to ensure that information upon which they rely is up to date and to
check currency of the information with the appropriate officer of the Department of Primary Industries or the user’s independent adviser. The
report also contains views and recommendations based on estimates and projections, which are subjective and involve uncertainty. As actual
events or results may be different to those envisaged in the report, users should take this into account when making decisions.

2                      Supporting Papers to the report to the NSW Department of Primary Industries
                        from Miracle Dog, Poimena Analysis, Scott Williams Consulting and DAFWA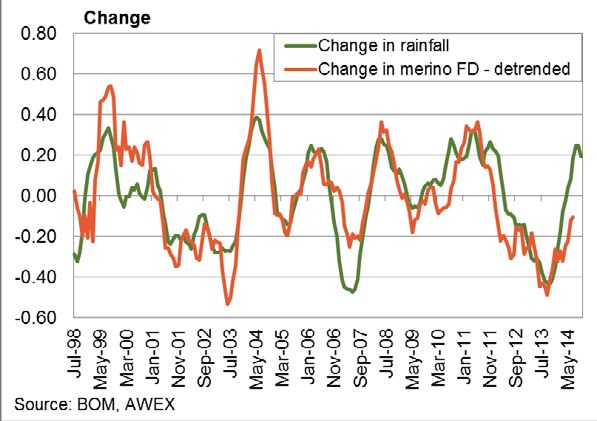
Trends and drivers for the global and
Australian wool industry
Contents
Introduction ........................................................................................................................... 2
Situational Analysis ............................................................................................................... 2
    World fibre production, consumption and prices ................................................................ 2
    World wool production ....................................................................................................... 3
    Australian wool production................................................................................................. 4
    Australian wool exports ..................................................................................................... 6
    World wool textile industry – location, trade, products, shifts and drivers ........................... 6
Likely trends.......................................................................................................................... 9
Potential implications for producers, industry and the NSW Government ............................ 11
Charts ................................................................................................................................. 14
References ......................................................................................................................... 19

1                     Supporting Papers to the report to the NSW Department of Primary Industries
                       from Miracle Dog,Poimena Analysis, Scott Williams Consulting and DAFWA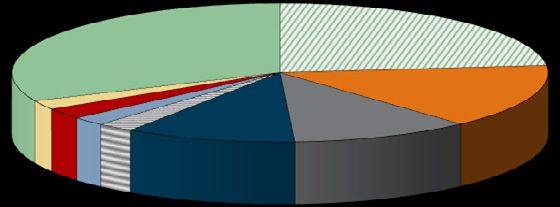
Introduction
The New South Wales wool industry is directly and significantly influenced by macro trends
and developments in the global textile industry, from the consumer level back through the
textile processing chain. These influences are reflected in the auction market both in the
short run (that is, over 6-12 months), the medium term (2-4 years) and the longer term (10
years). It is in the context of these macro trends and developments that wool and sheep
producers make their key business decisions and also how the NSW wool industry responds
and plans.
This paper provides an assessment of these trends and developments from both a supply
and demand perspective. It considers the major drivers and influences on the NSW wool
industry and provides the possible direction of these over the next 10 years, and what this
means for the NSW wool industry. The paper draws on existing reports from a variety of
sources, including the International Wool Textile Organisation, Australian Wool Innovation,
ABARES, the Mecardo website, Rabobank, Landmark, Michells, the Food and Agriculture
Organisation of the United Nations and the National Council of Wool Selling Brokers of
Australia. All charts referred to in the text are presented at the end of the document.

Situational Analysis
World fibre production, consumption and prices
Total world fibre consumption has risen steadily in the past fifty years and more, largely on
the back of a massive rise in production of man-made fibres, mainly oil-based synthetics
(Chart 1) 1. Cotton consumption has also expanded over this period, helped by a combination
of increased area planted around the world and productivity gains (in part due to the use of
genetically modified varieties). In contrast, global wool production has declined, notably in
the past 20 years.
The man-made fibres have replaced a large variety of materials, not only natural fibres, in a
range of consumer, industrial and technical applications and industries, as well as fuelling an
increase in the total use of textiles. Chart 2 shows the approximate breakdown of the major
end-uses of wool, cotton and man-made fibres. As can be seen, 21% of total fibre use is for
industrial purposes, a sector in which wool has virtually no presence and Australian wool
effectively none. A further 31% of fibre use goes to interior textiles, a segment which uses a
relatively small proportion of Australian wool. A total of 49% is used in apparel, which is the
major end-use of Australian wool. Therefore, the oft-quoted 1.3% share that wool has of total
world fibre volume consumption is misleading and irrelevant.
A more appropriate comparison, at least for Australian (and NSW) wool, is with production of
other fibres that are used in apparel – synthetic staple fibres (polyester staple and acrylic),
cotton and cellulosics (also known as viscose). As Chart 3 shows, production of these other
fibres has increased substantially in the past 20 years, notably synthetic staple fibres and,
more recently, viscose. Cotton production has also increased, although at a slower and more
variable rate.1 In contrast, world wool production has slid over the past 20 years.
In the past decade wool prices have in general performed relatively better than prices for
synthetic fibres and cotton (Chart 4) 2, even 18 micron wool prices. Cotton prices have
declined sharply in the past ten months under the weight of a large stockpile, mainly held in
China. Synthetic fibre prices have followed suit in recent months.
Chart 4, however, only shows the trends in prices, not the relativities between these fibres.
This is shown in Chart 5 3. As is well known, wool is considerably more expensive than

1
  International Wool Textile Organisation (2014)
2
  National Council of Wool Selling Brokers (2014c)
3
  National Council of Wool Selling Brokers (2014a)

2                 Supporting Papers to the report to the NSW Department of Primary Industries
                   from Miracle Dog, Poimena Analysis, Scott Williams Consulting and DAFWA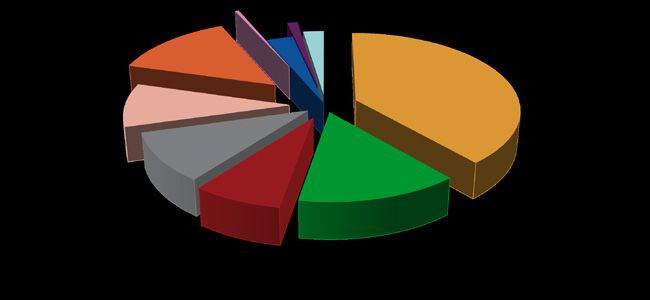
cotton or synthetic fibres. In general, the price ratio for 21 micron wool has increased in the
current decade, compared with the level prevailing in the 2000s, which was in turn higher
than in the 1990s. In contrast, there is no such discernible trend for either finer (19 micron)
or broader (28 micron). This probably reflects the relative decline in production of wool
between 21 and 23 micron, while production of 19 micron (and finer wool) has increased, as
has production of broader wool.

World wool production
World wool production has fallen significantly in the past 20 years or more, as a result of a
fall in and then low wool prices during the 1990s, as well as competition from other
agricultural enterprises. The lower wool prices were brought about by a significant decline in
demand in the early 1990s and, subsequently, the build-up then disposal of wool stockpiles
in Australia and, to a smaller extent, New Zealand and South Africa. Competition from other
agricultural enterprises has been a major factor in the decline in wool production, with the
main competing enterprise varying from country to country. For example, cropping and,
more recently, lamb production has been the major influence on sheep numbers (and hence
wool production) in Australia, together with seasonal conditions 4. In New Zealand, the use of
land for dairying or dairy support has been the major competing enterprise in recent years 5.
As Chart 6 shows, world wool production fell steadily from the peak in 1989/90 until around
2009/10, where it has since stabilised 6. The level in 2009/10 was the lowest in around 70
years. Stocks of wool held in wool-growing countries have also declined to low levels. At the
same time, after an initial decline, world sheep numbers have recovered in the past decade
from the lows seen in the early 2000s. The recovery in sheep numbers on the one hand and
the flat level of wool production at 70 year lows on the other suggest that there has been a
change in production type towards meat for sheep and away from wool sheep.
This is further indicated by the trends in production of wool that can be used for apparel
compared with wool that is destined for interior textiles. In the past 14 years, apparel wool
production has declined steadily while wool for interior textiles has increased slightly (Chart
7)6.
By country, Australia is the world’s largest producing country, with a share of 23%, followed
by China and New Zealand (Chart 8)6. In terms of wool for apparel, Australia accounts for
46%, with China accounting for 12%. For merino wool, Australia share is even higher. For
example, Andrew Woods estimates that Australia accounts for around 80% of world wool
production of 20 micron and finer 7.
This high share for Australia of apparel wool and, in particular, of merino wool has some
important implications. First and foremost, world merino wool prices are in essence
determined in A$ terms, which is unlike any other agricultural commodity. Prices in other
countries reference Australian merino wool prices. This means that increases in Australian
wool production will have a dampening effect on prices, while falls in Australian wool
production will support prices. By implication, efforts to boost wool production and
productivity in Australia will dampen prices. On the other side of the supply-demand
equation, lifting demand for merino wool at the consumer stage will mainly benefit Australian
wool growers because of Australia’s dominant position.

4
  Woods (2014a)
5
  Beef + Lamb NZ (2014)
6
  IWTO (2014)
7
  Woods (2014b)

3                Supporting Papers to the report to the NSW Department of Primary Industries
                  from Miracle Dog, Poimena Analysis, Scott Williams Consulting and DAFWA
Australian wool production
As is well known and documented, Australian wool production has fallen substantially in the
past two decades since the collapse of the Reserve Price Scheme (Chart 9) 8. The decline in
production in Australia has been driven by a combination of production declining in the
mixed cropping-livestock regions of Australia (due to better returns from cropping) 9,10, a shift
to a greater emphasis on lamb production in other regions, drought or dry seasonal
conditions in several years since 2000, and a retreat from sheep and wool production in
other regions due to wild dog predation.
The impact of these various influences are reflected in the change in wool production by
state since 1989/90 (Chart 10) 11. All states have seen a large decline since the peak year in
1989/90, which is to be expected. The decline has been significant even since 1999/00 in all
states, except for South Australia where production has increased. The largest and
continuing decline has been seen in Queensland, with the predicted production volume in
2014/15 set to be the lowest on record (with records going back to 1900/01).
New South Wales is currently Australia’s largest wool producing state, which it has been
since 1990/91 (before that, Victoria was the largest producing state through most of the
1970s and the 1980s). Like other states, NSW has experienced a major decline in
production since the peak production in 1989/90. The forecast production level in 2014/15
for NSW is higher than recent lows as production levels have stabilised to some extent in
recent years. NSW produces 9% of world wool production. If it were a country on its own,
NSW would be the world’s fourth largest wool producing country, after China, the rest of
Australia and New Zealand.
One well-known feature of production trends in Australia has been the rise in production of
superfine wool (18.5 micron and finer) in the past decade, even while total production in
Australia has declined. Australian production of superfine wool reached a peak in 2013/14 at
90 mkg greasy (59 mkg clean). This compares with production of 40 mkg greasy in 2000/01
and 32 mkg greasy in 1991/92. Superfine wool also reached a record share of the total clip
at 26.8%. Chart 11 shows the trends in production of superfine wool both for Australia and
globally 12. The increase in production has been due to a combination of breeding decisions
taken by stud breeders and producers in the past two decades plus, more recently, drought
and dry conditions in 2012 and 2013.
The breeding decisions by growers was in response to both the ‘get fine’ message promoted
by industry organisations in the 1980s and 1990s and the large price premiums for superfine
wool that were prevalent through the 1990s and the first half of the 2000s. The ‘get fine’
message came out of the observation by the International Wool Secretariat that fabric
weights had declined steadily for more than a decade beginning in the mid-1970s.
Significant price premiums for finer microns emerged in the 1980s 13. As Chart 12 shows,
these premiums hit a peak in 2001, around the time when the last of the stockpile (which
was mainly 21 to 24 micron wool) was sold off. The higher production of superfine wool
combined with the large decline in 21 to 24 micron wool has, inevitably, led to much lower
premiums for fine and superfine wool (Table 1).
8
National Council of Wool Selling Brokers (2014b)
9
Woods (2014a)
10
Woods (2014e)
11
Michell (2013). Updated with data from the Australian Wool Production Forecasting Committee and others.
12
Michel (2012). Updated with data from the Australian Wool Production Forecasting Committee and others.
13
Woods (2014d)
4 Supporting Papers to the report to the NSW Department of Primary Industries
from Miracle Dog, Poimena Analysis, Scott Williams Consulting and DAFWATable 1 Micron price differentials (% relative to 21 micron wool)14
Month and year 18 micron 19 micron 23 micron 26 micron 28 micron
July 1999 +125% +88% -22% -29% -29%
July 2001 +194% +85% -3% -19% -19%
July 2005 +30% +18% -3% -25% -38%
July 2009 +39% +22% -3% -19% -38%
July 2014 +4% +1% +0.2% -28% -41%
January 2015 +11% +5% -2% -27% -33%
10 year average +30% +16% -5% -32% -46%
In addition to the long-term downward trend in average fibre diameter brought about by the
breeding decisions by producers, seasonal conditions also influence fibre diameter. Drought
and dry conditions cause an increase in fine and superfine wool volumes and then return to
more normal seasonal conditions result in a move back to broader wool. Analysis by Andrew
Woods illustrates the influence, of seasonal conditions and the change in average fibre
diameter 15. Chart 13 shows the changes in rainfall and the change in average fibre diameter,
with the long-term trend to finer wool being removed. This chart is for the whole of Australia,
although it is relevant to NSW. The drop in rainfall beginning in late 2011 through to 2013 led
to a decline in the average micron over these years. Rainfall improved in the first half of
2014, which suggests that the average micron would increase in 2014/15. This has been
realised in the first half of the current 2014/15 season. Wool test data from the Australian
Wool Testing Authority for the 2014/15 season between July and December shows the
production of superfine wool (18.5 micron and finer) for Australia fell by 3.6% after increases
of 11.0% and 21.7% over the same six months in 2012/13 and 2013/14.
Andrew Woods concludes that the logic to ‘get fine’ was and is sound. He also considers
that the current low level of premiums are a cyclical response to the sharp increase in
superfine production volumes in the past two years, which has been caused by drought and
dry seasonal conditions 16.
The other, lesser covered, feature of production trends of the past 25 years has been that
producers drastically cut back production of wool in the 21 to 24 micron categories (see
Chart 10). In some cases producers, mainly in the wheat-sheep zone, left the industry or
dramatically reduced sheep numbers, shifting either to increased cropping or to beef cattle
(in Queensland). As well, stud breeders of 21-24 micron blood lines have moved to fine up
the wool from their stud stock over the past 20 years. While there was a large drop in the
1990s, the most significant decline occurred in the 2000s, probably when the impact of
breeding decisions started to come through. In addition to this drop in production, a large
proportion of the stockpile (which was over 700 mkg greasy, more than double current
Australian wool production) was wool in the 21 to 24 micron range. As a result, the supply of
wool in the 21 to 24 micron category is now a fraction of what it was in the 1990s.
The higher production of fine and superfine wool combined with the large decline in 21 to 24
micron wool has, inevitably, led to much lower premiums for fine and superfine wool.
14
AWEX.
15
Woods (2014c)
16
Woods (2014e)
5 Supporting Papers to the report to the NSW Department of Primary Industries
from Miracle Dog, Poimena Analysis, Scott Williams Consulting and DAFWAThe lower price premiums for superfine wool does not indicate, however, that demand for
superfine wool has declined or that demand for 21 to 24 micron wool has increased.
Analysis by Paul Swan of Australian Wool Innovation 17 concludes that since 2001/02 there
has actually been an increase in demand for wool in the 15 to 18 micron range, even though
there has been a substantial loss in premiums for traditional ‘spinners’ style fleece wool in
these diameters. This decline in premiums for ‘spinners’ style fleeces reflects a move of
processing away from Italy, Japan and Korea and towards China. In addition, there is a
structural change affecting demand for specialty weaving yarns based on the ‘spinners’-style
fleeces, with a move away from traditional Australian Superfine wool for weaving and
weaving yarns.
In terms of wool price trend in general, Australian wool prices in nominal terms have been on
a rising trend in since 2000 but have been have fallen slightly in real terms over the same
period (Chart 14) 18.
Australian wool exports
The trends in the value of Australian wool exports by micron category supports the
conclusion that demand for superfine wool has increased. As Chart 15 shows, the value of
Australia’s exports of 19 micron and finer wool has increased over time. While this has no
doubt been helped by the increased production of this wool, if demand had not increased,
the value of exports would have been flat (that is, the higher volumes would have been offset
by lower unit prices). By the same token, demand for 21 to 24 micron wool appears to have
declined over this period. That is, the higher absolute (and relative) price for this wool seen
over the past few years has not been enough to offset the large decline in available supply.
In terms of export destination, it is well known that exports to China have increased, while
exports to other destinations have declined, over the past two decades. As Chart 16 shows,
73% of Australia’s wool exports went to China in 2013/14, compared with 12% in 1991/92.
The second largest country destination was India, with a share of 8%. Exports to Western
Europe accounted for 10% of Australia’s exports, down from 39% in 1991/92 19.
An additional change in Australia’s wool exports has been the large decline in the share of
semi-processed wool that is exported. In 2013/14, 91% of Australia’s wool was exported in
greasy form and just 9% exported in a semi-processed form (scoured or carbonised. There
was no top exported). In the 1990s and early 2000s, around a quarter of Australian wool was
exported in scoured, carbonised or wool top form. However, the rise to dominance of China
and its preference for greasy wool rather than semi-processed wool resulted a decline in
demand for semi-processed wool from Australia, caused the closure and relocation of much
of Australia’s scouring and carbonising capacity, and all of its wool combing plants.
World wool textile industry – location, trade, products, shifts and drivers
Over the past two decades China has risen to be the world’s leading producer of man-made
fibres, processor of textile fibres and manufacturer and exporter of textiles, clothing and
interior textiles. This rise was the result of the market liberalisation of China’s economy and
access to a huge pool of cheap labour. China’s labour cost in 1998 was less than 50
UScents/hour (Chart 17), and the labour force seemed to be unlimited 20.
China now dominates the world wool textile industry, particularly for wool clothing. In
2013/14, China accounted for 48% of world imports of raw wool and 28% of world scoured
wool imports. In total, China imports 43% of the world’s imports of raw and scoured wool 21.
17
Swan (2014)
18
AWEX and Reserve Bank of Australia
19
Australian Bureau of Statistics, Australian Wool Industries Secretariat (2014) and NCWSBA (2014c)
20
Wang (2014)
21
International Wool Textile Organisation (2014)
6 Supporting Papers to the report to the NSW Department of Primary Industries
from Miracle Dog, Poimena Analysis, Scott Williams Consulting and DAFWAThis is an increase from 2001 when China’s share of world raw wool imports was 26%, its
share of scoured wool imports was 10% and its share of raw plus scoured wool imports was
22%. China is also the largest exporting destination for each of the five major wool producing
and exporting countries (Australia, New Zealand, Uruguay, Argentina and South Africa).
China is the world’s leading exporter of finished wool garments. In 2013, it exported 38% of
the world’s wool menswear and the same share of the world’s wool womenswear. It
accounted of 34% of world exports of wool knitwear. In total, China accounted for 37% of the
world’s exports of wool garments. In addition to this, China is a major producer and exporter
of wool carpets, being the second largest exporter (after India) with a 15% share.
In addition to its position as the world’s major exporter of finished wool products, China is
also the leading exporter of wool top, yarn and fabric, accounting for 27%, 18% and 32% of
world exports respectively17. Other major wool processing and exporting countries in 201317
were:
• Italy (second largest exporter of wool yarn, fabric, men’s and women’s woven wear and
knitwear);
• India (largest exporter of carpets and rugs);
• Hong Kong (yarn and knitwear);
• the United Kingdom (fabric, knitwear, women’s wear and carpets);
• Germany (fabric and men’s wear);
• Bangladesh (knitwear);
• Turkey (men’s wear, carpets)
• Romania (men’s and women’s wear); and
• Spain (women’s wear);
• USA (carpets); and
• Belgium (carpets).
The US was the major wool clothing import country in 2013, as it has been for several years.
It accounted for 18% of world imports of wool clothing, being the major importer of men’s
wool woven wear (25%) and women’s wool woven clothing (18%) 22. However, it was only
the 4th largest importer of wool knitwear, behind the UK, Japan and Italy. The US was also
the world’s largest importer of wool carpets and rugs in 2013. Other major importing
countries of semi-processed and finished wool products were:
• Japan (men’s wovenwear, women’s wovenwear, knitwear);
• UK (men’s wovenwear, women’s wovenwear, knitwear, yarn, carpets);
• China (yarn and fabric);
• Australia (carpets);
• Germany (men’s wovenwear, women’s wovenwear, knitwear, yarn, carpets); and
• Italy (yarn, fabric, knitwear).
One feature of the world wool processing industry is the complex trade flows which are
determined by manufacturing and retailing demands. For example, raw wool may go to
Malaysia for early stage processing, to be shipped to China via Hong Kong for spinning and
weaving/knitting, then to Vietnam for garment manufacture before export to the US for retail
sale.
The location of processing and manufacturing also changes, with labour intensive and
simple products tending to be most mobile. However, decisions are not purely based on
labour cost. The decisions could be based on a range of issues including labour costs,
22
International Wool Textile Organisation (2014)
7 Supporting Papers to the report to the NSW Department of Primary Industries
from Miracle Dog, Poimena Analysis, Scott Williams Consulting and DAFWAlabour productivity, environmental and trade policies, infrastructure, political stability, skilled
labour availability and ease of doing business 23.
The major wool clothing products traded in 2013 are shown in Chart 18. Knitwear and men’s
woven wear products dominate the global trade, although women’s wool overcoats features
as one of the major products 24.
Men’s suits remain a solid foundation of global wool use in apparel, as do men’s jackets and
trousers. Global trade in men’s wool suits fell in 2007, but appears to have stabilised since
then. Trade in the other major woven wool products have remained relatively stable (Chart
19)20.
As Chart 19 shows, women’s wovenwear products, other than coats, have declined in
importance over the past 20 years due to intense competition from products made of other
fibres, powerful price competition at retail and a trend to higher turnover of women’s
wardrobes. The latter point has been fed by ‘fast fashion’ retail chains (Zara, H&M, Uniqlo,
Primark), which feature high changeover of fashion lines and very competitive price points.
The quality of products in some (but not all) of these retailers is not high, leading
commentators to term the products the retailers sell as ‘disposable fashion’.
One trend that has been identified and discussed within the wool industry is casualisation of
clothing. This trend was identified by the wool industry over a decade ago and casualisation
remains a key determinant of AWI’s strategy, informing their product development and
marketing efforts 25. In theory, it means that demand for more formal wear (such as men’s
suits) could diminish, replaced by greater emphasis on separates, such as trousers and
jackets (with jackets likely to be less “structured” than in the past). It is thought that
casualisation is also likely to bring increased demand for knitwear, both traditional flat-bed
knitwear and circular knits used in the active leisurewear market.
However, the statistical evidence of the impact of casualisation on wool products and, in
particular, the decline of the suit is mixed. Rabobank, in a recent report on the fine wool
industry 26, presents data showing that global trade in wovenwear of all fibres has slipped in
value terms in the past two years, while knitwear (all fibres) has been rising since 2009.
While global data for wool products (presented earlier) may suggest some slippage in the
volume of trade in men’s wool suits, more detailed data from the US Department of
Commerce’s Office of Textiles and Apparel 27 is less clear-cut. This data suggests that while
US imports of men’s suits fell from a recent peak in 2005, it has been very steady since
2008. Imports of knitwear (which includes sweaters and knitted shirts) and men’s separates
(jackets and trousers) have been relatively stable after recovering from a dip in 2009. In
contrast, the most significant decline in recent times has been in woven wool womenswear.
This highlights the competitive pressure facing wool in womenswear, which has been
present for the past two decades. Chart 20 shows the trends.
In terms of the location of consumer demand, the major wool consuming markets at retail in
2011 28 were (in descending order) China/Hong Kong, the US/Americas, Japan, Italy, India,
Russia/ Belarus/Ukraine, Germany, the UK, South Korea and France 29. This has changed
somewhat since the mid-2000s 30. The three leading countries are the same now as then, but
Japan’s consumption has dropped by around 40%. In contrast, consumption by China and
the US/Americas is similar to mid-2000 levels. Consumption by Italy, at least in 2011, was
23
Wang (2014)
24
International Wool Textile Organisation (2014)
25
Swan (2013b)
26
Rabobank International (2014)
27
Office of Textiles and Apparel, US Department of Commerce (2014)
28
The latest data available from Australia Wool Innovation.
29
Australian Wool Innovation (2013)
30
International Wool Textile Organisation (2007)
8 Supporting Papers to the report to the NSW Department of Primary Industries
from Miracle Dog, Poimena Analysis, Scott Williams Consulting and DAFWAsteady, but there has been a significant decline for the UK, and lower consumption by
Germany. At the same time, there has been a substantial increase in consumption by Russia
and by India (a significant proportion of India’s consumption is likely to be carpets).
Likely trends
Global demand for textile fibres to 2025 and beyond will, in the first instance, be driven by
population and incomes. As shown in Chart 21 31, world fibre consumption has tracked the
rise in world Gross Domestic Product (as a proxy for incomes) and of population. Given the
projections for GDP and population (and particularly GDP) out to 2019, further strong growth
in consumption of textile fibres can be expected. While the forecasts from the International
Monetary Fund are only available to 2019, it can be assumed that further growth in GDP, at
least, will be seen out to 2025.
While world textile fibre consumption will grow, this increased volume of demand will be met
mainly by man-made fibres (see Chart 22). 32 Cotton consumption is also expected to grow.
For wool, future volume consumption will be constrained by slow or no growth in wool
production. As indicated by the chart, there is a potential growth of gap of 6% between the
long term growth in total fibre consumption and the long term decline in wool consumption.
This is an opportunity if the gap can be translated into increased value demand (as wool
production is not expected to increase and certainly cannot match the growth rate in
production of other fibres).
The increase in textile fibre consumption will, in part, be driven by increased demand for
clothing. Australian Wool Innovation has identified the countries which are expected to
experience the major growth in expenditure on clothing to 2021: China, India, Brazil and, to a
lesser extent, Russia (Chart 23) 33. All of these are lower income countries. Meanwhile the
advanced, wealthier countries in Europe, Japan and the US, are projected to experience
slower growth of clothing expenditure.
It should be noted in this context that research by Dr Elisabeth Nolan of the University of
Sydney, looking at auction price for the five years to 2012/13, found that economic growth
and consumer confidence indicators only account for less than 1% of variation in wool
prices, while the change in the price for substitute fibres accounts for 13%-14% of variation
in auction prices 34. The research reports that the major influence on variation in prices is
micron (accounting for 64% of variation for fleece wool and 49% for all wool). This analysis
was conducted using hedonic price modelling and contradicts earlier econometric analyses
which suggest that economic growth has the major influence on wool demand at retail and,
ultimately, at raw wool 35.
There is a strong relationship between per capita income and apparel wool consumption per
head, as shown in Chart 24 36. For the countries that AWI have identified as the strongest
potential growth countries for clothing, per capita wool consumption is low. It is hoped that as
incomes increase in these countries, per capita wool consumption follows the expansion
path indicated by the per capita consumption in Europe, Japan and Australia, and not the
path indicated by the US.
In many of these countries (both the growth and advanced countries) the population is
ageing and the 60+ years age group will become a larger proportion of the population. This
will influence demand and consumption trends for all products, including apparel 37. In
31
Wilcox (2012a)
32
Morris (2012)
33
Swan (2013a)
34
Nolan (2014)
35
See for example, Bureau of Agricultural Economics (1987)
36
Wilcox (2012b)
37
Swan (2013b)
9 Supporting Papers to the report to the NSW Department of Primary Industries
from Miracle Dog, Poimena Analysis, Scott Williams Consulting and DAFWAaddition to the ageing of the consumer population, consumers are increasingly concerned
with the environment and sustainability. Wool has a marked advantage over man-made
fibres for being a naturally, sustainably grown fibre 38. The International Wool Textile
Organisation sees this as a significant opportunity and, together with Australian Wool
Innovation, has developed a strategy and is conducting research and development to
support marketing of this feature.
Increased urbanisation in countries such as China and India will provide opportunities for
wool, both in the traditional suiting market and in active leisurewear 39.
The casualisation trend and the trend to active leisure wear will no doubt continue. This
provides opportunities for wool in knitwear, next to skin wear and fabrics suited to casual
wear. Fine and superfine wool is well suited to next-to-skin wear, which is typically used in
active wear, and this is a growing market segment. Rabobank reports that the active wear
market in the US accounts for around 16% of the total US clothing market, at US$33.7
billion, and it grew by 7% in 2013/14 40. AWI has also identified the lightweight knitwear
market as a key growth opportunity 41.
Some argue that the trend to casualisation will be at the expense of worsted suiting fabric
and, in particular, men’s wool suits. While casualisation combined with the intense retail and
fibre competition, has had a significant impact on wool consumption in women’s wear in the
past two decades, the statistical evidence is much less clear-cut that there is an observable
effect on demand for men’s suits, as well as men’s jackets and trousers, particularly since
2008. This may occur in the future, but seems more likely to affect the low and mid-price
point suits, rather than the upper and luxury price points. Note that low and mid-price point
men’s suits tend to use wool 20 microns and broader (or even 19 micron) often in blends
with polyester and/or viscose (or use not wool and are typically polyester-viscose blends),
while the upper and luxury price point suits favour fine and superfine wool.
There is likely to be some shift in processing location in the next decade, although this will
tend to be more focused at the garment making stage, which is much more labour intensive,
rather than early stage processing. This means that it is likely that knitting and garment
making may shift, to some extent, away from China towards countries in South-East Asia
and South Asia 42. However, other factors such as concerns about political and economic
stability in some regions (notably the Middle East and Africa) or Government regulation and
poor infrastructure (such as in India) may constrain such shifts.
Environmental regulations were introduced in China in 2013 and even tougher regulations
will come into force in January 2015. These regulations are likely to induce the closure of
older, less efficient scourers and combers, which will reduce excess capacity in early stage
processing in China. This is not to say, however, that there will not be some relocation from
China over the next decade. In the past 2-3 years, there have been new combing mills
established in Malaysia and Egypt, for example. Nevertheless, it seems very likely that
China will remain the major wool processor (from scouring to end garment) and the major
export destination for Australia’s raw wool over the next ten years, unless there is a
significant political or economic event to disrupt this scenario. This sovereign risk is the
major issue with China’s dominance of Australia’s exports of raw wool.
The importance of China will be sustained by the recent signing of the China-Australia Free
Trade Agreement (ChAFTA). Under the Agreement, Australia will be granted a Country
Specific Quota of 30 mkg clean which will be free of import duties (above the 30 mkg the
import duty is 1%). This compares with China’s wool imports of around 180 mkg clean in
38
Wilcox (2009)
39
The Woolmark Company (2005)
40
Rabobank International (2014)
41
Swan (2013a)
42
Wang (2014)
10 Supporting Papers to the report to the NSW Department of Primary Industries
from Miracle Dog, Poimena Analysis, Scott Williams Consulting and DAFWA2013 from Australia. This quota will increase by 5% per year for eight years to 46 mkg 43.
This access is considerably better than for wool exported to India, for example, which has
higher import and other duties. While ChAFTA will help sustain the importance of China, its
immediate impact and long term benefit will be very modest. The Australian Council of Wool
Exporters and Processors estimate that there will be a saving of $3 million each year on
import duties that will not need to be paid. This compares with a total value of Australian
exports to China in 2013/14 of $1.72 billion 44.
On the production side, it is difficult to envisage a solid increase in sheep numbers or, in
particular, wool production over the next decade. One of the key factors that will constrain a
sizeable increase in sheep numbers and wool production is the rising demand for food. The
Food and Agriculture Organisation (FAO) has projected that per person food consumption
will rise sharply in South Asia, Africa and Latin America in the next decade. This, combined
with steady growth in demand in East Asia, the Middle East and in advanced economies, will
mean that total food demand will rise sharply (see Chart 25) 45.
As a result global food production will need to rise. The FAO predicts that global food
production will rise by around 50% over the next 40 years, and a significant part of that
growth will be in developing countries. However, this growth is much smaller than the growth
seen in the previous 40 years (Chart 26)38 and may not match the increased demand. This
will mean that there is likely to be long-term upward pressure on food prices, which will
encourage increased grain production but would be a disincentive for fibre production, such
as wool.
This competition for land-use will probably hold back wool production. Meat and Livestock
Australia, in its latest projections released in mid-2014, projects that sheep numbers in
Australia will increase very slowly to 77 million head by 2020 (from 75.5 million head in
2013). This very slow rise in sheep numbers, if correct, will also mean only slow growth in
Australian wool production, particularly as there will continue to be competition from sheep
and lamb meat to wool production.
One likely trend is that production of superfine wool will pull back from the recent highs. This
will be achieved assuming that seasonal conditions return to normal (as opposed to the dry
conditions seen in 2012 and 2013). As well, the recent relatively low prices for superfine
wool may result in fewer superfine sheep and subsequently lower superfine wool production.
Potential implications for producers, industry and the NSW
Government
There are a number of key implications from this analysis for NSW wool producers, the NSW
wool industry and the NSW Government:
• Long term prospects for Australian and NSW wool will hinge most on global economic
conditions and income growth, not on the relative volume of wool production compared
with the production of other textile fibres or on the relative price of wool compared with
these other fibres. At best these provide the environment within which wool operates,
but otherwise are not a driver for decision making.
• Therefore, on the demand side, the focus should be on consumer requirements, notably
in the established wool consuming market in China, Europe, the US and, to a lesser
degree, Japan, as well as in the potential growth markets in India, Russia and Brazil.
These requirements include quality garments and luxury garments at appropriate price
points as well as products seen as being environmentally sustainable
43
National Council of Wool Selling Brokers of Australia (2014e)
44
Australian Wool Industries Secretariat (2014)
45
Battaglia (2013)
11 Supporting Papers to the report to the NSW Department of Primary Industries
from Miracle Dog, Poimena Analysis, Scott Williams Consulting and DAFWA• There is no clear-cut evidence that demand for worsted fabric for suits and jackets and
trousers has waned in recent years (since 2008), at least for men, in spite of the
casualisation trend. This means that demand for business wear (suits and separates for
men) will continue to be a mainstay for wool demand from Australia. Worsted weaving
yarn spinners require raw wool that has high tensile strength, low mid-point break and a
Hauteur of 68 mm (85 mm length in the greasy wool) 46. As a result, there will still be
solid demand for merino fleece wool of around 85 mm length with good tensile strength.
Increased urbanisation in China and India may bring growth for men’s business wear
(including suiting fabrics used in suits, jackets and trousers) but this is no certainty.
• There will be increased demand for active leisurewear (next to skin wear) and casual
garments (knitwear and unstructured trousers). Wool that is best placed to capitalise on
the growth in active leisurewear is fine wool of 19 microns and finer, and preferably 18
micron or even less. Recent research by the Sheep CRC suggests that consumers are
most comfortable wearing next-to-skin products made form 17 micron or even as low as
14-15 micron 47. These wools require good strength and length, so the preference is
mainly for fleece wools. Fine wool is also favoured for lightweight knitwear. Worsted
knitwear yarn spinners targeted at the flat-bedding knitting market require raw wool that
has, on average, a tensile strength of 30 to 32 Nkt, with an average Hauteur in the top of
58-60 mm (Europe) or 65mm (Asia). This means the raw wool purchased can be a
blend of fleece and pieces/bellies and prem shorn 48.
• In womenswear, the best performing product is overcoats for colder weather. Broader
wool is used in these products.
• There appears to be a shift away from traditional Australian superfine wool (with its
emphasis on crimp) towards a style (defined as topmaking type) due to increased
casualisation and a growth in woven-spun knitwear (i.e. for circular knitting).
• China will remain the major processor of wool and manufacturer of wool products over
the next 10 years. There may be some shifting of garment production to lower cost
countries, but China will remain the dominant force. As a result, it will still be the largest
destination for Australian and NSW wool (other than in the event of an unforeseeable
economic, political or social event in China) in 2025. The rise of China as a processor of
Australian wool in the past 20 years has been a major benefit to the Australian wool
industry. Contrary to some views 49, the wool processing industry in China is
decentralised and highly competitive. It will face some challenges in the near term,
notably from new environmental controls and tighter credit availability. In the longer
term, the transition of China’s economy to a more mature one based more on consumer
demand, branded and higher quality products and services industry will potentially be a
major benefit for wool with growth in purchasing of wool products by Chinese
consumers.
• Australia is the largest wool producing country in the world and dominates world wool
production below 20 microns. NSW is the Australia’s largest producing state and on its
own produces 9% of world wool production (if it were a country on its own, NSW would
be the world’s fourth largest wool producing country, after China, the rest of Australia
and New Zealand). Developments in Australia and NSW therefore have a major
influence on world supply of wool. Increases in wool production in NSW, for example,
could affect world prices for merino wool.
• Superfine wool premiums have been low largely due to a sharp increase in production of
superfine wool, not because of a collapse in demand. Demand for most categories of
46
Read (2014)
47
Rowe (2014)
48
Read (2014)
49
Rabobank International (2014)
12 Supporting Papers to the report to the NSW Department of Primary Industries
from Miracle Dog, Poimena Analysis, Scott Williams Consulting and DAFWAsuperfine wool have actually increased. The premium for superfine wool may return
towards the long-term average once the drought-induced aspect of the increased
production wanes. The increased demand for superfine wool and the potential growth in
demand for garments which use superfine wool justifies a continued emphasis on
producing sound superfine wool, although perhaps not the traditional Australian
Superfine wool (notably ‘spinner’s’ style fleece wool). The recent low price premiums for
superfine wool will naturally slow the emphasis on further fining the clip.
• In contrast, the very low levels of production of wool in of 21 to 24 microns has been the
reason for the good prices for these wools. Demand for this wool does not appear to
have increased. As well, this wool faces the most competition from man-made fibres (as
they can be substituted in place of this wool in blends). A significant increase in
production of this wool is likely to result in markedly lower prices.
• It is highly unlikely that early stage processing will return to Australia in any significant
way. China’s early stage processing industry is well established and has significant
overcapacity. New early stage processing plants have been established in the past 2-3
years in Egypt and Malaysia, and in the event of any unexpected change in China.
13 Supporting Papers to the report to the NSW Department of Primary Industries
from Miracle Dog, Poimena Analysis, Scott Williams Consulting and DAFWACharts
Chart 1:
World Consumption of Major Textile Fibres
(mill consumption – all end products)
million tonnes 0.27 1.16 22.97 63.18 87.31
%
100
100
90
80
Cellulosics 80 Industrial 21%
70
Wool
60 60 Interior Textiles 31%
50
40 Cotton Apparel 48%
40
30
20 Oil-Based 20
10 Synthetics
0 0
Australian Wool Cotton MMF* All fibres
Wool
Source: International Wool Textile Organisation Market Information Report 2014, CIRFS, The Woolmark Company, ICAC, rces: IWTO Market Information Report 2014, AWIPFC, Poimena Analysis, USDA and CIRFS.
Fibre Organon. e: * Man-made fibre (MMF) includes oil based and cellulosic fibres
Updated 30th September 2014
Chart 3:
Chart 4:
World Production of Wool and Competing Fibres
Trends in Textile Fibre Prices
'000 tonnes '000 tonnes
Competing Fibres Wool
8000 30000
US cents/kg Index: Jan 2006 =100 USc/kg Index: Jan 2006 =100
300 300
7000
Wool 25000 280 280
6000 Cellulosics Cotton 21um
260 260
20000 Polyester 28um
5000 240 240
Acrylic 18um
220 220
4000 15000
200 200
3000 180 180
10000
Cotton
2000 160 160
Synthetic staple
5000 140 140
1000
120 120
0 0 100 100
80 80
Source: CIRFS, USDA, Poimena Analysis, IWTO Market Information Report 2014
Source: NCWSBA Weekly Newsletter, AWEX, Cotton Outlook, PCI Fibres and Raw Materials, Poimena Analysis.
Note: For wool and cotton the years are seasonal years i.e. 2011 = 2010/11 season
Monthly average to January 2015
Chart 5: Chart 6:
Wool Price Competitiveness World Sheep Numbers, Wool Production and Stocks
US$ terms
World Opening Sheep Numbers World Wool Production and Stocks
'000 head mkg clean
Ratio Synthetics Ratio Cotton
8 8 1300 2600
2400 Production Opening stocks
7 7 1200 2200
6
2000
6 1100
1800
5 5 1600
1000
1400
4 4
900 1200
3 3 1000
800 800
2 2
600
700 400
1 1
19 micron 21 micron 28 micron 200
19 micron 21 micron 28 micron
0 0 600 0
Source: Poimena Analysis and International Wool Textile Organisation Market Information Report 2014
Source: NCWSBA Weekly Newsletter, AWEX, Cotton Outlook, PCI Fibres, CIRFS, Woolmark, Poimena Analysis Note: The year refers to the season ending e.g. 2000 = 1999/2000
Data to end January 2015 Data in 2014 is an estimate and in 2015 is a forecast
Note: for 28 micron wool, the ratio is against acrylic fibre
14 Supporting Papers to the report to the NSW Department of Primary Industries
from Miracle Dog, Poimena Analysis, Scott Williams Consulting and DAFWAChart 7:
World Wool Production:
Apparel Wool versus Interior Textile Wool 013
mkg clean
Australia
800 23.4%
Others
700 31.7%
600
500 Uruguay
400 2.1%
300 Apparel wool Interior textiles wool
200 South Africa
China
2.5%
100 14.9%
0 UK CIS New Zealand
2.0% 10.3% 10.9%
Argentina
2.2%
Source: International Wool Textile Organisation Market Information Report 2014, country statistics, Poimena Analysis ource: International Wool Textile Organisation Market Information Report 2014, FAO of the United Nations, Poimena
Updated 30th September 2014 Analysis, Delta Consultants
Chart 9: Chart 10:
Australian Sheep Numbers and Wool Production Australian Wool Production
1969/70 to 2014/15f mkg greasy
Wool Production by State
mkg greasy
Wool Production by Micron
325 500
Wool (mkg greasy) Sheep (million) 300 1979/80 1989/90 1991/92 1999/00
450
1999/00 2009/10 2009/10 2013/14
1200 200 275
2013/14 2014/15f 400 2014/15f
180 250
1000 350
Sheep 160 225
300
800 140 200
Wool 120 175 250
600 100 150 200
80 125 150
400 60 100 100
200 40 75
50
20 50
0
0 0 25
0
NSW Vic WA SA Qld Tas
Source: NCWSBA Weekly Newsletter, Australian Wool Production Forecasting Committee, ABS, ABARES Source: Michell Wool Whispers, AWTA, Australian Wool Production Forecasting Committee and Poimena Analysis
Wool production is shorn wool; sheep numbers are as at 1st July.
Updated for forecast December 2014
Chart 12:
Chart 11: Micron Price Differentials
World and Australian Superfine Wool Production % relative to 21 micron wool
% difference % difference
mkg clean AUSTRALIA % of total Australian prod
mkg clean WORLD % of total world prod
240% 10%
120.00 7% 120.00 30%
mkg clean % of Total Clip mkg clean % of Total Clip 220% 23 micron 26 micron
100.00 6% 100.00 25% 200% 18 micron 0%
180% 19 micron
5%
80.00 80.00 20%
160% -10%
4% 140%
60.00 60.00 15%
3% 120% -20%
40.00 40.00 10% 100%
2%
80% -30%
20.00 20.00 5%
1% 60%
40% -40%
0.00 0% 0.00 0%
20%
0% -50%
Source: Michell Wool Whispers, Poimena Analysis, AWTA, NZWTA, Cape Wools, FLA, Delta, American Sheep Industries, Source: AWEX
China Wool Textile Association. Data to January 2015
Updated for December 2014
15 Supporting Papers to the report to the NSW Department of Primary Industries
from Miracle Dog, Poimena Analysis, Scott Williams Consulting and DAFWAChart 14:
Chart 13:
Australian Wool Prices in Real and Nominal
Seasonal Effects in Merino Micron
Terms
EMI
Acents/kg clean
1500
1250
1000
750
500
Real Nominal
250
0
Source: Andrew Woods. Presentation to the Mecardo Wool Industry Webinar, September 2014 Source: AWEX and Reserve Bank of Australia
Chart 15:
Australian Wool Exports by Micron Category
12 month rolling aggregate
A$ million
3000
19um & finer
Malaysia Egypt
2500 20-23um
South 3% 1%
24-27um Others Others
17% Japan Korea
28um & broader 16% 4%
2000 Belgium 2%
3%
Czech Rep
1500 5%
Fmr USSR India
4% Italy 8%
1000 14%
USA Italy
500 5% 4%
China
0 South 12% China
Korea 73%
6% Germany France
Taiwan 9%
6%
8%
Source: Australian Bureau of Statistics, Australian Wool Industries Secretariat, Poimena Analysis
Data to December 2014
Chart 17: Chart 18:
Manufacturing wages are rising fast in Greater Asia World Trade* in Wool Clothing in 2013
(% share)
0.4% 2.9%
1.1%
2.4%
13.8% 38.7%
9.0%
14.0%
10.2%
7.7%
sweaters men's suits men's overcoats men's jackets
men's trousers women's overcoats women's suits women's jackets
women's skirts women's trousers
Source: IWTO Market Information 2014 Report, Foreign Trade Statistics, International Trade Centre,
Poimena Analysis & Delta Consultants
16 Supporting Papers to the report to the NSW Department of Primary Industries
from Miracle Dog, Poimena Analysis, Scott Williams Consulting and DAFWAChart 19: Chart 20:
World Trade of Main Woven Wool Products US Wool Garment Imports
(12 month moving aggregate)
million tonnes
60 ‘000 units
8,000
50
7,000
40 6,000
30 5,000
4,000
20
3,000
10 2,000
0 1,000
0
Dec- Dec- Dec- Dec- Dec- Dec- Dec- Dec- Dec- Dec- Dec- Dec- Dec- Dec-
00 01 02 03 04 05 06 07 08 09 10 11 12 13
Men's suits Men's overcoats Men's trousers
Women's overcoats Men's jackets Other womenswear Knitwear Men's suits Men's separates Women's
Source: OTEXA
Source: IWTO Market Information 2014 report, Country statistics, Trademap.org, Poimena Analysis
Data to September 2014
Based on total imports
Chart 21:
Growth in World Economy, Population and Fibre
Consumption
million tonnes
Index: 2000 =100 Oil based synthetics Cotton Cellulosics Wool
120
350
World economy
World population 100
Australia
300 World fibre consumption
80
Rest of World
250
60
gap for
200 40 +6%
150 20
100 0
2000 2005 2010s 2015p 2020p
Source: Chris Wilcox, Presentation to the 2012 Nanjing wool Market Conference, International
Monetary Fund, CIRFS, IWTO, USDA
Chart 23: Chart 24:
Per capita Apparel Wool Consumption vs
Income
0.7
Wool consumption (clean kg/per head)
0.6 S Korea
Italy
0.5 Australia
Trend Line
Japan UK
0.4
Germany
0.3
Spain France
0.2
USA
Russia
0.1
Turkey
India China
0.0
0 5,000 10,000 15,000 20,000 25,000 30,000 35,000 40,000 45,000 50,000 55,000
Income (US$/head)
: Chris Wilcox presentation to the WA Sheep Industry Leaders Forum, October 2012. Updated
tional Monetary Fund and The Woolmark Company
l wool consumption is apparel NDA at retail average 2011-2013 as estimated by Poimena Analysis. Income is US$ GDP
ad in 2013 on a purchasing power parity basis.
17 Supporting Papers to the report to the NSW Department of Primary Industries
from Miracle Dog, Poimena Analysis, Scott Williams Consulting and DAFWAChart 25: Chart 26:
Food Consumption: Actual and Projected Increases in Global Food Production
kcal per capita per day % change
kcal/cap/day
4000
2007 to 2050 proj
Developed countries
3500 1961 to 2007
3000
Developing countries
2500
2000
World
1500
1964-66 1974-76 1984-86 1997-99 2005-07 2015 2030
0% 50% 100% 150% 200% 250% 300% 350%
Industrial countries East Asia
South Asia Sub-Saharan Africa % change over time period
Latin America/Caribbean Middle East and North Africa
Source: Daniela Battaglia FAO. Presentation to the 82nd IWTO Congress, Biella. 2013 Source: Daniela Battaglia FAO. Presentation to the 82nd IWTO Congress, Biella. 2013
18 Supporting Papers to the report to the NSW Department of Primary Industries
from Miracle Dog, Poimena Analysis, Scott Williams Consulting and DAFWAReferences
AWEX Weekly Market Report. Various.
Australian Wool Industries Secretariat (2014), Exports of Australian Wool monthly reports
(August 2014).
Australian Wool Innovation (2013), Strategic Plan: 2013/14 to 2015/16.
Battaglia, D (2013). Outlook and Issues for Global Agriculture. Presentation to the 82nd
IWTO Congress, Biella. FAO
Beef + Lamb NZ (2014), New Season Outlook 2014/15, September 2014.
Bureau of Agricultural Economics (1987), Returns from wool promotion in the United States.
An AWC-BAE Analysis.
International Wool Textile Organisation (2007), Market Information Report 2007.
International Wool Textile Organisation (2014), Market Information Report 2014. (Published
December 2014)
Michell (2012), Wool Whispers, October 2012. Updated with data from the Australian Wool
Production Forecasting Committee and others.
Michell (2013), Wool Whispers, October 2013. Updated with data from the Australian Wool
Production Forecasting Committee and others.
Morris, D (2012), European Synthetic Fibre Association (CIRFS), reported by Chris Wilcox in
a presentation to the WA Sheep Leaders Forum, October 2012.
National Council of Wool Selling Brokers (2014a), Weekly Newsletter, 2014/19, 23rd May
2014
National Council of Wool Selling Brokers (2014b), Weekly Newsletter, 2014/33, 29th August
2014
National Council of Wool Selling Brokers (2014c), 2013/14 Season Wall Chart.
National Council of Wool Selling Brokers (2014d), Weekly Newsletter, 2014/36, 26th
September 2014
National Council of Wool Selling Brokers of Australia (2014e), Weekly Newsletter, 2014/44,
21st November 2014
Nolan, E (2014), The economic value of wool attributes phase 2. A report prepared for
Australian Wool Innovation. University of Sydney. November 2014.
Office of Textiles and Apparel, US Department of Commerce (2014),
http://otexa.ita.doc.gov/. Data downloaded on 26th November 2014
Rabobank International (2014), Walking a Fine Line: Strategic Blunder or Just Bad timing?
The Fine Wool Dilemma. Rabobank Industry Note #461. November 2014.
Read, R (2014), Michells. Pers comm. November 2014
Rowe, J (2014), Australian ultrafine wool at the crossroads. Internal Sheep CRC discussion
paper, June 2014. And presentation to the Annual General Meeting of the Federation of
Australian Wool Organisations, August 2014.
Swan, S (2013a), Challenges and Opportunities: Strategic Market Outlook. Presentation to
the IWTO 2013 Congress, Biella.
Swan, P (2013b), Opportunities to grow demand for wool. Presentation to the Nanjing Wool
Market Conference. September 2013.
19 Supporting Papers to the report to the NSW Department of Primary Industries
from Miracle Dog, Poimena Analysis, Scott Williams Consulting and DAFWAYou can also read