GALAXY ZOO: 3D - CROWDSOURCED BAR, SPIRAL, AND FOREGROUND STAR MASKS FOR MANGA TARGET GALAXIES
←
→
Page content transcription
If your browser does not render page correctly, please read the page content below
MNRAS 507, 3923–3935 (2021)                                                                                      https://doi.org/10.1093/mnras/stab2282
Advance Access publication 2021 August 10

Galaxy Zoo: 3D – crowdsourced bar, spiral, and foreground star masks for
MaNGA target galaxies
Karen L. Masters ,1‹ Coleman Krawczyk,2 Shoaib Shamsi,1 Alexander Todd,2,3 Daniel Finnegan,1,4
Matthew Bershady,5,6,7 Kevin Bundy,8 Brian Cherinka,9 Amelia Fraser-McKelvie ,10,11
Dhanesh Krishnarao,9 Sandor Kruk,12 Richard R. Lane,13 David Law,9 Chris Lintott,14
Michael Merrifield ,15 Brooke Simmons,16 Anne-Marie Weijmans17 and Renbin Yan 18
Affiliations are listed at the end of the paper

                                                                                                                                                          Downloaded from https://academic.oup.com/mnras/article/507/3/3923/6347355 by guest on 03 November 2021
Accepted 2021 August 3. Received 2021 August 2; in original form 2021 May 27

ABSTRACT
The challenge of consistent identification of internal structure in galaxies – in particular disc galaxy components like spiral arms,
bars, and bulges – has hindered our ability to study the physical impact of such structure across large samples. In this paper we
present Galaxy Zoo: 3D (GZ:3D) a crowdsourcing project built on the Zooniverse platform that we used to create spatial pixel
(spaxel) maps that identify galaxy centres, foreground stars, galactic bars, and spiral arms for 29 831 galaxies that were potential
targets of the MaNGA survey (Mapping Nearby Galaxies at Apache Point Observatory, part of the fourth phase of the Sloan
Digital Sky Surveys or SDSS-IV), including nearly all of the 10 010 galaxies ultimately observed. Our crowdsourced visual
identification of asymmetric internal structures provides valuable insight on the evolutionary role of non-axisymmetric processes
that is otherwise lost when MaNGA data cubes are azimuthally averaged. We present the publicly available GZ:3D catalogue
alongside validation tests and example use cases. These data may in the future provide a useful training set for automated
identification of spiral arm features. As an illustration, we use the spiral masks in a sample of 825 galaxies to measure the
enhancement of star formation spatially linked to spiral arms, which we measure to be a factor of three over the background
disc, and how this enhancement increases with radius.
Key words: surveys – methods: data analysis – galaxies: bar – galaxies: spiral – galaxies: structure.

                                                                                  Many authors resort to parameterizing the complex 3D data into
1 I N T RO D U C T I O N
                                                                               azimuthally averaged radial gradients. For example, several works
We are in an era of large-scale surveys of resolved spectroscopy, with         all using MaNGA data have looked at azimuthally averaged stellar
a number of galaxy surveys aiming to obtain integral field unit (IFU;          population parameters (e.g. Li et al. 2015; Ibarra-Medel et al. 2016;
sometimes integral field spectrograph, IFS) data for large samples             Goddard et al. 2017; Wang et al. 2018; Chen et al. 2019, 2020; Parikh
of galaxies. While the largest of these to date is Mapping Nearby              et al. 2021), or gas properties (e.g. Belfiore et al. 2017, 2018). Many
Galaxies at Apache Point Observatory (MaNGA, Bundy et al. 2015;                of these works (e.g. Goddard et al. 2017; Wang et al. 2018; Chen et al.
part of the Sloan Digital Sky Surveys, or SDSS-IV, Blanton et al.              2020; Parikh et al. 2021) do comment on a difference in gradients
2017), it follows a long history of similar surveys (e.g SAURON,               linked to galaxy morphology (e.g. early-types tended to have flatter
de Zeeuw et al. 2002; ATLAS-3D, Cappellari et al. 2011; CALIFA,                gradients than late-types), but in general they do not consider the
Sánchez et al. 2012; DiskMass, Bershady et al. 2010; SAMI, Bryant             systematics introduced into azimuthally averaged radial gradients by
et al. 2015).                                                                  non-axisymmetric features such as bars, and spiral arms.
   The promise of IFU spectroscopy is that, through producing                     IFU data, such as that provided by MaNGA, have the potential
spatially resolved spectral cubes, the observations can reveal the             to go beyond these 2D views of galaxies. Nearby galaxies are not
details of how galaxy evolution proceeds inside statistically signif-          point sources, and most are not azimuthally symmetric or smooth.
icant samples of nearby galaxies. These data provide both stellar              For example Galaxy Zoo (Lintott et al. 2011) revealed that most
and gaseous kinematics and maps of emission line properties. These             galaxies in the SDSS Main Galaxy Sample showed spiral structure,
data can also be used, via stellar population modelling (e.g. Pipe3D;          and many of these disc galaxies contain bars – significant central non-
Sánchez et al. 2016) to create maps of chemical composition, stellar          axisymmetric structure, e.g. Masters et al. (2011) find 29.4 per cent
population ages, star-formation rates (SFR), and more. However,                of Galaxy Zoo spirals have strong bars. In addition, the presence of
visualization of large samples of these highly dimensional data is a           foreground stars and foreground or background galaxies can present
challenge.                                                                     a challenge for the automated data reduction pipelines needed for
                                                                               large samples.
                                                                                  It was considerations such as these that inspired the idea for the
   E-mail: klmasters@haverford.edu                                            Galaxy Zoo: 3D (GZ:3D) project presented in this paper, with the


C 2021 The Author(s)

Published by Oxford University Press on behalf of Royal Astronomical Society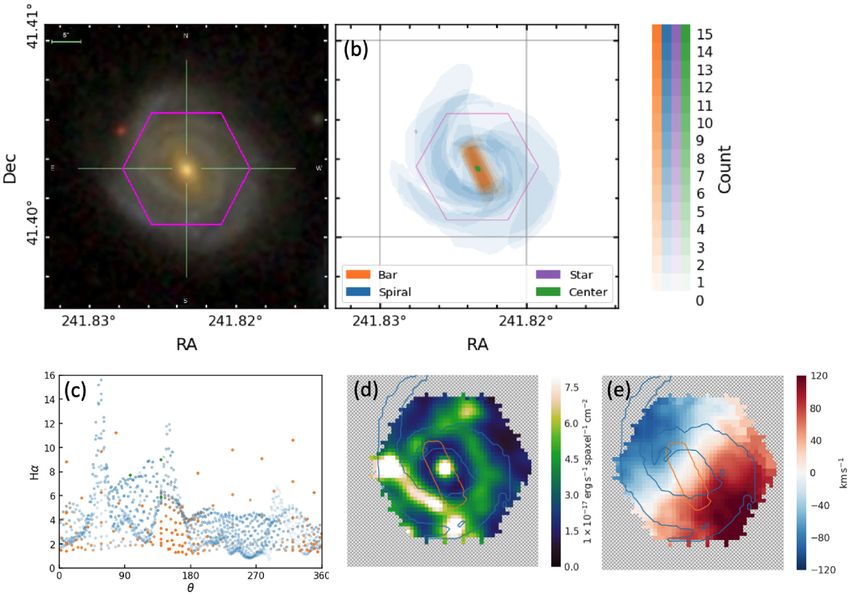
3924        K. L. Masters et al.
                      Table 1. Galaxy samples and selection in GZ:3D. We release masks from the final phases only, as we only
                      recommend their use for science. The number are MaNGA targets shown to GZ:3D volunteers for each workflow
                      task, not the number that have successful masks or clusters.

                      Task                     DR14       All MaNGA targets             DR17∗                GZ2 Pre-selection
                                             (Phase 1)         (Phase 2)           (Subset of Phase 2)

                      Galaxy centre            2778             29 831                       9188                   All
                      Foreground stars         2778             29 831                       9188                   All
                      Bars                      175              5456                        1355              Nbar > 0.2Ntot
                      Spirals                   294              7418                        1973              N1-4 > 0.2Ntot
                      ∗ The  total DR17 sample size will be 10 010 unique galaxies with high quality data cubes (SDSS Collaboration
                      et al., in preparation); the number in this table is the number also in GZ:3D.

                                                                                                                                                          Downloaded from https://academic.oup.com/mnras/article/507/3/3923/6347355 by guest on 03 November 2021
goal of identifying internal structures, galaxy centres (whether the           et al. 2013) on the Sloan Foundation 2.5-m telescope (Gunn et al.
main target or additional galaxies), and foreground stars in MaNGA             2006) to observe nearby galaxies, with the target selection described
target objects. GZ:3D is a citizen science project that provides bar,          in Wake et al. (2017). For details of MaNGA observing, reduction,
spiral arm, central, and foreground star masks for almost all MaNGA            and calibration, see Law et al. (2015, 2016, 2021) and Yan et al.
targets galaxies. Used in conjunction with MaNGA galaxy survey                 (2016a, b). After the MaNGA data are reduced, they are run through
data, it allows for the selection of various regions of interest from the      a Data Analysis Pipeline (DAP; Belfiore et al. 2019; Westfall et al.
IFU data cubes and associated analysis output maps.                            2019), which outputs maps of various quantities. In this work we
   Galaxy Zoo: 3D does not provide information to separate bulge               make extensive use of the Marvin visualization and data access tools
and disc components of galaxies. Other techniques which use semi-              designed for use with MaNGA data and maps (Cherinka et al. 2019).
automated 2D decomposition, based on images (Catalán-Torrecilla                   The targeting files presented in Wake et al. (2017) list roughly
et al. 2017; Kruk et al. 2018), or spectral data cubes themselves              three times as many potential MaNGA galaxies as were planned to
(Tabor et al. 2019), are able to do this. However multicomponent               be observed to complete the sample of N ∼ 10 000. At the time
decomposition including both bars and spirals is beyond the ability            this project was designed, it was unclear exactly which MaNGA
of most codes, without significant human intervention (see Lingard             target galaxies would ultimately be observed, so MaNGA target
et al. 2020 for an attempt to leverage Galaxy Zoo-style crowdsourcing          galaxies were considered as the input sample for Galaxy Zoo: 3D,
to help with this challenge). Even neglecting a strong bar component           and masks for 29 813 galaxies are released for use. MaNGA finished
can lead to a bias in the bulge-to-total ratios for barred galaxies (e.g.      observing in 2020, with a final total of 10 010 high quality data
as shown by Méndez-Abreu et al. 2017; Kruk et al. 2018). The GZ:3D            cubes with unique MaNGA-IDs which will be released in SDSS-IV
technique was developed to leverage human pattern recognition, and             Data Release 17 (DR17; SDSS Collaboration in preparation). The
provide a guide to the location of complex internal structures in              majority of these (9188, or 92 per cent) have Galaxy Zoo: 3D analysis.
MaNGA data.                                                                    Detailed Galaxy Zoo (GZ2) classifications (Willett et al. 2013) are
   We introduce the MaNGA survey, SDSS images, and the building                available for most of the MaNGA target galaxies (these data were
of the Galaxy Zoo: 3D site on the Zooniverse Project Builder in                released as a Value Added Catalog, or VAC in DR15, Aguado et al.
Section 2. This section also contains details of how the crowdsourced          2019),1 and this was the input sample used to create the GZ:3D list.
classifications are aggregated and turned into spatial pixel (spaxel)          MaNGA galaxies were classified in Galaxy Zoo (mostly GZ2) across
masks (for bars and spirals) or clustered positions (for galaxy centres        a range of phases, and some are missing due to position errors, or
and foreground stars). Section 3 gives an overview of the output from          other catalogue issues. We decided to only run GZ:3D on galaxies
Galaxy Zoo: 3D with a subsection on each of the types of identified            that had GZ2-type morphologies available, resulting in 822 observed
objects and structures. As well as showing some example data and               MaNGA galaxies with no GZ:3D masks (128 of these are MaNGA
uses, this section provides an overview of how Galaxy Zoo: 3D results          filler, or ancillary targets not in the original targeting file, and 434
have been used to date in published works. As an example usage of              have since been classified in Galaxy Zoo,2 but not yet GZ:3D). The
GZ:3D we present new results on the fraction of star formation                 benefit of limiting the sample to galaxies with GZ2 classifications was
(SF) found inside spiral arm masks in MaNGA galaxies, as well as               that in planning GZ:3D we were able to ask volunteers to identify the
revealing how this enhancement increases with radius. We provide               region covered by bars and spirals only in those galaxies in which
a section on data access and some advice on how the reader might               GZ2 volunteers had marked such features visible (the numbers of
use the GZ:3D masks in combination with MaNGA (Section 4) and                  which are shown in Table 1). Furthermore, volunteer testing indicated
finish with a short summary and conclusions (Section 5).                       that drawing spiral arms on very flocculent spirals (5 + arms in the
   Where physical units are employed we use a value of H0 =                    GZ2 classifications) was prohibitively hard, so only galaxies with
70 km s−1 Mpc−1 .                                                              spirals with n ≤ 4 arms were included in GZ:3D. In this project, we
                                                                               cared about what volunteers could see to be able to draw, rather than
                                                                               the real underlying morphology of a galaxy, so we used raw vote
2 METHODS                                                                      counts (not debiased to account for the blurring effects of distances,

2.1 Sample selection
                                                                               1 Available at
The goal for the Galaxy Zoo: 3D project was to provide masks for                  https://www.sdss.org/dr16/data access/value-added-catalogues/?vac i
use with all galaxies observed by the MaNGA survey. The MaNGA                  d = manga-morphologies-from-galaxy-zoo
survey, part of SDSS-IV (Blanton et al. 2017), used the MaNGA                  2 An update to the MaNGA-Galaxy Zoo match will be released as a VAC in

IFU bundles (Drory et al. 2015) and the BOSS Spectrograph (Smee                DR17

MNRAS 507, 3923–3935 (2021)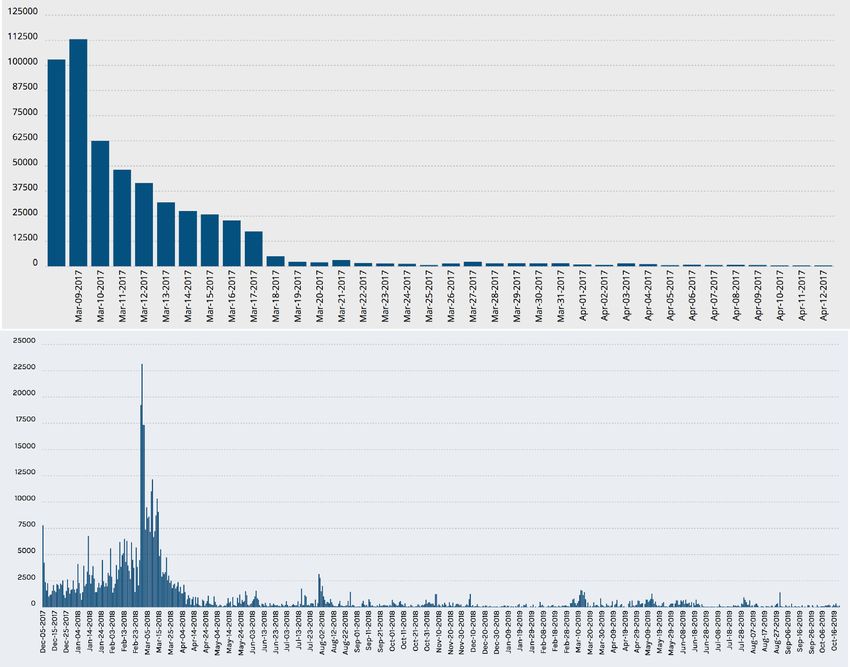
Galaxy Zoo: 3D                 3925

                                                                                                                                                                    Downloaded from https://academic.oup.com/mnras/article/507/3/3923/6347355 by guest on 03 November 2021
Figure 1. A screenshot of the spiral arm classification page from the second phase of the project (after all drawings had been collected), with an example spiral
drawn. This is MaNGA-ID 1-633990.

as described by Willett et al. 2013; Hart et al. 2016), and because                2.3 Building the site
we did not want to risk missing galaxies with bars or spirals, we
                                                                                   The GZ:3D project website4 was built using The ZOONIVERSE
used conservative cuts of Nbar > 0.2Ntot , where Nbar is the number
                                                                                   PROJECT BUILDER software,5 which allows users to build simple
of volunteers who reported seeing a bar, and Ntot is the total number
                                                                                   Zooniverse citizen science projects via a browser interface. Four
of volunteers who saw the galaxy in GZ2 (typically around 50) and
                                                                                   tasks (or workflows) were developed: (1) clicking on the image to
N1-4 > 0.2Ntot , where N1-4 is the sum of the number of volunteers
                                                                                   identify the location of one or more galaxy centres; (2) clicking on
who reported seeing 1, 2, 3, or 4 spiral arms. These cuts are aimed
                                                                                   the image to identify the location of one or more foreground stars;
to make a complete, but not a clean sample of galaxies with visible
                                                                                   (3) drawing a box around the region of a galactic bar; and (4) a
bars (this cut should pick up both weak and strong bars; Géron et al.
                                                                                   free-hand spiral arm drawing tool to draw around spiral arms. The
2021) and spirals, but will miss the most flocculent spiral types.
                                                                                   classification interface for spiral arm marking from the second phase
   For the first phase of the project, we used a sub-sample of MaNGA
                                                                                   is shown in Fig. 1. The interface from the first phase, and for bar
target galaxies – those that had been observed and released in the
                                                                                   drawing and for galaxy centre/foreground star marking were similar.
SDSS-IV DR14 (Abolfathi et al. 2018) release of MaNGA (internally
                                                                                      Volunteers had access to a tutorial to guide them through each task,
known as MaNGA Product Launch 5 – MPL-5). For the the second
                                                                                   and were able to select which task (or workflow) to participate in.
(and final) phase, we used the entire target sample (Wake et al. 2017).
                                                                                   A decision was made to reduce cognitive load by asking volunteers
A summary of the sample sizes, including the numbers of galaxies
                                                                                   to do only one task on each galaxy (galaxy centres/foreground stars
with GZ:3D masks in the final DR17 MaNGA sample, is provided
                                                                                   together) at a time. In the first phase, volunteers were asked to identify
in Table 1. We recommend the use of only the final GZ:3D masks
                                                                                   features only inside the hexagon on the gri colour image of the galaxy;
(from the second and final phase) but discuss data from the first phase
                                                                                   this instruction was modified in the second phase (as is discussed
because it was used to inform decisions on the final phase.
                                                                                   below).
                                                                                      After a beta test period in the Summer of 2016, the project
                                                                                   launched on 2017 March 8 with a Newsletter sent to the entire
2.2 Generating images                                                              Zooniversevolunteer base. Fig. 2 shows a count of volunteer en-
Custom cutouts of gri images from SDSS-I/II legacy imaging (Gunn                   gagement rates with the site during both this first and the later
et al. 1998; York et al. 2000; Strauss et al. 2002) with an overlay of             second phase. The galaxy centre/foreground star marking workflows
the approximate location of the MaNGA hexagon (representing the                    attracted significantly higher rates of engagement than the bar or
hexagonal fiber bundle; Drory et al. 2015) were generated. SDSS                    spiral arm drawing tasks. Galaxies were retired from a specific
images have median resolution of 1.3 arcsec (in r-band)3 . GZ:3D                   workflow when 15 volunteers had made marks for that task. All
images were selected to have a pixel scale of 0.099 arcsec per pixel               first phase galaxies were retired from the galaxy centre/star marking
and were generated to have a field of view of 52 arcsec (525 × 525                 task on 2017 March 17, resulting in a notable drop of volunteers on
pixels), selected to be twice the size of the largest MaNGA bundle                 the project after that day (see Fig. 2), when only the more challenging
on the sky.                                                                        bar and spiral arm drawing tasks remained.

                                                                                   4 https://www.zooniverse.org/projects/klmasters/galaxy-zoo-3d
3 https://www.sdss.org/dr16/imaging/other   info/#SeeingandSkyBrightness           5 https://www.zooniverse.org/lab

                                                                                                                           MNRAS 507, 3923–3935 (2021)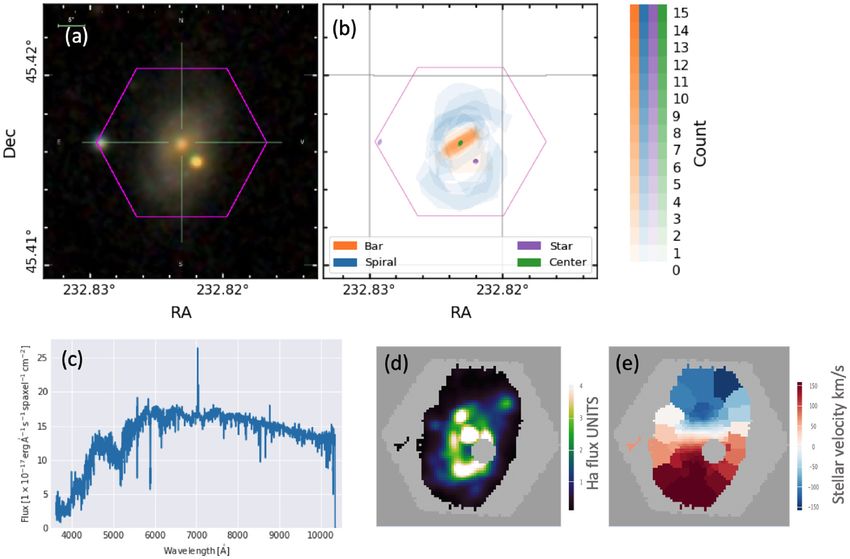
3926         K. L. Masters et al.

                                                                                                                                                                 Downloaded from https://academic.oup.com/mnras/article/507/3/3923/6347355 by guest on 03 November 2021
Figure 2. Upper: The total number of classifications recorded by the project by day from launch until 2017 April 12. The galaxy centre/foreground star marking
task was completed on 2017 March 17. Lower: The total number of classifications in the second phase of data collection from 2017 December 4 to 2019 October
20.

   After some analysis had been done with the initial subject set of              phase. This second phase launched to previously registered GZ:3D
DR15 MaNGA galaxies, it was noticed that the hexagons indicated                   volunteers on 2017 December 4, and classifications were collected
on the initial subject set were slightly too small. This was caused               at a more modest rate than in the first phase (see the lower panel of
by an error in interpreting hexagonal diameters √      – the first phase          Fig. 2). A boost up to a peak rate of roughly 23 000 classifications
images included a hexagon that was a factor of 2 3/5 too small –                  per day was obtained by emailing Galaxy Zoo volunteers on 2018
the difference between corner-to-corner versus edge-to-edge sizes.                February 27. Following this, foreground stars and galaxy centres
In addition, some of the MaNGA target galaxies did not have GZ2                   were completed on 2018 April 5, and bar masks were completed
classifications available in Willett et al. (2013) at the time of launch          in early 2018 August. A post to the Galaxy Zoo blog7 brought
and had been added as a small set to the main Galaxy Zoo site.6 Other             another small spike in classifications, after which spiral masks
small changes were made to improve the classification experience:                 took until October 2019 to complete at a modest rate of 500–1000
                                                                                  classifications per day.
   (i) Galaxies with less obvious (i.e. lower cuts on GZ2 morphology
votes) bars and spiral arms were included for feature marking.
   (ii) A button was added to indicate if an image does not contain a             2.4 Generating masks
galaxy/bar/spiral arms.
                                                                                  In GZ:3D, every task was retired when it had been done by 15
   (iii) We asked volunteers to identify features both inside and
                                                                                  volunteers, although sometimes the total number recorded is larger
outside of the hexagon, partly to catch foreground stars just outside
                                                                                  than 15. All classifications are combined to created a single consensus
that can impact the light that is collected by MaNGA, but also because
                                                                                  classification for each task.
the drawn hexagon (even at the correct size) is an approximation of
                                                                                     For the galaxy centre, and foreground star marking tasks, a point
where MaNGA bundles collect light in the dither pattern described
                                                                                  clustering algorithm (density-based spatial clustering of applications
in Law et al. (2015).
                                                                                  with noise or DBSCAN; Ester et al. 1996) was used.8 A cluster of
  For the second phase of GZ:3D we included all MaNGA target                      points (or volunteer clicks) was defined as a group of three or more
galaxies, including repeating those previously classified in the first
                                                                                  7 https://blog.galaxyzoo.org
                                                                                  8 Specifically the scikit-learn implementation available at https://scikit
6 www.galaxyzoo.org                                                               -learn.org/stable/about.html#citing-scikit-learn

MNRAS 507, 3923–3935 (2021)
Galaxy Zoo: 3D              3927
                                                                                     finding offset bars (bars offset from the photometric centre; Kruk
                                                                                     et al. 2017).
                                                                                        In total we provide information for 36 293 clustered galaxy centres
                                                                                     (i.e. clustered points in or near the bundles) in the field of view of
                                                                                     objects in the MaNGA target file. These were all marked by N >
                                                                                     3 volunteers; 85 per cent of these clusters have N > 6 or typical
                                                                                     f > 40 per cent. Of these, 11 161 centres are in targets observed by
                                                                                     MaNGA (9841 with the higher threshold).
                                                                                        We find 3200 MaNGA galaxies with multiple galaxy centres (1819
                                                                                     after applying the f = 40 per cent threshold). Two examples of
                                                                                     MaNGA targets with eight clustered galaxy centres are shown in
                                                                                     Fig. 4.
                                                                                        In bundles with only a single galaxy centre identified, we find

                                                                                                                                                                   Downloaded from https://academic.oup.com/mnras/article/507/3/3923/6347355 by guest on 03 November 2021
                                                                                     good agreement between the position and the catalogued galaxy
                                                                                     position, with offsets having a mean value of 0.34 ± 0.16 arcsec,
                                                                                     which is well within a single MaNGA spatial resolution element
                                                                                     (2.5 arcsec after the cube is reconstructed; Law et al. 2016). Some
Figure 3. An example of the masks drawn on a galaxy in GZ:3D. This shows             bundles were deliberately offset during initial test observations, or as
all kinds of masks with colour indicating the type (green for galaxy centre,
                                                                                     part of an ancillary program to cover merging galaxies in MaNGA.
purple for star, orange for bar, and blue for spirals), and the density indicating
                                                                                     The largest offset we find in this sample with single centres IDs
the number of volunteers who created the mask in that pixel. Their are two
foreground stars identified in this example; one is outside of the MaNGA             (with an f = 40 per cent threshold) is 3.4 arcsec, which reveals an
bundle. This galaxy is MaNGA-ID 1-604761.                                            object (MaNGA-ID 1-38770) with a significant tidal tail. Some of
                                                                                     the deliberate offsets were larger than this.
points within five pixels (or 0.5 arcsec) of each other. The mean and
covariance of these points within a cluster was then used to create
both a centre and confidence region (a 2σ region mask). The point                    3.2 Foreground stars
count is provided and can be used a a measure of confidence in the                   Foreground stars are present in a small fraction of MaNGA bundles
cluster.                                                                             and (if unflagged) cause problems for the MaNGA DAP. To solve this
   For the bar and spiral arm drawing tasks, ‘count masks’ were                      problem, foreground star masks are included in the Data Reduction
created for each pixel in the image. The bar/spiral count masks                      Pipeline (DRP; Law et al. 2015) output that forms the input to the
record the number of volunteers who included a given pixel inside                    DAP. The foreground star masks used in both DR13 (Albareti et al.
of their bar or spiral arm drawing, respectively. One complication                   2017) and DR14 (Abolfathi et al. 2018) MaNGA data were created
with this technique, for the free-hand spiral arm drawing task, is that              by MaNGA team members visually inspecting all galaxies observed
volunteers could draw shapes that were self-intersecting polygons                    in the first 2 yr of MaNGA operations.10 However in DR15 (Aguado
(e.g. a five-pointed star drawn with a single line). Some of these                   et al. 2019) and later releases, these star masks were supplemented
shapes do not have a well-defined ‘inside’ so were removed from                      by the masks created via GZ:3D.
the aggregation; this, as well as volunteers not completing a task                      The MaNGA team foreground star identification listed 277 stars
can result in a small number of galaxies with fewer than N = 15                      identified in 260 individual MaNGA galaxies in the DR14 (or
classifications for the spiral mask.                                                 MPL-5; Abolfathi et al. 2018) subset. This provided a comparison
   An example aggregation mask that includes a bar, spiral, fore-                    set for GZ:3D foreground star identifications from the first phase.
ground star (in this example outside the bundle), and galaxy centre is               Considering foreground stars identified by five or more volunteers
illustrated in Fig. 3. The code used to perform the aggregation, and                 only, GZ:3D identified 47 per cent of the foreground stars in the team
to make this plot for any galaxy in the GZ:3D sample has been made                   list and 23 per cent of the GZ:3D identified stars were found in the
available.9 The colour bar indicates which colour corresponds to                     MaNGA team list (within 5 arcsecs). We expect that GZ:3D would
which feature, with the density of the colour indicating the volunteer               find stars missed by the team, since individual human classification
count (i.e. the most opaque colours are reserved for spaxels or points               suffers from a level of human error which crowdsourcing solves. The
marked by all volunteers). This gives a sense of how a scientist                     majority of the foreground stars in the team list which were not in
using GZ:3D masks must decide on a count threshold (in number,                       GZ:3D (at the N > 5 count threshold) were outside or around the
N, or fraction, f of answers) which will define a specific region (see               outskirts of the hexagonal bundle. We suggest these missing stars
Section 4.1 below).                                                                  were primarily caused by the instructions in the first phase: to mark
                                                                                     stars only within the hexagon, combined with a displayed hexagon
3 R E S U LT S                                                                       which was slightly too small as explained previously. This formed
                                                                                     part of the motivation to classify all MaNGA target galaxies again in
3.1 Galaxy centres                                                                   Phase 2 (see Section 2.3), and to modify the instructions to request
                                                                                     stars both inside and outside the bundle to be marked. This adjustment
The marking of galaxy centres by GZ:3D volunteers can be used to                     improved significantly the fraction of team identified stars found in
identify MaNGA galaxies with a significant offset from the centre of                 GZ:3D, with 80 per cent identified (at N > 5).
their bundle and also MaNGA bundles that include multiple galaxies
(for an example see Fig. 4). One interesting application could be
                                                                                     10 Foreground   star visual inspection was mostly done by Karen Masters and
9 https://github.com/CKrawczyk/GZ3D       production                                 Lin Lin.

                                                                                                                            MNRAS 507, 3923–3935 (2021)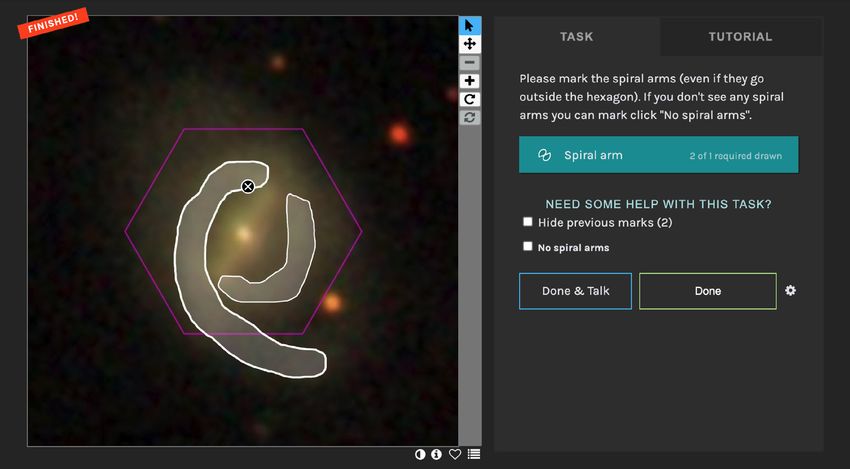
3928         K. L. Masters et al.

                                                                                                                                                           Downloaded from https://academic.oup.com/mnras/article/507/3/3923/6347355 by guest on 03 November 2021
Figure 4. Examples of MaNGA targets in which GZ:3D volunteers marked large numbers of galaxy centres (in these examples five and six GZ:3D identified
galaxy centre clusters within/close to the bundle). The upper row shows MaNGA-ID 1-199224, while the lower row shows MaNGA-ID 1-295355. Column (a)
is the optical image with the hexagon overlaid; (b) are the GZ:3D masks, showing multiple galaxy centres (and in MaNGA-ID 1-295355 two stars; one inside
the bundle). Column (c) shows the stellar velocity with spaxels tagged as galaxy centres overlaid.

   For MaNGA galaxies which have been observed, it is possible                3.3 Bar regions
to extract spectra at the position of a marked ‘foreground star’ in
                                                                              Galactic scale bars are present in a large fraction of disc galaxies
order to check if it is actually a star, or is some other kind of points
                                                                              (from 30 to 60 per cent depending on the wavelength of observa-
source (e.g. a compact H II region or background quasar). We did
                                                                              tion, and the technique used to identify these linear features, e.g.
this for all marked stars (regardless of the number of volunteers
                                                                              Marinova & Jogee 2007; Sheth et al. 2008; Masters et al. 2011).
who marked them) in the MaNGA DR15 sample (internally known
                                                                              Since the strong correlation between optical colour (as an indicator
as MPL-7) which was available internally in 2018 June/July.11 We
                                                                              of quenching) and bar fractions was first noted (Masters et al. 2011)
made use of MARVIN(Cherinka et al. 2019) to extract averaged spectra
                                                                              there has been significant interest in the role bars may play in the
from a circle with radius 2.5 arcsec (the typical MaNGA point
                                                                              quenching of star formation in disc galaxies (e.g. Masters et al. 2012;
spread function) at the clustered location of point sources marked
                                                                              Gavazzi et al. 2015; Khoperskov et al. 2018; Kruk et al. 2018; George
as foreground stars. This resulted in a return of 2037 spectra, an
                                                                              et al. 2019; Maeda et al. 2020). Even before this, the role of bars in
example is shown in Fig. 5. This exercise revealed that all point
                                                                              radial mixing (and corresponding impact on radial gradients) had
sources identified by N ≥ 10 volunteers are stars (a private Zooniverse
                                                                              been much debated (see Zurita et al. 2021a, b for a discussion of the
project was used to ease the process of classifying the spectra from
                                                                              history of this topic). Bars, particularly strong bars which extend over
marked locations), while at lower volunteer thresholds some H II
                                                                              a significant fraction of the galaxy disc, have a strong directionality
regions and other compact bright regions (sometimes background
                                                                              (that’s what makes them a bar!), so azimuthal averaging in galaxies
or foreground galaxies) were identified (with N ≥ 6 we found
                                                                              with strong bars is highly likely to oversimplify and obscure radial
80 per cent of objects were stars, and for N ≥ 3, 50–60 per cent
                                                                              gradients (Sánchez-Blázquez et al. 2014). The interpretation of radial
were stars). In order to be conservative and not exclude spaxels
                                                                              gradients in galaxies is already complex, revealing as it does the
of interest from the DAP analysis, we therefore make use of a
                                                                              intricate interplay between star formation rates, intergalactic gas
threshold of N ≥ 10 to identify foreground stars that are flagged
                                                                              inflow, and radial migration driven by various internal processes.
in the DAP (Westfall et al. 2019). In the entire MaNGA target list
                                                                              Hence, the identification of bar regions to help disentangle the impact
this identified 3658 foreground stars, though many of these will
                                                                              of bars on azimuthally averaged gradients from MaNGA data was
be in target galaxies never observed by MaNGA. Of the 11 273
                                                                              one of the primary motivations for the GZ:3D project. An example
data cubes in MPL-11 (the final internal release which will become
                                                                              bar mask from the project is shown in Fig. 6 which shows the optical
the DR17 sample, of which 10 010 are unique MaNGA-IDs with
                                                                              image, mask from the volunteers, and details of the H α flux and
high quality data), 1085 (9.6 per cent) had foreground star flags
                                                                              stellar velocity from MaNGA with GZ:3D identified bar overlaid.
marked.
                                                                                 The bar masks from GZ23D have already been used in a number
                                                                              of studies with MaNGA data. The first published result was Fraser-
                                                                              McKelvie et al. (2019), who used bar masks to investigate gradients in
11 KNAC   funded REU project of Daniel Finnegan                               stellar populations both along and outside bars at the same galactic

MNRAS 507, 3923–3935 (2021)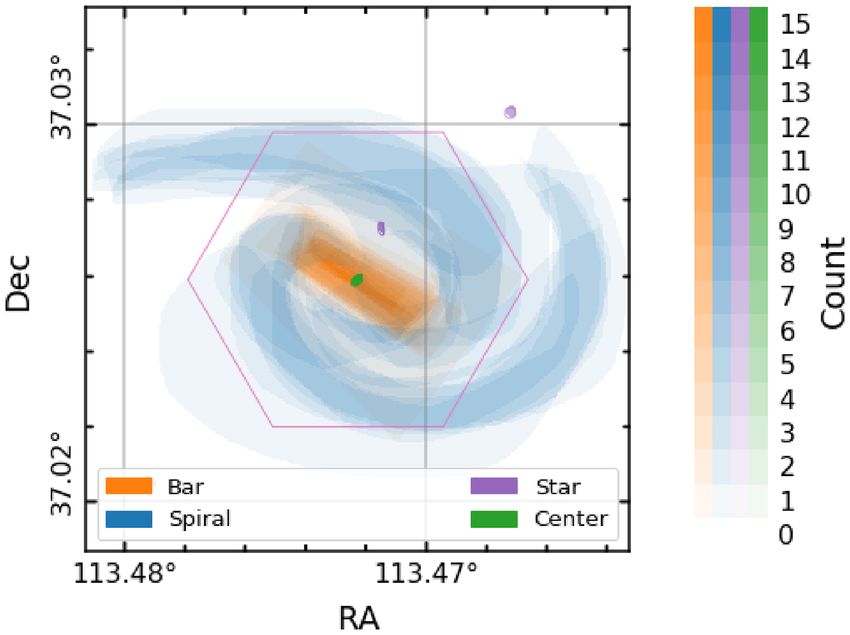
Galaxy Zoo: 3D                3929

                                                                                                                                                                 Downloaded from https://academic.oup.com/mnras/article/507/3/3923/6347355 by guest on 03 November 2021
Figure 5. An example of a MaNGA galaxy (MANGA-ID 1-247456) with two foreground stars identified by GZ:3D. Shown are (a) the optical gri image; (b)
the GZ:3D classification mask; (c) the spectrum of the most central star which was identified by 13/15 GZ:3D volunteers and shows a spectrum characteristic of
a K-type dwarf star (having a strong Mg line at 5200 Å and Na line at 5800 Å) which, based on Gaia parallax, is just 1.1 kpc from the Sun; (d) a H α emission
map from Marvin; and (e) a stellar velocity map from Marvin both with the central foreground stars masked.

radii, finding that there are indeed clear differences – there were               is also a published test of bar lengths measured using GZ:3D masks
flatter age gradients in bars than in the inter-bar disc regions at the           compared with those measured using the Fourier decomposition
same radius. Fraser-McKelvie et al. (2020) went on to use MaNGA                   method described in Kraljic, Bournaud & Martig (2012). This result
to reveal how H α morphology correlates with bars. They found that                demonstrates that as the GZ:3D vote threshold is increased, GZ:3D
in the small fraction (18 per cent) of bars in their sample with strong           bars get shorter such that the agreement between the two measures of
H α in the bar, the ionization source [using the Baldwin, Phillips &              bar length improves, but at the cost of a smaller fraction of galaxies
Terlevich (1981), or BPT method to identify the likely source of                  with bars that have usable GZ:3D bar masks. In a nice demonstration
ionization] was star formation. This work also demonstrated how the               of the kind of considerations users of GZ:3D output need to make,
angle of the H α bar leads that in the white-light image (dominated               Krishnarao et al. (2020) concluded that a vote threshold of 20 per cent
by older stellar populations) by up to 20◦ in most galaxies; a visual             was optimal for their application (see Section 4.1 below for further
confirmation that star formation is occurring primarily at the leading            discussion of GZ:3D vote threshold choices).
edge of the bar, in line with theoretical predictions (e.g. Renaud et al.            Krishnarao et al. (2021) have gone on to use GZ:3D bar masks to
2015). Measurements of this offset would provide a way to measure                 identify dark gaps in stellar surface density (and g-band imaging)
the pattern speed of bars [e.g. as was done by Peterken et al. (2019a)            that they link to orbital resonances generated by the bar. This
for a spiral arm].                                                                measurement, which they calibrate with similar measurements in
   Peterken et al. (2019b) used both bar and spiral masks from GZ:3D              an N-body simulation, allows them to identify the co-rotation radius
for the galaxy MCG + 07-28-064 to demonstrate a new technique                     of the bars, and estimate pattern speeds. This work does additional
of reconstructing spatially resolved star formation histories from                testing of GZ:3D bar lengths, comparing them to Guo et al. (2019)
MaNGA data cubes. The bar (and spiral arm) masks were used as                     and finding good agreement at the 40 per cent threshold level.
a visual indication of where these features are relative to features in
stellar population metallicity as a function of age.
   Krishnarao et al. (2020) have used GZ:3D bar masks in a sample
of Milky Way analogues with bars to identify the source of ionization             3.4 Spiral arms
in the bar itself and in the inter-bar region at the same radius. They            Spiral arms are a common feature in disc galaxies. They range from
discovered LI(N)ER-like emission is more common in the inner                      the highly dominant usually two-armed ‘grand design’ spirals to the
region (inside the bar radius) in barred galaxies than it is in the outer         more flocculent (irregular and patchy) types, which tend to have large
region [a finding also reported by Percival & James (2020) in a much              numbers of arms that are hard to separate [see Hart et al. (2016) for a
smaller sample], and that there is often a ring of star formation at              summary of the demographics of spiral arms as observed in Galaxy
the end of the bar. In Appendix A of Krishnarao et al. (2020), there              Zoo].

                                                                                                                        MNRAS 507, 3923–3935 (2021)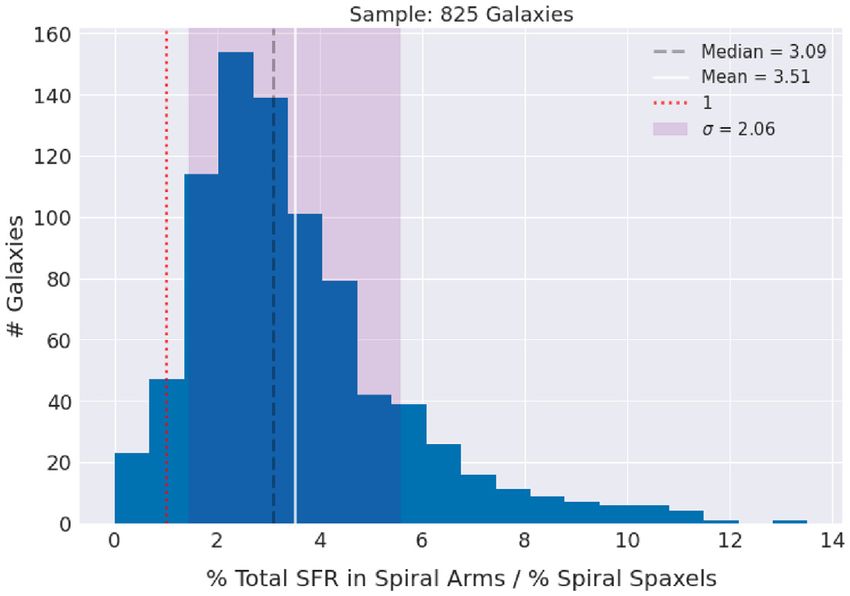
3930 K. L. Masters et al.
Downloaded from https://academic.oup.com/mnras/article/507/3/3923/6347355 by guest on 03 November 2021
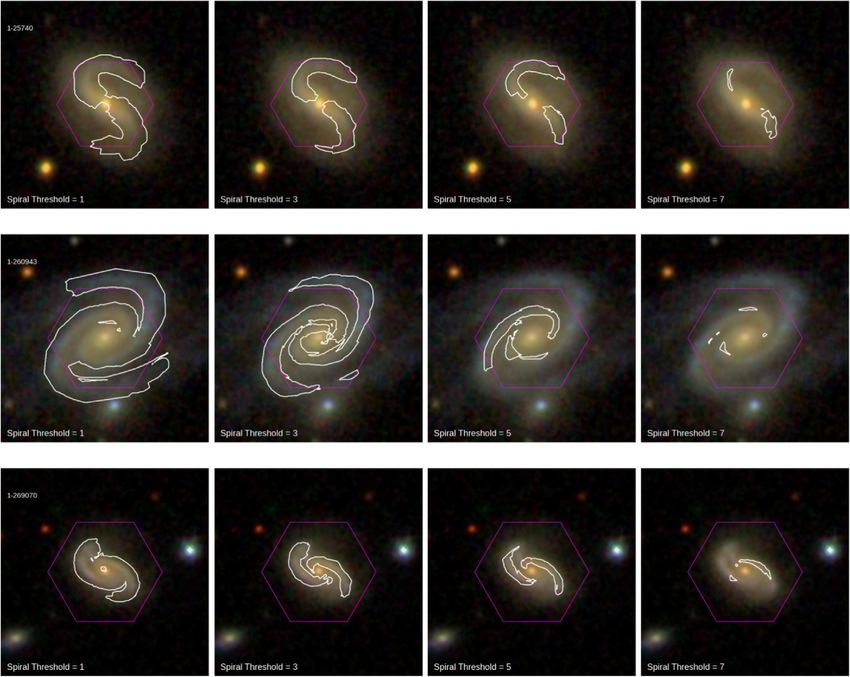
Figure 6. An example of a MaNGA galaxy (MaNGA-ID 1-248420) with a GZ:3D bar mask and spiral mask. Panel (a) shows the image shown to Galaxy Zoo:
3D volunteers while the pixel masks output are shown in panel (b). Panel (c) shows a scatter plot of the H α flux in each spaxel, as a function of azimuthal angle.
Points are colour coded by the GZ:3D identification (e.g. orange for spaxels in the bar, blue for spiral arm spaxels). This shows how the peak in H α emission
varies significantly with angle. The bar and spiral masks are used to create the overlays on the MaNGA H α emission map shown in panel (d), and stellar velocity
map in panel (e). The bar contour is at the 7/15, or 47 per cent threshold level, while the spiral is at the 3.5/15, or 23 per cent threshold.
For the GZ:3D project, we invited volunteers to draw spiral arms 3.5 Star formation in spirals
in MaNGA target galaxies where Galaxy Zoo 2 (Willett et al. 2013)
In this section we present a new result making use of spiral arm
volunteers had indicated they could see four or fewer spiral arms.
masks from GZ:3D to investigate the enhancement of star formation
During beta testing, volunteers indicated that the spiral drawing task
linked to spirals.
was hard to complete, particularly where there were large numbers of
Spiral arms have long been predicted to trigger star-formation via
very flocculent arms. Even with these many armed spirals removed,
shocks to the gas clouds (Roberts 1969); this might also be caused by
it was spiral arm drawing that took the longest to complete (see
an increased in gas density driven by spiral arms (Kim, Kim & Os-
Section 2.3).
triker 2020); in this recent simulation it was estimated that 90 per cent
An example spiral arm drawing and mask, and plots showing the
of star formation happens in spirals arms due to the increased gas
H α and stellar velocity maps from MaNGA with the outline of a
density. Here, we make use of the GZ:3D spiral masks to measure
spiral mask (with the threshold at 3.5/15 volunteers or 23 per cent)
the fraction of star formation found in the spiral arms in MaNGA
is shown in Fig. 6.
galaxies. We use data from the MaNGA MPL-10 internal release.12
The MaNGA team have already made some use of spiral arm
We construct a sample of 825 galaxies with spiral masks (with a
masks in published results. As noted above, Peterken et al. (2019b)
spiral threshold of 20 per cent or 3/15 volunteers marking a spaxel as
used the spiral mask to illustrate features in MCG + 07-28-064; in
within a spiral arm) in at least 1.5 per cent of the spaxels. We exclude
addition, Peterken et al. (2019a) used the spiral arm mask to indicate
spaxels marks as being within a bar, galaxy centre, or star by at least
where the spiral arms are in UGC 3825. In this galaxy, the MaNGA
3/15 volunteers from either the spiral arm, or inter-arm regions. Star
maps of H α and young stars were cross correlated, revealing the
formation estimates are based on the H α luminosity, corrected with
stellar population age gradient signature expected for a density wave
the Balmer decrement [using the formula given in Spindler et al.
spiral (with H α tracing star formation happening in the spiral, and
(2018)]. We sum the total SF inside the spiral mask and compare to
young stars ‘behind it’).
the area covered by the arms in a range of 0.1 < r/re < 1.5, where
In a paper about the dust content of galaxies as revealed by gas and
re is the effective radius of each galaxy. The majority of MaNGA
stellar tracers, Greener et al. (2020) used spiral masks to investigate
galaxies are covered by the bundle to at least 1.5re . The resulting
arm–inter-arm differences in dust content. No differences were seen,
which is surprising, as generally dust lanes are associated with
spirals. This led to speculation that the 2.5 arcsec spatial resolution
12 MPL-10 was an internal data release within MaNGA which containing data
of MaNGA data was blurring out the signal, or potentially that dust
lanes are excluded from drawn arms in GZ:3D. cubes for 9269 unique galaxies – see table 1 of Law et al. (2021)
MNRAS 507, 3923–3935 (2021)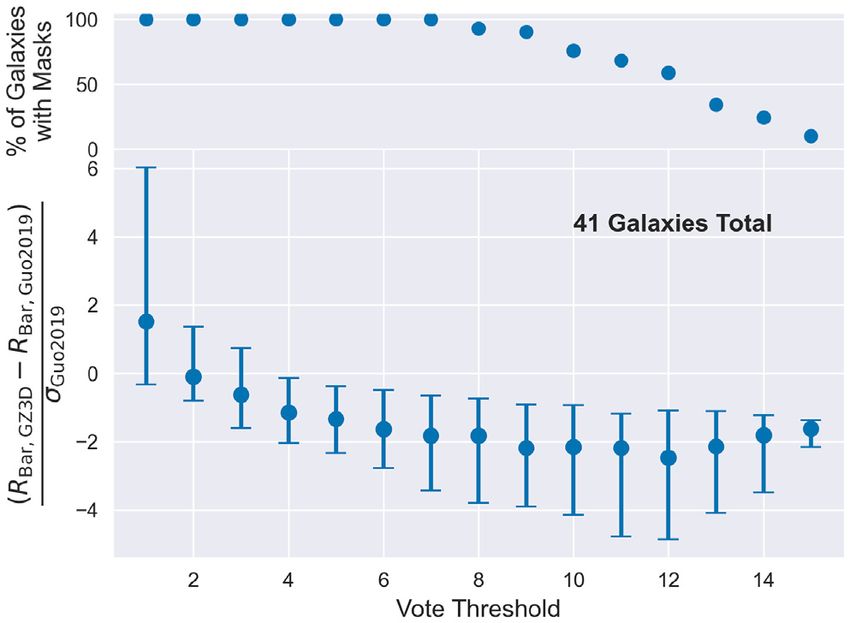
Galaxy Zoo: 3D               3931
                                                                                   4 H OW T O U S E G Z : 3 D M A S K S
                                                                                   All GZ:3D results, which cover all MaNGA target galaxies, are
                                                                                   published as a Value Added Catalog (VAC) in the Seventeenth
                                                                                   Release of the SDSS (DR17; SDSS Collaboration in preparation).13
                                                                                      Each galaxy that has been processed in GZ:3D has one .fits
                                                                                   file containing the following information:
                                                                                      (i) HDU 0: [image] SDSS cutout image presented to the
                                                                                   volunteer. The pixel scale in these images, and all pixel masks is
                                                                                   0.099 arcsec per pixel (see Section 2.2).
                                                                                      (ii) HDU 1: [image] Pixel mask of clustering results for
                                                                                   galaxy centres. Each identified centre is represented by a 2σ ellipse
                                                                                   of the clustered points with the value of the pixels inside the ellipse

                                                                                                                                                               Downloaded from https://academic.oup.com/mnras/article/507/3/3923/6347355 by guest on 03 November 2021
                                                                                   equal to the number of points used belonging to that cluster.
                                                                                      (iii) HDU 2: [image] Pixel mask of clustering results for stars.
                                                                                   Each identified star is represented by a 2σ ellipse of the clustered
Figure 7. The fraction of star formation found within the spiral masks,            points with the value of the pixels inside the ellipse equal to the
normalized by the fraction of the area those masks cover in a sample of 825        number of points used belonging to that cluster.
MaNGA galaxies with MPL-10 data and GZ:3D spiral masks. If there were
                                                                                      (iv) HDU 3: [image] Pixel mask of spiral arm locations. The
no enhancement of SF in the arms we would expect this to peak at 1.0 (the
                                                                                   values for this mask are the number of polygons describing the spiral
red dotted line); this measurement shows a peak at a median of 3.1, with σ =
2.1, showing that SF is enhanced in spiral arms.                                   drawings overlapping each pixel.
                                                                                      (v) HDU 4: [image] Pixel mask of bar location. The values
                                                                                   for this mask are the number of polygons describing the bar drawing
                                                                                   overlapping each pixel.
                                                                                      (vi) HDU 5: [table] Image metadata.
                                                                                      (vii) HDU 6: [table] Centre cluster data table in both pixel
                                                                                   coordinates and RA-DEC. The covariance values used to make the
                                                                                   2σ masks are also included.
                                                                                      (viii) HDU 7: [table] Star cluster data table in both pixel
                                                                                   coordinates and RA-DEC. The covariance values used to make the
                                                                                   2σ masks are also included.
                                                                                      (ix) HDU 8: [table] Raw centre and star classifications pro-
                                                                                   vided in pixel coordinates.
                                                                                      (x) HDU 9: [table] Raw spiral arm classifications provided
                                                                                   in pixel coordinates (i.e. the shape of each polygon drawn).
                                                                                      (xi) HDU 10: [table] Raw bar classifications provided in
                                                                                   pixel coordinates (i.e. the shape of each polygon drawn).
                                                                                      In addition to this, we provide example code to use these files
Figure 8. The average radial profile (radius scaled to be in unit of               with MaNGA data cubes.14 This code assumes the user has Marvin
galaxy effective radius, re ) of the star formation excess ((SFRspiral −           (Cherinka et al. 2019) installed and leverages functionality in Marvin
SFRnon-spiral )/SFRnon-spiral ) found using the GZ:3D spiral masks with a sample   to make working with the MaNGA data cubes or maps and GZ:3D
of 825 MaNGA galaxies with MPL-10 data. This figure shows how at larger            straightforward. It is intended that future releases of Marvin will
radius, the SFR is particularly enhanced in spiral arms. The errors show the       include versions of this code.
1σ scatter at each radial bin.
                                                                                      A summary file with galaxy metadata (including the GZ2 vote
                                                                                   counts used to identify galaxies with likely bars and spiral arms)
                                                                                   is also provided, as well as summary files for the galaxy centre
distribution is presented in Fig. 7, which shows a peak at a median
                                                                                   identifications, and foreground star identifications.
of 3.1 (standard deviation ±2.1), demonstrating that in this sample,
spiral arm spaxels host around three times as much star formation as
the average spaxel at the same radius. We alternatively describe this as           4.1 Mask levels
a star formation enhancement (SFRspiral − SFRnon-spiral )/SFRnon-spiral ,
                                                                                   When using crowdsourced masks (or morphologies) a scientist may
finding an average enhancement of 62 per cent (median 54 per cent,
                                                                                   choose to use the votes fractions directly as a weighting, but they
and standard deviation 70 per cent).
                                                                                   may also wish to make a choice of threshold in order to create a
   Using the spiral masks, we are also able to construct radial
                                                                                   binary mask (i.e. identifying arms and inter-arm regions, or a region
gradients of star formation enhancements linked to spiral arms (see
                                                                                   that is associated with the galactic bar). We provide in this section
Fig. 8). This reveals that at larger radii, star formation is more strongly
                                                                                   some advice, and examples of threshold choices. We also point the
enhanced in the spiral arms (from effectively no enhancement at r
                                                                                   reader to section 4.3 of Willett et al. (2013) that provides a discussion
< 0.2re to roughly 100 per cent more SF in the arms at around 1re ).
                                                                                   of similar choices when using Galaxy Zoo morphologies.
Further analysis of these results in future work will help measure the
total contribution of spiral arm-enhanced star formation in a large
sample of galaxies, and compare the enhancement to gas density                     13 https://www.sdss.org/dr17/data   access/value-added-catalogues/
enhancements to measure the SF efficiencies.                                       14 https://github.com/CKrawczyk/GZ:3D      production

                                                                                                                           MNRAS 507, 3923–3935 (2021)
3932 K. L. Masters et al.
Downloaded from https://academic.oup.com/mnras/article/507/3/3923/6347355 by guest on 03 November 2021
Figure 9. Three galaxy images (top to bottom: MaNGA ID: 1-25740, MaNGA ID: 1-260943, and MaNGA ID: 1-269070) displayed with their GZ:3D spiral
arm masks overlaid. The masks are shown at different spiral thresholds, from left to right: N = 1, 3, 5, and 7 users mark each enclosed spaxel as part of a spiral.
We conclude from this that a threshold of N = 3 is optimal to identify continuous, but distinct spiral arms.
The basic trade-off is that the higher the vote threshold, the more bounding box to masks at different thresholds, with bar lengths
confident the user can be in the identification of a spaxel with a measured using a Fourier technique by Guo et al. (2019). In total
specific structure, but as a result fewer spaxels will be included in a there are 41 galaxies with both measures. This plot, which is similar
structure, and so the patchier that structure will be. As an example of to the analysis also presented in Appendix A of Krishnarao et al.
this we show in Fig. 9 spiral masks as a range of thresholds for some (2020), demonstrates how as the mask threshold increases, GZ:3D
example galaxies. This trade-off is particularly challenging for the bar lengths decrease; however, so does the number of galaxies with
spiral arm masks, but is present in all output from GZ:3D (and indeed usable bar masks. We find that the bar length settles at a value about
in any crowdsourced data, where there is always the risk of spurious 2σ lower than the Guo measurements once N > 6 (or 40 per cent);
classifications from volunteers who mis-click or misunderstand the for bar lengths that agree with Guo within 1σ a lower threshold of
task). N = 3 (20 per cent) is recommended.
An alternative strategy is to perform your analysis once per
volunteer mask (typically 15 times) with each galaxy in your sample,
and then average the results afterwards. 4.2 Error on binned quantities
In Table 2 we provide a summary of threshold choices made in all As discussed extensively in Westfall et al. (2019) and Law et al.
previous work (including this paper) that have used GZ:3D masks (2016), the spatial binning scheme for MaNGA results in significant
or clusters. We also comment on reasons for specific choices of covariance between the values of adjacent 0.5 arcsec spaxels, since
the threshold. Note that number thresholds are not always identical the spatial resolution of MaNGA is close to 2.5 arcsec, or 5 spaxels
to fraction thresholds as (see Section 2) while most masks are wide [also see Liu, Blanton & Law (2020) for a discussion of
aggregated from 15 entries, there is some scatter in that total number. regridding to account better for covariance]. When making use of data
Making similar choices may aid in comparison with earlier work; in bins provided by the DAP, this issue is corrected for; however, for
however, there is no single right answer to this choice; we recommend users binning in GZ:3D’s bins, set by the masks that identify certain
users inspect how their results change with differing thresholds, and features, more attention must be paid, as the errors provided per
indicate clearly the choice that is made. spaxel cannot be assumed to be independent and simply summed in
As an example of this process, we present in Fig. 10 a comparison quadrature. Instead the covariance needs to be accounted for, so that
of the lengths of GZ:3D bars, indicated by fitting a minimum the relative error on a value constructed from the sum of n spaxels
MNRAS 507, 3923–3935 (2021)Galaxy Zoo: 3D 3933
Table 2. Example thresholds (fraction of volunteers to identified a spaxel with a specific feature) used to create GZ:3D masks.
Task Threshold Comment Reference
Galaxy centres N > 6 (40 per cent) 85 per cent of all galaxy centres meet this Section 3.1
Foreground stars N > 10 (67 per cent) Conservative limit; all locations have stellar-like spectra. Section 3.2
Threshold used to flag stars in the DRP/DAP Westfall et al. (2019)
Bars 20 per cent Threshold in plot example. Fraser-McKelvie et al. (2019)
Bars 80 per cent To be confident of bar ID. Fraser-McKelvie et al. (2019)
80 per cent To be highly confident spaxel identified is in the bar. Fraser-McKelvie et al. (2020)
20 per cent Study tested bar length with different thresholds. This choice is compromise Krishnarao et al. (2020)
between accuracy and completeness.
40 per cent Informed by Krishnarao et al. (2020) for best length measurement. D. Krishnarao et al. in prep.
Spirals N > 3 (20 per cent) Creates continuous and distinct spirals Section 3.5
Downloaded from https://academic.oup.com/mnras/article/507/3/3923/6347355 by guest on 03 November 2021
25 per cent To indicate representative region of arms Peterken et al. (2019a)
40 To indicate inter-arm and arm regions Peterken et al. (2019b)
per cent
50 per cent Choice is compromise between accuracy and completeness Greener et al. (2020)
(Westfall et al. 2019);15 we reiterate this subtlety here to ensure users
of GZ:3D binning schemes are aware of the need to account for it.
5 S U M M A RY A N D C O N C L U S I O N S
In this paper, we have presented the Galaxy Zoo: 3D (GZ:3D)
project that has crowdsourced the identification of galaxy centres
and foreground stars, as well as the creation of spaxel masks that
indicate the location of bars and spiral arm structures in MaNGA
target galaxies.
We describe the building of the citizen science project on the
Zooniverse platform, the SDSS gri images of galaxies that were
used, and how volunteer input was converted into clustered galaxy
centre and foreground star points (with error regions), as well as pixel
count masks for the location of bars and spirals.
Figure 10. Lower panel: A comparison of the bar lengths measured when We demonstrate how the galaxy centre markings can be used to
different GZ:3D vote thresholds are used for a sample of 41 galaxies with bar find interesting MaNGA targets, demonstrating this with two bundles
lengths also measured by Guo et al. (2019) using a Fourier technique. The found with large numbers of galaxies.
errors are 1σ . As the mask threshold increases, GZ:3D bar lengths decrease,
The identification of foreground stars by GZ:3D has been used as
settling at about 2σ smaller than the Guo measurements once N > 6 (or
40 per cent). Upper panel: The per cent of all bar masks that have a mask with
an input to the MaNGA Data Analysis Pipeline to flag locations of
this threshold. likely foreground stars. For this application, a conservative cut was
made, with only stars identified by at least N = 10 volunteers being
flagged. This was a deliberate choice to avoid accidentally flagging
point-like components of target galaxies (e.g. H II regions).
is We provide a summary of published MaNGA results that have
used the bar and/or spiral arm masks (Fraser-McKelvie et al. 2019,
2
σtot = σi2 + ρij σi σj , (1)
i i (j =i)
2020; Peterken et al. 2019a, b; Greener et al. 2020; Krishnarao et al.
2020; Krishnarao et al. 2021), as well as a guide to aid the reader
where σ i, j are the relative error in a single spaxel, and ρ ij is the spatial in considerations needed when making use of GZ:3D crowdsourced
covariance between two spaxels. Users should note that GZ:3D spaxel masks. As an illustration, we make use of the spiral masks to
masks are provided with 0.099 pixel resolution, and must be re- measure that, on average, star formation is enhanced by a factor of
gridded to match the MaNGA 0.5 spaxels, or any other binning size. 3 in spiral arms relative to inter-arm regions, as well as revealing
In principle, the level of spatial covariance between spaxels how this fraction depends on radius in a sample of 825 spiral
depends on wavelength, but Westfall et al. (2019) find that the galaxies.
dependence on wavelength is rather weak, and provide an analytic fit The GZ:3D technique was developed to leverage human pattern
for covariance as a function of the distance in spaxels between two recognition, and provide a guide to the location of complex in-
locations Dij of ternal structures in MaNGA data. GZ:3D makes it very easy to
2 extract spectra from specific regions in the MaNGA data cubes
Dij
− 12 and maps; however, it does not take account of contamination
ρij = exp
1.92
, (2) from other components (i.e. the spectra from any given spaxel
will in reality include light from multiple components). While
i.e. a Gaussian of width 1.92 spaxels. For practical implementation it
is found that setting this to ρ ij = 0 for Dij > 6.4 spaxels is reasonable.
Code to implement these corrections is provided in the MaNGA DAP 15 https://sdss-mangadap.readthedocs.io/en/latest/spatialcovariance.html
MNRAS 507, 3923–3935 (2021)3934 K. L. Masters et al.
spectroscopic structural decomposition (e.g. Tabor et al. 2019) is DATA AVA I L A B I L I T Y
excellent for this, we do not have the ability to apply it to any
All final GZ:3D results, which cover all MaNGA target galaxies, will
structures other than bulges and discs, and spirals are challenging to
be published as a Value Added Catalog (VAC) in the Seventeenth
fit even in more simple photometric decompositions (as discussed
Release of the SDSS (DR17; SDSS Collaboration, in preparation),16
in Lingard et al. 2020, who test a crowdsourced solution to this
and made available to use via Marvin (Cherinka et al. 2019). For
problem).
more details on how to use these data, see Section 4 above. Any
Spiral arms are particularly challenging to identify. Automated or
scientists interested in results from the first phase of GZ:3D (which
machine learning methods to identify the locations of spiral arms are
we do not recommend be used for science) should contact the first
in the early stages of development (Bekki 2021) and struggle with
author.
anything other than N = 2 bi-symmetric smooth arms. The masks
provided here for a large sample of spiral galaxies may provide a
useful training set for such efforts. REFERENCES
While data exploration and visualization of multidimensional data,
Downloaded from https://academic.oup.com/mnras/article/507/3/3923/6347355 by guest on 03 November 2021
such as that provided in IFU surveys like MANGA, is complex, it Abolfathi B. et al., 2018, ApJS, 235, 42
Aguado D. S. et al., 2019, ApJS, 240, 23
is also a rich source to understand galaxies in our Universe. In this
Albareti F. D. et al., 2017, ApJS, 233, 25
article, we have demonstrated how the technique of crowdsourcing Baldwin J. A., Phillips M. M., Terlevich R., 1981, PASP, 93, 5
can be leveraged to help with the identification of regions of interest Bekki K., 2021, A&A, 647, A120
in astronomical images. Belfiore F. et al., 2017, MNRAS, 466, 2570
Belfiore F. et al., 2018, MNRAS, 477, 3014
Belfiore F. et al., 2019, AJ, 158, 160
Bershady M. A., Verheijen M. A. W., Swaters R. A., Andersen D. R., Westfall
AC K N OW L E D G E M E N T S K. B., Martinsson T., 2010, ApJ, 716, 198
This publication uses data generated via the Zooniverse.org platform, Blanton M. R. et al., 2017, AJ, 154, 28
development of which is funded by generous support, including a Bryant J. J. et al., 2015, MNRAS, 447, 2857
Bundy K. et al., 2015, ApJ, 798, 7
Global Impact Award from Google, and by a grant from the Alfred
Cappellari M. et al., 2011, MNRAS, 413, 813
P. Sloan Foundation. This publication has been made possible by Catalán-Torrecilla C. et al., 2017, ApJ, 848, 87
the participation of almost 6000 volunteers in the Galaxy Zoo: 3D Chen G., Zhang H.-X., Kong X., Lin Z., Liang Z., Chen X., Chen Z., Song
project on Zooniverse.org. Z., 2020, ApJ, 895, 146
Funding for the Sloan Digital Sky Survey IV has been provided by Chen Y.-M. et al., 2019, MNRAS, 489, 5709
the Alfred P. Sloan Foundation, the U.S. Department of Energy Office Cherinka B. et al., 2019, AJ, 158, 74
of Science, and the Participating Institutions. SDSS acknowledges de Zeeuw P. T. et al., 2002, MNRAS, 329, 513
support and resources from the centre for High-Performance Com- Drory N. et al., 2015, AJ, 149, 77
puting at the University of Utah. The SDSS web site is www.sdss.org. Ester M., Kriegel H.-P., Sander J., Xu X., 1996, AAAI Press, p. 226
SDSS is managed by the Astrophysical Research Consortium for Fraser-McKelvie A. et al., 2019, MNRAS, 488, L6
Fraser-McKelvie A. et al., 2020, MNRAS, 495, 4158
the Participating Institutions of the SDSS Collaboration including the
Gavazzi G. et al., 2015, A&A, 580, A116
Brazilian Participation Group, the Carnegie Institution for Science, George K., Joseph P., Mondal C., Subramanian S., Subramaniam A., Paul K.
Carnegie Mellon University, Centre for Astrophysics | Harvard & T., 2019, A&A, 621, L4
Smithsonian (CfA), the Chilean Participation Group, the French Géron T., Smethurst R. J., Lintott C., Kruk S., Masters K. L., Simmons B.,
Participation Group, Instituto de Astrofı́sica de Canarias, The Johns Stark D. V., 2021, MNRAS, in press
Hopkins University, Kavli Institute for the Physics and Mathematics Goddard D. et al., 2017, MNRAS, 466, 4731
of the Universe (IPMU)/University of Tokyo, the Korean Partic- Greener M. J. et al., 2020, MNRAS, 495, 2305
ipation Group, Lawrence Berkeley National Laboratory, Leibniz Gunn J. E. et al., 1998, AJ, 116, 3040
Institut für Astrophysik Potsdam (AIP), Max-Planck-Institut für As- Gunn J. E. et al., 2006, AJ, 131, 2332
tronomie (MPIA Heidelberg), Max-Planck-Institut für Astrophysik Guo R., Mao S., Athanassoula E., Li H., Ge J., Long R. J., Merrifield M.,
Masters K., 2019, MNRAS, 482, 1733
(MPA Garching), Max-Planck-Institut für Extraterrestrische Physik
Hart R. E. et al., 2016, MNRAS, 461, 3663
(MPE), National Astronomical Observatories of China, New Mexico Ibarra-Medel H. J. et al., 2016, MNRAS, 463, 2799
State University, New York University, University of Notre Dame, Khoperskov S., Haywood M., Di Matteo P., Lehnert M. D., Combes F., 2018,
Observatório Nacional/MCTI, The Ohio State University, Pennsyl- A&A, 609, A60
vania State University, Shanghai Astronomical Observatory, United Kim W.-T., Kim C.-G., Ostriker E. C., 2020, ApJ, 898, 35
Kingdom Participation Group, Universidad Nacional Autónoma de Kraljic K., Bournaud F., Martig M., 2012, ApJ, 757, 60
México, University of Arizona, University of Colorado Boulder, Krishnarao D. et al., 2020, ApJ, 898, 116
University of Oxford, University of Portsmouth, University of Utah, Krishnarao D. et al. 2021, ApJ, in press
University of Virginia, University of Washington, University of Kruk S. J. et al., 2017, MNRAS, 469, 3363
Wisconsin, Vanderbilt University, and Yale University. Kruk S. J. et al., 2018, MNRAS, 473, 4731
Law D. R. et al., 2015, AJ, 150, 19
We gratefully acknowledge the National Science Foundation’s
Law D. R. et al., 2016, AJ, 152, 83
support of the Keck Northeast Astronomy Consortium’s REU pro- Law D. R. et al., 2021, AJ, 161, 52
gram through grants AST-1005024 and AST-1950797, the KINSC Li C. et al., 2015, ApJ, 804, 125
(Koshland Integrated Natural Sciences Centre) at Haverford College Lingard T. K. et al., 2020, ApJ, 900, 178
for Summer Scholar funding, and the Ogden Trust, UK for support
for summer undergraduate internships.
The work presented in Section 3.5, and Figs 7, 8, and 9 was part 16 DR17 VACs are listed at https://www.sdss.org/dr17/data access/value-ad
of the Haverford College Senior Thesis of Shoaib Shamsi ’21. ded-catalogues/
MNRAS 507, 3923–3935 (2021)You can also read