Rotating Disk Galaxies without Dark Matter Based on Scientific Reasoning - MDPI
←
→
Page content transcription
If your browser does not render page correctly, please read the page content below
Review
Rotating Disk Galaxies without Dark Matter Based
on Scientific Reasoning
James Q. Feng
 Optomec, Inc, St. Paul, MN 55114, USA; james.q.feng@gmail.com

 Received: 11 November 2019; Accepted: 30 January 2020; Published: 1 February 2020

 Abstract: The most cited evidence for (non-baryonic) dark matter has been an apparent lack of
 visible mass to gravitationally support the observed orbital velocity of matter in rotating disk
 galaxies, yet measurement of the mass of celestial objects cannot be straightforward, requiring
 theories derived from the known physical laws along with some empirically established semi-
 quantitative relationship. The most reliable means for determining the mass distribution in rotating
 disk galaxies is to solve a force balance equation according to Newton’s laws from measured
 rotation curves, similar to calculating the Sun’s mass from the Earth’s orbital velocity. Another
 common method to estimate galactic mass distribution is to convert measured brightness from
 surface photometry based on empirically established mass-to-light ratio. For convenience, most
 astronomers commonly assumed a constant mass-to-light ratio for estimation of the so-called
 “luminous” or “visible” mass, which would not likely be accurate. The mass determined from a
 rotation curve typically exhibits an exponential-like decline with galactrocentric distance,
 qualitatively consistent with observed surface brightness but often with a larger disk radial scale
 length. This fact scientifically suggests variable mass-to-light ratio of baryonic matter in galaxies
 without the need for dark matter.

 Keywords: disk galaxies; galactic rotation; Newtonian dynamics; rotation curve; dark matter; mass-
 to-light ratio

1. Introduction
 Based on scientific observations, many galaxies (including the Milky Way) appear to have a
common visible shape of thin disk as shown in Figure 1. Known as a stellar system of an ensemble of
stars and other masses, a disk galaxy (such as the Milky Way) usually contains 105 to 1012 stars
distributed in a flattened, roughly axisymmetric structure, rotating around a common axis in nearly
circular orbits. Besides stars, the galactic “disk” is also known to contain an interstellar medium such
as gases (mostly atomic and molecular hydrogen) as well as relatively small solid “dust particles”.
The general behavior of stellar systems, including disk galaxies, has been believed to follow Newton’s
laws of motion and Newton’s law of universal gravitation [1].
 Since their discovery in the 17th century, Newton’s laws of motion have been used to successfully
determine the relationship between a body of mass and the forces acting upon it, and its motion in
response to those forces, for a great variety of situations and phenomena. When combined with his
law of gravitation, Newton [2] could show (in terms of mathematical expressions) that Kepler’s
mysterious laws are actually consequences of his laws of motion. To date, there is no direct evidence
suggesting a failure of Newtonian dynamics in describing motions of celestial objects in stellar
systems, although some relativistic effects may be present at the centers of galaxies [1]. According to
Newtonian dynamics, the mass of an object can be determined from its motion such as acceleration
in a gravitational field. If the mass distribution in a galaxy cannot be measured directly, it can be
derived from the measured rotation curve, expressed in terms of distribution of objects’ orbital
velocity as a function of galactocentric distance, which may require some mathematical efforts but
Galaxies 2020, 8, 9; doi:10.3390/galaxies8010009 www.mdpi.com/journal/galaxies
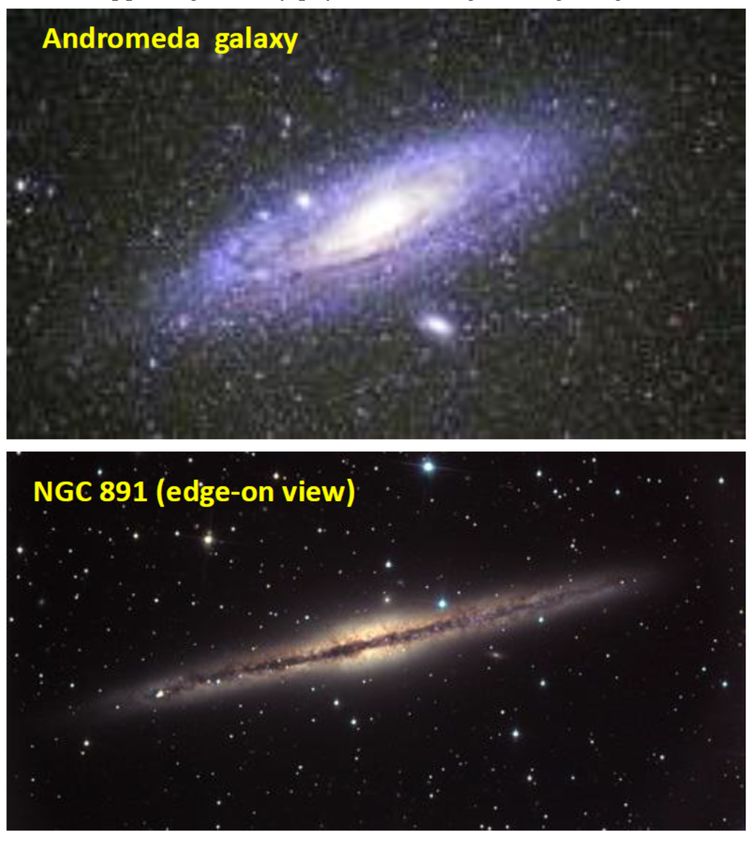
Galaxies 2020, 8, 9 2 of 14

should be a theoretically rather straightforward exercise. Such a derived mass distribution (from
rotation curve according to Newtonian dynamics) should be considered reasonable as long as the
value of mass does not appear against any physical laws, e.g., having a negative value or infinity, etc.

 Figure 1. Photographic images of circular thin-disk galaxies with small, amorphous, centrally located
 bulge.

 However, in recent decades we have been told that about 83% mass of our universe is made up
by some type of mysterious “dark matter”, which cannot be detected by electromagnetic radiation or
reaction, in contrast to any known substances of properties determined by available scientific
method. The reason for the belief of existence of the dark matter with its mysterious properties is due
to inference from its gravitational effects on “visible” matter, radiation, and large-scale structure of
the universe [3]. Numerous articles have been published to investigate the elusive dark matter, with
many books also written to describe such efforts [3–8], yet very few attempted to examine the validity
and certainty of the claimed evidence for existence of the so-called dark matter, based on scientific
reasoning with rigorous logic [9].
 To understand the natural world, scientists acquire knowledge using the scientific method
which involves observation, formulating hypotheses via induction, experimental testing with
quantitative measurements, and refinement or elimination of the hypotheses based on the
experimental findings. If well supported by experimental measurements, a particular hypothesis may
be further developed to a general theory. By scientific reasoning we should inquire whether or not
evidence is consistent with a claim or theory, or whether the evidence that render a claim could be
invalid. Therefore, the claimed existence of the (mysterious) dark matter should have been put under
rigorous scientific scrutiny, before making it sound like being well supported by observational
evidence. Actually, deficient reasoning for dark matter in galaxies has been pointed out by examining
the claimed evidence in the literature [9], though nonmainstream.
Galaxies 2020, 8, 9 3 of 14

 It is understandable that as human beings, scientists can be tempted to tell the mystery of dark
matter for being much more effective to attract press attention than simply describing the observed
astronomical phenomena in terms of the well-known Newtonian dynamics. When discussing the
subject of dark matter, few authors bother to question whether the reasoning for dark matter might
be invalid, whereas majority would rather present strange models assuming the presence of dark
matter. Nowadays, the dark matter is so firmly believed to be present that the finding of “a galaxy
lacking dark matter” can become quite a news-making story in the scientific community [10,11]. Yet
scientists are expected to have the genuine passion in truth seeking.
 In what follows, we first examine the nature of astronomical measurements, and technical
challenges as well as certainty or uncertainty associated with them. The methods for determining
mass of celestial objects are briefly reviewed next. Then, mass distribution in a rotating disk galaxy,
determined with the available measurements, is discussed with explanations based on scientific
reasoning without dark matter. Concluding remarks are provided in the final section.

2. Astronomical Measurements
 The behavior of celestial objects, such as stars and galaxies, cannot be described without
mentioning their mass, distance and velocity of movement. It turns out that the distance between
objects becomes the key for determining the mass and velocity of an object. Once the distance of an
object is measured, its variation within a given time interval determines the object’s velocity, and its
relative position with respect to other objects can be determined, but the measurements of
astronomical distance have been quite challenging with considerable uncertainties [9,12]. In fact, a
recent analysis has shown a significant difference between a previously indicated distance of 20 Mpc
and presently determined 13 Mpc [13] (1 pc = 3.26 light-years = 3.08 × 10¹⁶ m).
 Space is actually huge. Astronomical objects are typically scattered in a vast space, separated by
distances often measured in units of light-years (1 light-year = 9.46 × 10¹⁵ m, the distance for light to
travel in 1 year in vacuum). For example, the nearest star to our solar system is about 4.22 light-years
away. The distance between the Sun and Earth is ~1.5×10¹¹ m, taking about 8.3 minutes for light from
the Sun to reach us. Even our next-door neighbor, the Moon, is about 3.8 × 10⁸ m away, a lot farther
than most people would think. Only objects within our own solar system can our present spacecraft
reach. For the most part, the cosmos is out of our reach, except light that travels throughout the
universe can bring information about distant objects to us on the Earth.
 In astronomy, measurements are carried out almost exclusively by studying and analyzing the
“light”, or more generally the electromagnetic radiation, emitted or absorbed or reflected or scattered
or transmitted by remote objects such as stars, galaxies, and so forth [14,15]. The emission and
absorption line spectra can be used to determine the material composition, while the continuous
thermal radiation spectrum can tell us the temperature of a remote object. The speed of a celestial
object moving toward or away from us can be determined by the Doppler shift in the light spectral
lines, which actually became the basis for measuring the rotation curve of galaxies.
 For stars, their (surface) temperature, luminosity, and mass are among the most important
properties. A star’s surface temperature can be obtained fairly easily from its thermal radiation
spectrum or even simply its color, which is not influenced by its distance (theoretically). But
measurements of a star’s luminosity (the total amount of power it emits into space) from the apparent
brightness (the brightness of a star as it appear to our eyes, or to a detector like a CCD) relies on the
inverse square law for light which directly uses its distance from us. Thus, to determine the distance
of a star becomes the key to determine its luminosity.
 The most direct way to measure a star’s distance is by stellar parallax, which uses the angle due
to annual shift of its position relative to distant background stars, as Earth moves from one side of its
orbit to the other, to determine its distance. This is why the parsec or pc (corresponding to PARallax
of one arcSECond”)—a measure of tiny angles in the stellar sphere—becomes the preferred distance
unit for astronomers in professional literature. Parallaxes may provide us distances to stars up to a
few thousand light years away, i.e., in the solar neighborhood. But even the nearest galaxies and
galaxy clusters are millions of light-years away, too far for measurements by just using parallax. So,
Galaxies 2020, 8, 9 4 of 14

a system called the cosmic distance ladder has been created based on overlapping methods to
calculate successively farther distances [12].
 Larger distances rely on the so-called standard candle as well as a technique known as the main-
sequence fitting to estimate, based on assumptions over assumptions [12,14,15], yet no astronomical
object is a perfect standard candle; the challenge of finding the objects that can serve as the standard
candles leads to the challenge of measuring large astronomical distances. In short, uncertainties in
astronomical distances can be significant [9], as may not even be easily quantified due to multiple
steps of overlapping, each brings in its own uncertainties.
 The distance of an astronomical object seems to be difficult to determine, yet it plays the key role
in calculating the object’s mass from the known physical laws. In other words, masses of astronomical
objects cannot be determined without knowing the relative distances among them.

3. Mass Determined by Newtonian Dynamics—“Gravitational Mass”
 Once the relative distance and velocity of motion of objects are known from measurements, each
object’s mass may be determined from Newton’s laws. If we believe the forces among celestial objects
are of gravitational nature (according to Newton’s universal law of gravitation), the gravitational
field of an object (which is proportional to its mass) can be determined by measuring the acceleration
of a small nearby “test object”. Then the object’s mass can be determined from its gravitational field.
For example, the Sun’s mass can be determined using the Earth as a test object (which has a negligible
mass comparing to that of the Sun) by applying the formula of Newton’s version of Kepler’s third
law, with the measured average distance between the Earth and the Sun, a (≈ 1.5×10¹¹ m) and the
Earth’s orbital period, p ((≈ 3.15×10⁷ s, i.e., 1 year) [14,15]. In other words, having centripetal
acceleration of the Earth:

 = (1)

equal to the gravitational field of the Sun:

 (2)

where G (= 6.67 × 10⁻¹¹ m3 kg-1 s-2) is the gravitational constant and Msun the Sun’s mass, yields the
value of Msun ≈ 2.0×1030 kg (= 1 solar mass M⊙). Here V denotes the Earth’s (or the test object’s) orbital
velocity.
 By the same token, stellar masses in a binary star system—consisting of two gravitationally
bound stars orbiting around a common center of mass—can, in principle, also be determined with
known separation a or orbital velocity V and orbital period p based on the theory of Newtonian
dynamics for a two-body problem. It has been shown that the two-body problem can be treated as
an equivalent one-body problem in which the reduced mass m = m1 m2 / (m1 + m2) is orbiting about a
fixed mass M = m1 + m2 at a distance a = a1 + a2 where the subscripts “1” and “2” denotes the masses
and radii of the star “1” and star “2” [16]. In fact, the value of Msun determined from an equation of
(1) = (2) is actually reduced from the solution for two-body Kepler’s problem to an extreme case when
m1 >> m2 such that m → 0, a1 → 0, and M → m1 (= Msun or 1.0 M⊙). Thus, the value of M (= m1 + m2) in
a binary star systems can be determined. With the known M, the values of m1 and m2 can be
determined from the relationship of m2 / m1 = a1 / a2 = v1 / v2 (where v1 and v2 are the orbital velocities
of the two stars) derived from the two-body problem. In reality, the distances a1 and a2 are not easy
to determine accurately. Instead, the values of v1 and v2 can be measured much more reliably based
on the measured Doppler shifts, especially for the so-called “eclipsing binaries” with their orbit
planes lying very close in the line of sight [14,15].
 In a galaxy, a large number (105 – 1012) of stars, with an interstellar medium of gas and cosmic
dust, among others, are distributed in an extensive space such as a thin disk of radius about 10 kpc
(or 3.09×10²⁰ m). Simply adding the “point mass” fields of such a distributed stellar system with ~1011
stars is impractical to compute the gravitational field in a typical galaxy, so it becomes a common
practice, for most purposes, to model the gravitational field or potential “by smoothing the mass
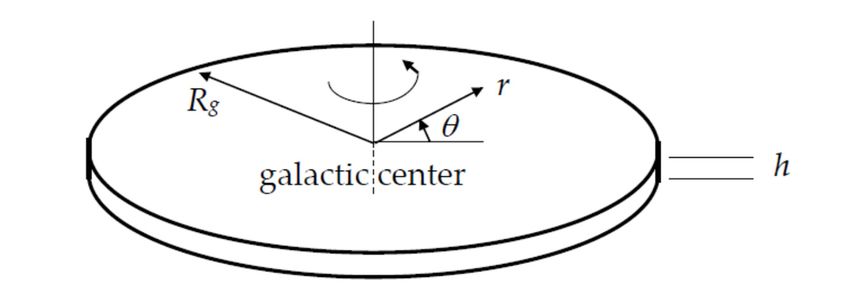
Galaxies 2020, 8, 9 5 of 14

density in stars on a scale that is small compared to the size of the galaxy, but large compared to the
mean distance between stars” [1], i.e., to treat the distributed mass system as a continuum, as a
reasonable approximation.
 Observations have shown that many astronomical systems, such as planetary systems, planetary
rings, accretion disks, spiral galaxies, etc., appear flat (cf. Figure 1) for a basic reason of the state with
lowest energy in a flat disk perpendicular to an axis along which a distribution of angular momentum
is given for a system of constant mass [1]. Therefore, it may not be unreasonable to approximately
consider a galaxy as an axisymmetric rotating thin disk, shown in Figure 2, consisting of distributed
self-gravitating mass (as a function of the galactocentric distance r) in balance with distributed
centrifugal force due to distributed circular orbital velocity (as a function of r). Over years, various
mathematical methods have been developed for deducing the mass distribution from the measured
rotation curve with the axisymmetric thin-disk model at mechanical equilibrium [1,17], each with its
own pros and cons. Here a numerical method by Gallo and Feng [18–21] is briefly described, without
loss of generality.

 Figure 2. Definition sketch of the rotating thin-disk galaxy model, where the mass is assumed to
 distribute axisymmetrically in the circular disk of uniform thickness h with a variable density ρ and
 rotation velocity V as functions of the radial distance from galactic center r (but independent of the
 polar angle θ).

 At any point in a rotating axisymmetric disk galaxy with negligible disk thickness effect, the
centripetal acceleration of (related to the centrifugal force on) a test object:

 (3)

is expected to be equal to the gravitational field from the distributed mass in the entire disk:
 ̂
 ̂ ̂ / ̂ ℎ ̂ ̂ (4)

where Rg denotes the galactic radius (or the galactocentric distance of the galaxy edge, taken as the
cut-off radius in rotation curve beyond which the detectable signal diminishes), Mg the total mass of
the galaxy, and V0 the characteristic rotation velocity as a representative value of the flat part of
rotation curve. All the variables in (3) and (4) are made dimensionless by measuring length r, h in
units of the galactic radius Rg , mass density ρ in units of Mg / Rg3 , and rotation velocity V in units of
V0 , with the disk thickness h assumed to be constant.
 It is noteworthy that equating (3) and (4) has the exactly same physical meaning as equating (1)
and (2), as the force balance equation for determining the rotation velocity from a known
gravitational field source—the amount of mass or mass distribution, or vice versa. For example, the
Sun’s mass can be determined from the known Earth’s orbital velocity as shown with equating (1)
and (2). Similarly, when the galactic rotation curve V(r) is available from measurements, the mass
distribution ρ(r) can be determined by solving the force balance equation from equating (3) and (4),
which will involve some mathematical manipulations.
 Among many different approaches to solution of the force balance equation (3) = (4), Gallo and
Feng [18–21] showed that with slight algebraic arrangements an equation can be obtained of the form:
Galaxies 2020, 8, 9 6 of 14

 ̂
 − ̂
 ̂ ℎ ̂ ̂ + =0 (5)

where K(m) and E(m) denote the complete elliptic integrals of the first kind and second kind, with:
 ̂
 ≡ ̂
 .

 The dimensionless parameter A in (5), called the galactic rotation parameter, is defined as:

 ≡ (6)

which can be determined by introducing a constraint equation for mass conservation,

 2 ̂ ℎ ̂ ̂ = 1 (7)

 Equations (5) and (7) can be discretized by dividing the problem domain 0 ≤ r ≤ 1 into a large
number, e.g., N – 1, of small line segments called (linear) elements, leading to a linear algebraic
problem in the matrix-vector form, for solving N nodal values of ρ plus A in (6) with N equations for
individual nodes from (5) and an equation based on (7), with known V(r) [18–21]. Conversely, the
same matrix-vector equation can also be used for calculating the rotation curve V(r) if the mass
distribution ρ(r) is known or assumed given. The matrix-vector approach described here as well as
the implemented computational code was validated by producing the same results as the known
analytical solutions for the Mestel disk and Freeman disk [20]. It also yielded mass distribution for
NGC 4736 based on measured rotation curves, comparable to that obtained using an iterative spectral
method with Bessel functions by other authors [21]. Similar results from the equation of (3) = (4) were
also shown with a model using lognormal mass distribution function [22]. By adding a spherical core
at the galactic center, as can easily be implemented with this matrix-vector approach, mass
distribution can be computed without central singular mass density for rotation curves with nonzero
velocity at r = 0 [21]. Thus, the mass distribution ρ(r) (actually the surface mass distribution [ρ(r) h])
can be determined for any galaxy from its measured rotation curve V(r), according to Newtonian
dynamics.
 Since the rotation curve in a spiral galaxy can be measured with reasonable certainty [23], it has
been accepted to provide the most reliable means for determining the distribution of gravitating
matter therein [17]. However, a rotation curve of V(r) implies axisymmetry and negligible variation
across the thickness and is at best a piece of approximate information about the behavior of a rotating
thin-disk galaxy, which is usually not exactly axisymmetric with detailed asymmetric structures such
as spiral arms. Hence, the mass distribution ρ(r) determined from a rotation curve V(r) with a thin-
disk model provides the value only in a sense of averaging over the ring of radius r which may not
be the same as the local mass density at a specific position on this very ring. The galaxies, though
appearing like a thin disk, also have “vertical” structures across the visible thickness. Therefore,
taking the predicted mass density with an axisymmetric thin-disk model out of context to compare
some measured value at a specific location inside a galaxy (e.g., the solar neighborhood in the Milky
Way) could naturally lead to substantial discrepancy. If splitting hairs with such an expected
discrepancy to discredit the thin-disk model, the outcomes can be confusing with technically
immature arguments. Only with a thorough understanding of the assumptions and approximate
nature in using the rotation curve to determine mass distribution in a disk galaxy, can the model
results be interpreted correctly for enhancing scientific knowledge.
 The computational results based on measured rotation curves for many galaxies of various types
had shown more or less exponential decrease of (surface) mass density with galactocentric distance
such as ρ(r) = ρ(0) exp(– r / Rd), i.e., the computed ρ verses r in a log-linear plots appear to be nearly
straight lines with negative slopes, for the most part when the abruptly varying ends at r = 0 and 1
are trimmed out [18–21]. Hence, the “gravitational mass”—determined from rotation curves--
distributions in disk galaxies qualitatively agree with the measured radial distributions of surface
brightness for a large number of disk galaxies [24–26], but the disk radial scale length, Rd, determined
from rotation curve based thin-disk model appears to be larger than that from fitting the brightness
Galaxies 2020, 8, 9 7 of 14

data (e.g., 4.5 kpc versus 2.5 kpc for Milky Way [20]). A straightforward interpretation of such a
discrepancy would be an indication of increasing mass-to-light ratio with galactocentric distance,
namely the (baryonic) matter becomes less luminous in regions further away from the galactic center.
This is consistent with typical edge-on views of disk galaxies that often revealing a dark edge against
a bright background central bulge (cf. the image of NGC 891 in Figure 1).

4. Mass Determined by Mass-to-Light Ratio—“Luminous Mass”
 Astronomical measurements rely on the analysis of signals carried by electromagnetic waves, or
the “light”. Considerably efforts have been made in correlating the light signal to characteristic
physical properties of stars and galaxies. Anything that may be derived from the light signal are taken
seriously and used for describing the behavior of celestial objects.
 For example, the stellar (gravitational) mass M determined from binary stars has become the key
component for establishing the so-called “mass-to-light” ratio M/L, by correlating the luminosity L of
stars to their masses. As the apparent brightness of a star is measured from a detector, it is expected
to relate to the star’s luminosity and distance based on the inverse square law. With the given
luminosity L and (surface) temperature T determined from its thermal radiation spectrum (based on
Stefan-Boltzmann law and Wien’s displacement law), the surface area and size (i.e., the radius R) of
a star may be calculated from the relationship [1,14,15]:
 =4 × (8)
where σ = 5.67×10⁻⁸ W m–2 K–4 is the Stefan-Boltzmann constant for black-body radiation. However, it
should be kept in mind that the emissions of galaxies may not exactly follow that of a blackbody with
emissivity equal to 1, in the presence of dust and gases.
 With the measured stellar properties (from nearby stars in the solar neighborhood), Hertzsprung
and Russelll independently developed a stellar classification system by plotting luminosities versus
surface temperatures—now called Hertzsprung-Russell (H-R) diagram or the color-magnitude
diagram. This kind of diagram has become “the primary point of contact between observations and
the theory of stellar structure and evolution” [1]. Most stars, including our Sun, fall somewhere along
the streak from the upper left (high luminosity and temperature corner) to the lower right (low
luminosity and temperature corner) on the H-R diagram; they are called the main-sequence stars.
There are also larger and brighter stars located above those of the main sequence, called giants and
supergiants, whereas smaller high temperature stars, located below those of the main sequence, are
called white dwarfs, because they appear white in color. All stars along the main sequence are fusing
hydrogen into helium in their cores, like the Sun. However, the main sequence stars differ in surface
temperature and luminosity because the rate of hydrogen fusion depends strongly on the stellar
mass, i.e., a star with more massive outer layer must sustain a higher nuclear fusion rate in order to
maintain gravitational equilibrium. When astronomers measured the masses of main-sequence stars
in binary star systems, they found that a star’s position along the main sequence is very closely related
to its mass [14,15]. For stars with both mass and luminosity determined, the values of their stellar
mass-to-light ratio M / L become known, which may be used for estimating the masses of similar stars
either not belonging to the binary systems or being too remote to measure directly.
 Surface photometry—a technique to measure the surface brightness distribution of extended
objects, such as galaxies—has shown that galaxies typically have luminosity profiles decreasing
approximately as an exponential function of the galactocentric distance r [24–26]. Many authors
simply assumed the same exponential function for the surface mass density distribution, implying
an assumption of constant M / L [24] for deriving the “luminous mass”.
 But among all the observable galaxies, individual stars can only be observed in the few closest
ones. A galaxy is a composite of millions and millions of stars of differing ages and masses over a
wide spectrum. To evaluate the overall mass-to-light ratio of a galaxy involves, its stellar population
must be studied with stellar population synthesis modeling, etc. Such a challenging sophisticated
endeavor with severely limited means of direct observation and measurements is expected to lead to
results of questionable certainties, which might be only useful for order-of-magnitude rough estimate
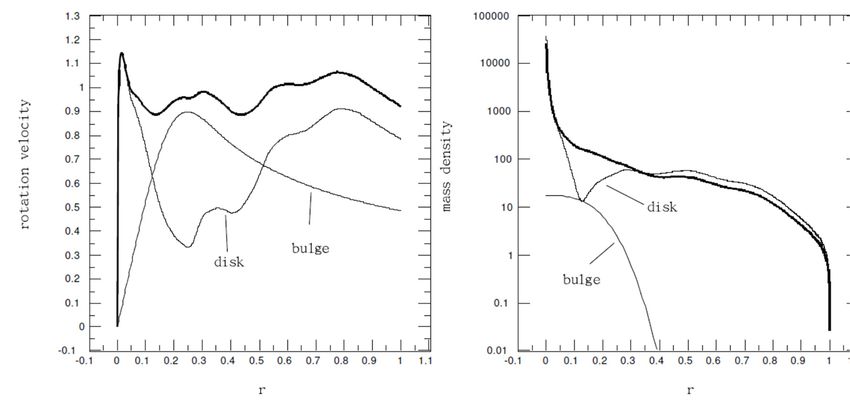
Galaxies 2020, 8, 9 8 of 14

of the amount of mass. Nonetheless, luminous masses from observed brightness based on estimated
mass-to-light ratios have been taken so seriously with overwhelming confidence that their apparent
difference from the gravitational masses (determined from rotation curves) became a primary
evidence for dark matter in galaxies [3–8].

5. Galaxy Rotation Curves Described without Dark Matter
 Celestial objects cannot be brought to the Earth and weighed on a balance to measure their
masses. But their motion can be observed with movement velocity measured from the Doppler shift
of their light spectral lines. The motions of astronomical objects are believed as their responses to the
gravitational interactions, according to Newtonian dynamics [1,14,15] (as had been tested and
confirmed numerous times over hundreds of years).
 Newton’s laws of motion describe the relationship among force, acceleration and mass.
Newton’s law of universal gravitation relates the gravitational force to the distribution of masses and
relative positions of interacting objects. Once the masses and relative positions of interacting celestial
objects are known, the gravitational force on each of them and their motions (in terms of velocity,
acceleration) can be determined. Conversely, their masses can be determined from their relative
positions and motions, if made available by measurements.
 For example, the mathematical form of Newtonian dynamics for a rotating thin disk galaxy of
gravitationally bound objects, e.g., stars, gases, dust, etc., can be expressed (approximately by
assuming the axisymmetry) as (3) equal to (4), relating the mass distribution ρ(r) to measured rotation
curve V(r). Thus, the rotation curve V(r) can be determined if mass distribution ρ(r) is known, by
calculating the integral in (4); conversely, ρ(r) in (4) can be determined from the known V(r) in (3),
which usually takes more mathematical effort though. As a matter of fact, various methods for
solving ρ(r) or [ρ(r) h] from the known V(r) have been developed by different authors, with pros and
cons pointed out and discussed from various perspectives [1,17–22]. Despite the apparent differences
in calculation procedures among different authors, the end results should be the same theoretically
because the solution to equation (3) = (4) is unique due to its linear nature.
 With available modern technologies, the rotation curves have been measured for many (disk)
galaxies [23]. Using a measured rotation curve V(r), the calculated surface mass density [ρ(r) h], e.g.,
by solving the linear algebra matrix problem based on (5) and (7), appears to decrease linearly in the
log-linear plot excluding the small regions around the galactic center and disk edge (where the
measured rotation curve terminates), for various galaxies [20,21]. This indicates that the surface mass
density in a thin-disk galaxy declines exponentially with the galactocentric distance, in general, as
consistent with what have been measured by surface photometry for surface brightness profiles of
many galaxies [24–26], qualitatively at least. Because the galactic rotation parameter A, defined in (6),
is also determined as part of the solution to the linear algebra problem based on (5) and (7), the total
mass of Mg can be calculated from the predicted value of A as Mg = V0 2 Rg / (G A). For example, the
Milky Way total mass is determined as 1.41×10¹¹ M⊙ from predicted A = 1.6365 with V0 = 220 km/s
and Rg = 20.55 kpc [21], very close to the Milky Way star counts of about 100 billion [1,27]. The
numerical approach for solving (5) and (7) can also account for the effect of a spherical bulge at
galactic center with slight mathematical manipulation [21], with results illustrated in Figure 3 for the
Milky Way. It has been shown that even for a bulge of mass as large as 7.57×10¹⁰ M⊙, the Milky Way
total mass would only change to 1.52×10¹¹ M⊙ (i.e., a less than 8% increase [21]). The total mass of the
Andromeda (NGC 224) can also be calculated as 2.76 × 10¹¹ M⊙ from A = 1.6450 with V0 = 250 km/s
and Rg = 31.25 kpc [21], about twice that of the Milky Way, as commonly being anticipated.
Galaxies 2020, 8, 9 9 of 14

 Figure 3. Profiles of the Milky Way rotation velocity V(r) and mass density ρ(r) for the disk portion
 and bulge portion as noted with the thick line as a reference from the pure disk model without a bulge
 (taken from Figure 7 of Ref. [21]). Noteworthy here is that the portion of mass density profile (shown
 with the thick line, as roughly a combined mass density profile from both disk and bulge) for r in the
 interval [0.1, 0.9] appears nearly linear in the semi-log plot (when when the abruptly varying ends
 around r = 0 and 1 are trimmed out), indicating an approximately exponential decline of mass density
 with galactocentric distance.

 Interestingly, the value of A defined in (6) seems to be around 1.70 for various rotation curves,
when the characteristic velocity V0 is taken as a representative value of the flat part of rotation curve
[18–21]. For Mestel’s disk of constant rotation velocity with available analytical solution, the value of
A is determined as π/2 = 1.5707063 [20]. A proportionality constant from a lognormal density
distribution model results of 38 galaxies for Mg versus Vmax 2 Rg [28] indicates a value of A equal to
1.57063 if Vmax and V0 happen to be the same as with Mestel’s disk. Comparing with the scalar virial
theorem, Mg = rg / G with and rg denoting the mean-square speed of the system’s stars and
the gravitational radius [1], this suggests that rg = V0 2 Rg / A , i.e., rg ~ 0.59 Rg if = V0 2 is
assumed. Given the fact that also includes the velocity dispersion in addition to the rotational
orbital part, it seems that rg = 0.5 Rg (corresponding to ~ 1.18 V0 2) could be a reasonable
approximation for rough estimate of the total mass in a disk galaxy from the measured rotational
velocity based on the virial theorem.
 Besides the region of 0.1 < r < 0.9 for near-exponential decline of mass distribution, Figure 3 also
shows a much sharper increase of mass density toward the galactic center for r < 0.1, which seems to
be fairly typical for many galaxies [21]. Rapid increasing luminosity toward the galactic center has
also been commonly shown in the surface brightness profiles which some authors would categorize
as the “bulge”region [26]. To seriously include the bulge effect in the disk model may introduce more
variables to the result, unless the bulge mass distribution is known a priori for uniquely determined
mass in disk with a given rotation curve [21].
 However, if the mass distribution is assumed to follow exactly that of surface luminosity by a
constant mass-to-light ratio, the surface mass density [ρ(r) h] becomes known and the predicted
rotation curve V(r) determined from the equation of (3) = (4) might not match the measured one. The
mass converted from the mass-to-light ratio is usually found to decrease at a higher rate with
galactocentric distance (corresponding to a smaller disk radial scale length) than that determined
from rotation curve [20]. Such an apparent discrepancy has been called the “galactic rotation
problem”, as a subject for various scientific interpretations. Most astronomers and astrophysicists
would take this as a “compelling evidence” for (nonbaryonic) dark matter in galaxies [3–8]. Only a
few authors would want to consider uncertainties in mass-to-light ratio as well as generally
questionable accuracy in astronomical measurements, as the root cause [9]. Recently, the notion of
Galaxies 2020, 8, 9 10 of 14

nonbaryonic dark matter has also been challenged from the perspective of dynamical evolution of
galaxies [29].
 First of all, the values of stellar mass-to-light ratio, as determined from measurements, can vary
substantially depending upon the nature of light emitting objects (as shown by the H-R diagram for
stars [14,15]). For galaxies, Tully and Fisher [30] proposed an empirical relation between (intrinsic)
luminosity and (maximum) rotation velocity (inferred from the “hydrogen profile width”), which
might be used for estimating galaxy (total) mass from measured rotation velocity with a mass-to-
light ratio. However, the luminosity was subsequently shown not to be a perfect predictor of mass,
as the stellar mass-to-light ratio can vary with galaxy type and the Tully-Fisher relation can have
different slopes depending on the luminosity bandpass [31–34].
 Galaxies are known to contain matter other than stars. For example, the rotation curves
measured with the 21 cm wavelength signals emitted from atomic hydrogen (H I) extends far beyond
the starlight in galaxies, indicating certain amount of H I exists at least as far as where the rotation
curve can be measured. Actually, H I may not be considered as totally dark; it is luminous at the 21
cm wavelength (in a different photometric bandpass from that of stars), which could be detected for
estimating its mass. In fact, the “column” mass density of atomic hydrogen had been estimated using
emission in the 21-cm line in terms of integral of the brightness temperature over the velocity width
of the line, suggesting an atomic hydrogen number density of order 1 cm-3 in the galactic plane [35,36],
but apparently without an independent method to validate. There are also hydrogen molecules (as
molecular hydrogen) found in molecular clouds and in the Interstellar Medium (ISM), which appear
to be literally dark when cold as majority of them are (e.g., around 10-20K [37,38]). The amount of
“dark” hydrogen molecules could only be estimated by assuming a constant ratio from the
luminosity of carbon monoxide, with unknown uncertainties, of course. Furthermore, condensed
baryonic matter in the form of dust and debris is expected to have minimal effect on optical extinction
and can easily avoid detection due to the small optical cross section [39]. The presence of those
optically undetectable components (with Μ / L approaching to infinity) makes it certain that there
must be more baryonic matter than what can be represented in terms of mass-to-light ratio. Indeed,
the baryonic Tully-Fisher relation was shown to be optimally improved when the HI mass is
multiplied by a factor of about 3 [40]. Therefore, estimating mass in a galaxy simply based on a
constant mass-to-light ratio can be seriously flawed, though convenient. Its usage may provide some
order-of-magnitude rough idea about the amount of mass, but should not be considered for serious
comparison and verification in scientific analysis. In view of the technical difficulties in detecting
astronomical matter and evaluating celestial mass, the existence of invisible baryonic matter that
cannot be accounted for by a simple M/L is naturally expected following scientific logic.
 Some authors would like to use multicomponent models, composed of a bulge, a disk, and a
(dark matter) halo extending to a very large virial radius, for estimate of galaxy mass [41,42]. While
the central bulge and circular disk are commonly observed, visible in photographic images of galaxies
[1], whether there should be a dark matter halo has been a debatable subject [9]. Even to this day,
“the shape of dark matter halos remains a mystery” [7]. The reason for having a massive invisible
(spherical) dark matter halo came from an argument that it offers a plausible way to stabilize the
Galaxy against the bar instability [43], but some galaxies have been shown to have rotation curves
that do not satisfy the so-called sphericity condition (based on the fact that mass cannot have negative
value), indicating a significantly massive spherical halo cannot be present at large galactocentric
distance beyond the central bulge [44,45]. There are also N-body simulations showing that a disk
galaxy with flat rotation curve can be stabilized by dense central bulge without the dark matter halo
[46]. Actually, there has not been clear scientific justification for having a massive dark matter halo
around the disk galaxies.
 It was stated in a recent report that the Milky Way “mass estimates can vary markedly based on
the types of data used, the techniques used, and the assumptions that go into the mass estimate …”
[42]. Nevertheless, a value of the Milky Way mass could be derived as ~1.5 × 10¹² M⊙ from an assumed
composition of a nucleus, bulge, disk, and a halo of a virial radius over 200 kpc [42]. Interestingly,
the mass within 21.5 kpc (where the Gaia rotation curve terminates) was estimated about 2.1 × 10¹¹
Galaxies 2020, 8, 9 11 of 14

M⊙ [42], quite comparable to 1.52 × 10¹¹ M⊙ or 1.41 × 10¹¹ M⊙ with or without a central bulge as
numerically determined from a measured rotation curve up to 20.55 kpc [21].
 In fact, the mass in a galaxy determined from measured rotation curve, according to Newtonian
dynamics, seems to be fairly consistent regardless of the sources of rotation curve measurement data,
which could vary somewhat. Further calculation shows that the predicted surface mass density in
the solar neighborhood around 8 kpc should be ~144 M⊙/pc2 using a pure disk model or ~74 M⊙/pc2
when a sizable bulge is included in the computation [21]. As a reference, the current textbook value
of surface mass density for solar neighborhood is ~49 M⊙/pc2 based on estimates from observations
[1]. In view the fact that an axisymmetric disk model describes a surface mass density only
meaningful in terms of averaging over the entire circular ring of radius ~8 kpc, while the local mass
density may actually vary significantly along the ring (as shown in the photographic images),
shouldn’t we consider the Newtonian dynamic model to be reasonably accurate? Moreover, a surface
mass density of 100 M⊙/pc2 in the Milky Way model [21] corresponds to equivalently ~20 hydrogen
atoms or ~10 hydrogen molecules per cm3 for an assumed disk thickness of 200 pc [9], extremely
tenuous by the terrestrial standards and well within the reported range of estimated gas density in
the Interstellar Medium [1,47]. If the typical density of cold molecular clouds to enable star formation
ranges from 102 to 106 molecules per cm3 [47], it is not difficult to realize the possible magnitude of
variations in mass density just within a ring containing the solar neighborhood.
 Thus, the measured galactic rotation curves generally coincide with exponentially declining
mass density (distributed in thin disk) with increasing galactocentric distance, according to
Newtonian dynamics. The assumption of mass distribution mostly in a circular thin disk comes from
the optical images of disk shaped galaxies, based on a belief that luminosity correlates to mass,
somewhat roughly if not exactly. The total mass in a rotating disk galaxy, determined from measured
rotation curve according to Newtonian dynamics, appears to match the star counts reasonably well
(at least for the Milky Way). Adding a spherical central bulge with substantial amount of mass to the
thin-disk model may only change the total mass by a few percent, but can have noticeable effect on
local mass density in the solar neighborhood [21]. A recent examination of a large number of galaxies
yielded a universal fitting formula with one fit parameter—the “acceleration scale”—to relate
observed radial (centripetal) acceleration (as determined from rotation curves) to that from the
“baryons” (i.e., that determined from measured luminosity profile with an assumed constant mass-
to-light ratio) [48]. While a popular interpretation of this finding had attributed the difference
between the observed radial acceleration and that due to the baryons to the non-baryonic dark matter
[48], it could also be much more straightforwardly explained by having a non-constant, variable (e.g.,
increasing) mass-to-light ratio as a function of galactocentric distance [9], possibly with one fit
parameter. By virtue of scientific understanding about distributed matter, it is actually natural to
expect the mass-to-light ratio, if meaningful at all, to be a non-constant variable in different regions
of a galaxy, considering the fact that certain forms of baryonic matter in the universe can exist with
very small optical cross section and become invisible to detection except by gravitational effects [39].
Then, the value of total mass associated with the mass distribution corresponding to measured
rotation curve, with or without a central bulge being accounted for, seems also to be consistent with
astronomical observations and well-established Newtonian dynamics. In other words, galaxy
rotation curves can be supported with reasonable amount of mass (consistent with star counts)
according to Newtonian dynamics, without involving mysterious non-baryonic dark matter or
modification of the known laws of Newtonian dynamics (e.g., MOND).

6. Concluding Remarks
 The scientific method involves observation, formulating hypotheses via induction, experimental
testing with quantitative measurements, and refinement or elimination of the hypotheses based on
the experimental findings. Numerous astronomical observations have shown spiral galaxies
exhibiting the common configuration of a bright circular disk with a relatively small central bulge (cf.
Figure 1), suggesting that mass therein would likely distribute in a similar configuration. Further
measurements have indicated that matter in those disk galaxies is generally moving in circular orbits
Galaxies 2020, 8, 9 12 of 14

in the disk, with quantified description known as the rotation curves (with the circular orbital velocity
given as a function of galactrocentric distance). From well-established Newtonian dynamics, matters
moving in circular orbits are expected to have their centripetal acceleration balanced by the
gravitational force of distributed mass. Then a logically induced model for theoretical understanding
could consist of an approximate axisymmetric disk, with or without a central bulge, wherein the mass
distribution and measured rotation curve are consistent with Newtonian dynamics, as that
determined by solving the (3) = (4) equation.
 Astronomical measurements are generally challenging for accuracy due to limited means with
obvious technical difficulties. Most quantities cannot be measured directly, but must be inferred via
assumptions over assumptions with raw data presented in graphs often scattering over orders of
magnitude for an anticipated point. Although the efforts in searching for independent test of theory
should not be discouraged, findings of quantitative discrepancies between observational data and
theoretical prediction ought to stimulate serious interrogations of the measurement accuracy as well
as simplifying assumptions in theoretical calculations.
 In the case of galactic rotation, the surface mass density determined from measured rotation
curve exhibits an exponential-like decline with the galactocentric distance (for the most part) similar
to that based on observed luminosity in a qualitative sense. The overall amount of mass consistent
with the rotation curve matches the known star counts. An apparent discrepancy (e.g., in regard to
local mass density in the solar neighborhood) appears to be within a factor of two to three, while in
general the uncertainties in astronomical measurements have not been clearly quantified and could
become well over an order of magnitude. The estimated mass using an assumed constant mass-to-
light ratio is scientifically expected to be flawed, because it cannot adequately account for the
optically undetectable baryonic “dark” components that can exist in the universe such as molecular
hydrogen, dust, etc. On the other hand, the rotation curve itself is not error free, with an implication
of axisymmetry in the galactic disk which can only be an approximation at best. Therefore, the
predicted mass distribution based on Newtonian dynamics using measured rotation curve cannot be
an exact prediction, especially for the asymmetric features such as bars and spiral arms, not because
of any fundamental shortcomings in Newtonian dynamics but rather due to limited means for
accurate, comprehensive measurements. By examining the historical evidence with scientific logic,
the so-called “galactic rotation problem” becomes very likely a consequence of misinterpreted
measurement data with poorly examined, underestimated intrinsic uncertainties and misunderstood
theoretical model description, rather than an indication of mysterious nonbaryonic dark matter.
 The lack of means for accurate evaluation of amount of matter at different astronomical scales
leaves plenty of room and freedom for theoretical speculations; “there is always the possibility that
one or all of the estimates could be wrong” [7]. Inability of directly and reliably measuring the amount
of all baryonic matter in the observable universe with the available technology is scientifically
expected and should not be regarded as a mystery. For disk galaxies, the measured rotation curves
provide the most reliable information for deriving the mass distribution base on Newtonian
dynamics [17,23]. When the Newtonian dynamics model suggests more mass than that indicated by
luminosity based on some value of mass-to-light ratio, there is likely to exist some “invisible”
baryonic matter that is “dark” and undetectable to the available instrument. If the mass obtained by
other (less reliable) methods, such as that from a mass-to-light ratio, does not match that determined
from rotation curve, it should be naturally understandable as a consequence of inevitable
uncertainties of an inaccurate estimate, instead of being considered as primary evidence for
mysterious dark matter. The validity of indirect observational evidence for (nonbaryonic) dark matter
remains generally questionable, because of decades-long efforts with again and again failed direct
detection. Yet numerous research papers published in scientific literature rather faithfully presumed
the existence of nonbaryonic dark matter (for the convenience of obtaining seemingly “self-
consistent” results), without serious consideration alternative possibilities. This appears to be a
common “snowball” effect in modern astronomy and cosmology for scientists to conform to the
mainstream ideas so as to obtain research funds and observing time on major telescopes [49,50]. But
the progress of science generally relies on truth-seeking people who look critically at the
Galaxies 2020, 8, 9 13 of 14

contemporary schemes, and continuously point out flaws in the established, especially
unsubstantiated, views based on more reliable evidence. Without inquisitive doubt and skepticism,
science cannot thrive and will stagnate.
Author Contributions: The author is solely responsible for the contents in this manuscript.

Funding: This research received no external funding.

Acknowledgments: The author would like to dedicate this work to his late friend Chuck Gallo, whose wisdom
and scientific intuition directed the author into investigation of the so-called galactic rotation problem as well as
the issues associated with dark matter. The author also wants to thank Professor Anne Hofmeister for the
invitation to write this review article. The constructive comments from a reviewer and the academic editor
greatly helped enhance and clarify the presentation contents and therefore are highly appreciated.

Conflicts of Interest: The author declares no conflict of interest.

References
1. Binney, J.; Tremaine, S. Galactic Dynamics, 2nd ed.; Princeton University Press: Princeton, NJ, USA, 2008.
2. Newton, I. Philosophiae Naturalis Principia Mathematica; Benjamin Motte: London, UK, 1687; The Principia:
 Mathematical Principles of Natural Philosophy; University of California Press: Oakland, CA, USA, 1999.
3. Trimble, V. Existence and nature of dark matter in the universe. Annu. Rev. Astron. Astrophys. 1987, 25, 425–
 472.
4. Faber, S.M.; Gallagher, J.S. Masses and mass-to-light ratios of galaxies. Annu. Rev. Astron. Astrophys. 1979,
 17, 135–187.
5. Van Albada, G.D.; Sancisi, R. Dark matter in spiral galaxies. Philos. Trans. R. Soc. Lond. 1986, A320, 447–464.
6. Carignan, C.; Freeman, K.C. Basic parameters of dark halos in late-type spirals. Astrophys. J. 1985, 294, 494–
 501.
7. Freeman, K.C.; McNamera, G. In Search of Dark Matter, 1st ed.; Springer: New York, NY, USA, 2006.
8. Panek, R. The 4% Universe: Dark Matter, Dark Energy, and the Race to Discover the Rest of Reality; Mariner
 Books: Boston, MA, USA, 2011.
9. Feng, J.Q.; Gallo, C.F. Deficient reasoning for dark matter in galaxies. Phys. Int. 2015, 6, 11–22.
10. Van Dokkum, P.; Danieli, S.; Cohen, Y.; Merritt, A.; Romanowsky, A.J.; Abraham, R.; Brodie, J.; Conroy, C.;
 Lokhorst, D.; Mowla, L.; et al. A galaxy lacking dark matter. Nature 2018, 555, 629–632.
11. Unusual Galaxies Defy Dark Matter Theory. Available online: http://www.keckobservatory.org/df2-df4/
 (accessed on 4 September 2019).
12. Gossan, S.; Ott, C. Methods of Measuring Astronomical Distances. LIGO-T1200427-v1 2012. Available
 online: https://dcc.ligo.org/public/0096/T1200427/001/distance-ladder.pdf (accessed on 29 August 2019).
13. Trujilo, I.; Beasley, M.A.; Borlaff, A.; Carraso, E.R.; Di Cintio, A.; Filho, M.; Monelli, M.; Montes, M.; Roman,
 J.; Ruiz-Lara, T.; et al. A distance of 13 Mpc resolves the claimed anomalies of the galaxy lacking dark
 matter. Mon. Not. R. Astron. Soc. 2019, 486, 1192–1219.
14. Binney, J.; Merrifield, M. Galactic Astronomy; Princeton University Press: Princeton, NJ, USA, 1998.
15. Bennett, J.; Donahue, M.; Scheider, N.; Voit, M. Cosmic Perspective: Stars, Galaxies and Cosmology, 1st ed.;
 Pearson College Division: New York, NY, USA, 2007.
16. Landau, L.D.; Lifshitz, E.M. Mechanics, 3nd ed.; Pergamon Press: New York, NY, USA, 1976.
17. Toomre, A. On the distribution of matter within highly flattened galaxies. Astrophys. J. 1963, 138, 385–392.
18. Gallo, C.F.; Feng, J.Q. A thin-disk gravitational model for galactic rotation. 2nd Crisis Cosmol. Conf. 2009,
 413, 289–303.
19. Gallo, C.F.; Feng, J.Q. Glactic rotation described by a thin-disk gravitational model without dark matter. J.
 Cosmol. 2010, 6, 1373–1380.
20. Feng, J.Q.; Gallo, C.F. Modeling the Newtonian dynamics for rotation curve analysis of thin-disk galaxies.
 Res. Astron. Astrophys. 2011, 11, 1429–1448.
21. Feng, J.Q.; Gallo, C.F. Mass distribution in rotating thin-disk galaxies according to Newtonian dynamics.
 Galaxies 2014, 2, 199–222.
22. Marr, J.H. Galaxy rotation curves with lognormal density distribution. Mon. Not. R. Astron. Soc. 2015, 448,
 3229–3241.
23. Sofue, Y.; Rubin, V.C. Rotation curves of spiral galaxies. Annu. Rev. Astron. Astrophys. 2001, 39, 137–174.
24. Freeman, K.C. On the disks of spiral and S0 galaxies. Astrophys. J. 1970, 160, 811–830.
Galaxies 2020, 8, 9 14 of 14

25. Van der Kruit, P.C. The radial distribution of surface brightness in galactic disks. Astron. Astrophys. 1987,
 173, 59–80.
26. Merritt, A.; van Dokkum, P.; Abraham, R.; Zhang, J. The Dragonfly nearby galaxies survey. I. Substantial
 variation in the diffuse stellar halos around spiral galaxies. Astrophys. J. 2016, 830, 62.
27. Sparke, L.S.; Gallagher, J.S. Galaxies in the Universe: An Introduction; Cambridge University Press:
 Cambridge, UK, 2007.
28. Marr, J.H. Angular momentum of disc galaxies with a lognormal density distribution. Mon. Not. R. Astron.
 Soc. 2015, 453, 2214–2219.
29. Zhang, X. Dynamical Evolution of Galaxies; Walter de Gruyter GmbH: Berlin, Germany, 2018.
30. Tully, R.B.; Fisher, J.R. A new method of determining distances to galaxies. Astron. Astrophys. 1977, 54, 661–
 763.
31. Freeman, K.C. Historical introduction. In The Low Surface Brightness Universe; Astronomical Society of the
 Pacific Conference Series, Cardiff, Wales, 5–10 July 1998; Davies, J.I., Impey, C., Pillipps, S., Eds.;
 Astronomical Society of the Pacific: San Francisco, CA, USA, 1999; pp. 3–8.
32. Tully, R.B.; Pierce, M.J.; Huang, J.-S.; Saunders, W.; Verheun, M.A.W.; Witchalls, P.L. Global extinction in
 spiral galaxies. Astron. J. 1998, 115, 2264–2272.
33. Courteau, S.; Dutton, A.A.; van den Bosch, F.C.; MacArthur, L.A.; Dekel, A.; McIntosh, D.H.; Dale, D.A.
 Scaling relations of spiral galaxies. Astrophys. J. 2007, 671, 203–225.
34. McGaugh, S.S. The baryonic Tully-Fisher relation of gas rich galaxies as a test of ΛCDM and MOND. Astron.
 J. 2012, 143, 40.
35. Dickey, J.M.; Benson, J.M. Neutral hydrogen studies with a novel instrument. Astron. J. 1982, 87, 278–305.
36. Dickey, J.M. Measuring atomic hydrogen masses using the 21-cm line. In The Interstellar Medium in Galaxies,
 Astrophysics and Space Science Library; Thronson, H.A., Jr., Shull, J.M., Eds.; Springer: Dordrecht, The
 Netherlands, 1990; pp. 473–481.
37. Combes, F. H2 in Galaxies. In H2 in Space; Paris, France, 28 September–1 October 1999; Combes, F., Pineau
 des Forets, G., Eds.; Cambridge University Press: Cambridge, UK, 1999.
38. Marmet, P. Discovery of H2, in space explains dark matter and redshift. In 21st Century Science and
 Technology; Spring: Dordrecht, The Netherlands, 2000; pp. 5–7. Available online:
 www.newtonphysics.on.ca/hydrogen/ (accessed on 10 December 2019).
39. Meinel, A.B. Galaxiy collisions and ordinary dark matter. Phys. Today 2007, 60, 14, doi:10.1063/1.2743106.
40. Pfenniger, D.; Revaz, Y. The baryonic Tully-Fisher relation revisited. Astron. Astrophys. 2005, 431, 511–516.
41. Courteau, S.; Cappellari, M.; de Jong, R.S.; Dutton, A.A.; Emsellem, E.; Hoekstra, H.; Koopmans, L.V.E.;
 Mamon, G.A.; Maraston, C.; Treu, T.; et al. Galaxy masses. Rev. Mod. Phys. 2014, 86, 47–119.
42. Watkins, L.L.; van der Marel, R.P.; Sohn, S.T.; Evans, N.W. Evidence for an intermediate-mass Milky Way
 from Gaia DR2 halo globular cluster motions. Astrophys. J. 2019, 873, 118.
43. Ostriker, J.P.; Peebles, P.J.E. A numerical study of the stability of flatterned galaxies: Or, can cold galaxies
 survive. Astrophys. J. 1973, 186, 467–480.
44. Bratek, L.; Jalocha, J.; Kutschera, M. On the asisymmetric thin disc model of flattened galaxies. Mon. Not.
 R. Astron. Soc. 2008, 391, 1373–1383.
45. Jalocha, J.; Bratek, L.; Kutschera, M.; Skindzier, P. Global disc models for galaxies NGC 1365, 6946, 7793
 and UGC 6446. Mon. Not. R. Astron. Soc. 2010, 406, 2805–2816.
46. Sellwood, J.A.; Evans, N.W. The stability of disks in cusped potentials. Astrophys. J. 2001, 546, 176–188.
47. Ferriere, K.M. The interstellar environment of our galaxy. Rev. Mod. Phys. 2001, 73, 1031–1066.
48. McGaugh, S.S.; Lelli, F.; Schombert, J.M. Radial acceleration relation in rotationally supported galaxies.
 Phys. Rev. Lett. 2016, 117, 201101.
49. Burbidge, G. New vistas in cosmology and cosmogony. In The Universe at Large. Key Issues in Astronomy and
 Cosmology; Munch, G., Mampaso, A., Sanchez, F., Eds.; Cambridge University Press: Cambridge, UK, 1997;
 pp. 64–109.
50. Lopez-Corredoira, M. Non-standard models and the sociology of cosmology. Stud. Hist. Philos. Mod. Phys.
 2014, 46, 86–96.

 © 2020 by the author. Licensee MDPI, Basel, Switzerland. This article is an open access
 article distributed under the terms and conditions of the Creative Commons Attribution
 (CC BY) license (http://creativecommons.org/licenses/by/4.0/).
You can also read