Hurricanes: Science and Society - Hurricane Science Hurricane Forecasts, Observations, and Models Impacts, Preparation, and Mitigation
←
→
Page content transcription
If your browser does not render page correctly, please read the page content below
Hurricanes:
Science and Society
Hurricane Science
Hurricane Forecasts, Observations, and Models
Impacts, Preparation, and Mitigation

www.hurricanescience.org
Graduate School of Oceanography
University of Rhode Island                      1
The Hurricanes: Science and Society website (www.hurricanescience.org) and associated educational
    resources provide information on the science of hurricanes, methods of observing hurricanes, modeling
    and forecasting of hurricanes, how hurricanes impact society, and how people and communities can
    prepare for and mitigate the impacts of hurricanes. There is also a hurricane history interactive, hurricane
    case studies, and a special section for educators.

    Contents
    Introduction to Hurricanes: Science and Society, 3
    Hurricane Science, 4
    Hurricane Forecasts, Observations, and Models, 10
    Impacts, Preparation, and Mitigation, 14
    Hurricanes: Science and Society Resources, 16

    Acknowledgments
    The Hurricanes: Science and Society website and educational resources have been developed by the
    University of Rhode Island (URI) Graduate School of Oceanography (GSO). Many other people contributed
    to the site, including independent scientific reviewers and 14 middle and high school teachers. The
    Hurricanes: Science and Society project has been funded by the National Science Foundation. Other
    contributors are acknowledged below.

    Hurricanes Science and Society Team
    from the URI Graduate School of Oceanography
    Gail Scowcroft, Project Director
    Isaac Ginis, Professor of Oceanography
    Chris Knowlton, Marine Research Associate
    Richard Yablonsky, Marine Research Associate
    Holly Morin, Marine Research Associate
    Darrell McIntire, Graphic Designer

    Project Partners
    Louisiana State Museum
    Raytheon Web Solutions

    Scientific Reviewers
    Eric Cote, Cote & D’Ambrosio Communications
    Mark DeMaria,* NOAA / NESDIS Regional and Mesoscale Meteorology Branch
    Kerry A. Emanuel,* Massachusetts Institute of Technology
    Chris Landsea,* NOAA / NWS/National Hurricane Center
    Robert Hart, Florida State University
    Tom Knutson,* NOAA /Geophysical Fluid Dynamics Laboratory
    James Kossin,* NOAA / National Climate Data Center
    Mark Powell, NOAA /AOML / Hurricane Research Division
    Peter Sheng,* University of Florida
    Eric Williford,* WeatherPredict Consulting, Inc.
    Jason Lin, Weather Predict Consulting, Inc.
    *denotes reviewers who have served on the Hurricanes: Science and Society Advisory Team
    Second edition © 2011 University of Rhode Island

    If you wish to cite this document, please reference as follows:
    Scowcroft, G., Ginis, I., Knowlton, C., Yablonsky, R., and Morin, H., 2011.
    Hurricanes: Science and Society. University of Rhode Island, 16 pp.

2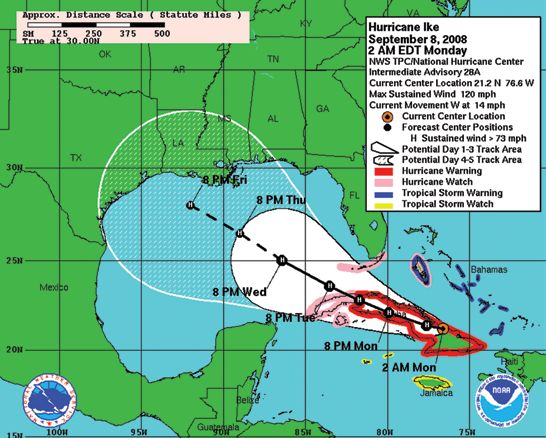
Introduction to Hurricanes: Science and Society
Hurricanes threaten more than 47 million people along the United
States coast from Maine to Texas, and the number of people threat-
ened is growing. From 1990-2008, population density increased by
32% in Gulf of Mexico coastal counties, 17% in Atlantic coastal
counties, and 16% in Hawaii. Much of the United States’ densely
populated Atlantic and Gulf Coast coastlines lie less than 10 feet
above mean sea level. Not only people are threatened, as over half
of the United States economic productivity is located within coast-
al zones.
Worldwide, some of the most deadly natural disasters have
been tropical weather events, including the Great Bhola Cyclone
of 1970, which struck Bangladesh and killed as many as 500,000
people, and Cyclone Nargis, which made landfall in Myanmar in
2008, causing catastrophic destruction and at least 138,000 fatali-
ties. In the U.S., the most deadly hurricane has been the Galveston
Hurricane of 1900, which caused more than 6,000 fatalities.
Each year, an average of eleven tropical storms develop over
the Atlantic Ocean, Caribbean Sea, and Gulf of Mexico. Many of
these remain over the ocean and never impact the U.S. coastline.
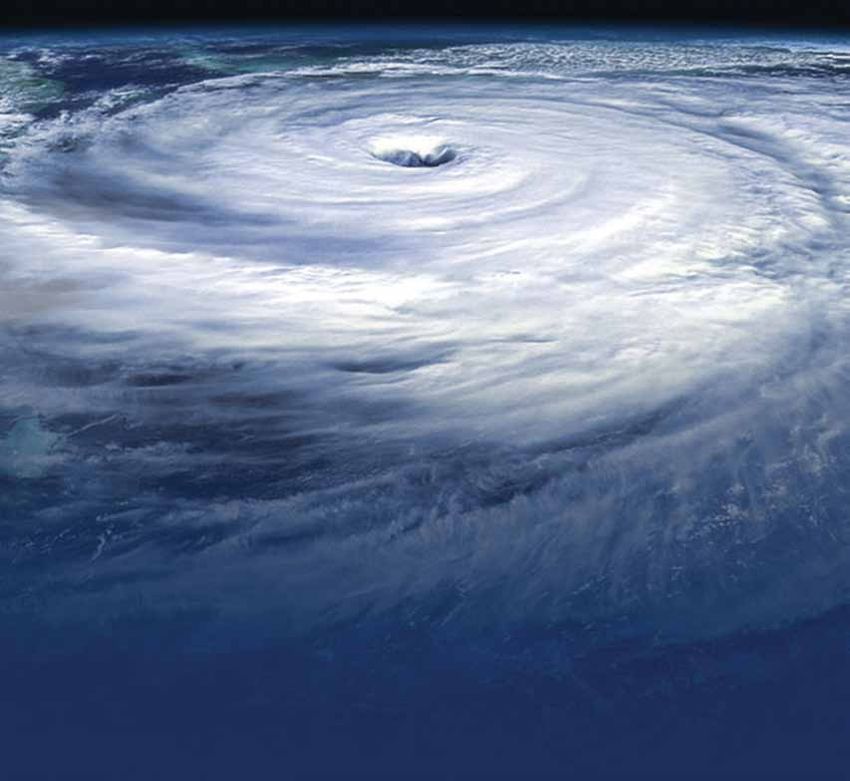
Hurricane Katrina in 2005, however, provided a grim reminder of
what can happen when a hurricane does make landfall.
With Atlantic hurricane activity well above average in 2004
Courtesy of NASA NOAA GOES Project
and 2005, the relationship between hurricanes and climate change
has become a source of public interest, significant scientific de-
bate, and a focus for current research. The potential relationship
between hurricanes and climate change has great implications for
society, especially in coastal regions affected by these extreme
storms.
Scientific advances in understanding the behavior of hurricanes have dramatically
improved the ability to prepare for hurricanes and protect homes and businesses when
they do strike. Yet despite this progress, millions of people still fail to adequately protect
their homes against hurricanes, putting themselves and their family at serious risk. Major
goals of the Hurricanes: Science and Society website (www.hurricanescience.org) are to
provide foundational science for understanding complex scientific content, inform visi-
tors about current scientific and technological advances, and to help visitors make good
decisions prior to and during a hurricane emergency.
The Hurricanes: Science and Society website and associated resources provide infor-
mation on hurricane related topics: the basic science of hurricanes, methods of observing
hurricanes, modeling and forecasting of hurricanes, how hurricanes impact society, how
people and communities can prepare for and mitigate the impacts of hurricanes, informa-
tion about significant hurricanes through history, and a special section for educators. The
following information is based solely on published scientific research and is a result of the
Hurricanes: Science and Society project. All content has undergone thorough peer review
by a panel of scientific experts.
3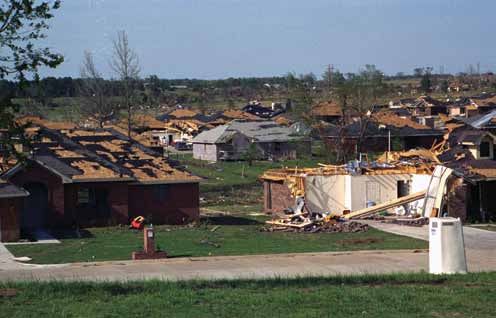
Hurricane Science

                                               Tropical cyclones are intense low-pressure weather systems that form in tropical waters. In
                                               the North Atlantic Ocean and Eastern Pacific Ocean, tropical cyclones are called hurricanes,
                                                                                           and in the Western Pacific Ocean, they are called
                             Tropical cyclones require warm water to form. typhoons. The beginning of life for any hurricane
                                                                                           is a pre-existing disturbance, which is an area of
                                               low pressure over the tropical ocean. This disturbance and other necessary conditions must
                                               be located in an environment that is favorable for development. Favorable conditions include:
                                               • A sea surface temperature (SST) of at least ~26.5°C (~80°F).
All hurricanes begin as an area of low
pressure in the atmosphere, where surface      • A vertical temperature profile in the atmosphere that cools enough with height to support
                                                         Hurricane Lifecycle

winds are converging toward each other.          thunderstorm activity.
This low-pressure area is called a tropical    • Sufficient water vapor in
disturbance. If suitable conditions exist, the   the middle of the tropo-

                                                                                                                                               Courtesy of the Space Science and Engineering Center
circulation may become more organized            sphere (the lowest layer of
and wind speeds may increase. Once
the system obtains a clearly identifiable
                                                 the atmosphere). Even over
                                                 the tropical oceans, dry air

                                                                                                                                               University of Wisconsin-Madison
circulation center, the system is upgraded
to a tropical depression. If winds continue      sometimes exists in the
to intensify to greater than 63 km/hr (39        middle of the troposphere,
mph), the system will be classified as           and this dry air suppresses
a tropical storm, and once winds are
                                                 thunderstorms, preventing
sustained above 119 km/hr (74mph), the
system is officially upgraded to a hurricane     tropical depression formation.
(in the Atlantic, Central Pacific, and Eastern • Sufficient distance from the equator for the Coriolis Force to be significant, usually at least
Pacific regions).                                483 km (300 miles). Closer to the equator, the Coriolis Force is weak; therefore, it is dif-
                                                 ficult to establish cyclonic rotation.
                                               • Low values of vertical wind shear from the surface of the earth to the upper troposphere
                                                 (about 8 miles up). For reasons that remain unclear, wind shear inhibits the development
                                                 of tropical depressions. Some research shows this inhibition may be due to the injection of
                                                 dry air into the storm system.
                                                     Even when all the above favorable conditions are present, a tropical depression still
                                               may not form. For this reason, understanding and forecasting the genesis of a tropical de-
                                               pression is a difficult challenge. In the North Atlantic and Northeast Pacific Oceans, most
                                      Courtesy of NOAA

                                               of the atmospheric disturbances that can intensify into a hurricane are associated with an
                                               African easterly wave, an area of low atmospheric pressure that is embedded in the easter-
Tropical Depression- maximum surface           ly trade winds and that generally forms over Africa. In other ocean basins, different kinds
wind speeds less than or equal to 61 km/hr     of atmospheric disturbances may become tropical cyclones. For example, many Northwest
(38 mph).                                      Pacific typhoons originate
Tropical Storm- maximum sustained wind         from a disturbance in a mon-
speeds of 63–117.5 km/hr (39–73mph).           soon trough (locations
Hurricane- maximum sustained wind speed        of relatively minimal sea
greater than or equal to 119 km/hr (74 mph).   level pressure in a mon-
Saffir-Simpson Hurricane Wind Scale            soon region).
Category        Wind km/hr           Wind mph
                                                     Development of a trop-
   1            119–153		              74–95   ical depression into a ma-
   2            154–177		             96–110   ture hurricane requires
                                               heat energy from the ocean
                                                                                                                                                   Courtesy of NOAA

   3            178–209		            111–130
   4            210–249		            131–155   surface. For this reason,
   5               249+		               155+
                                               hurricanes do not usually

4                                                                                                                   For more about hurricanes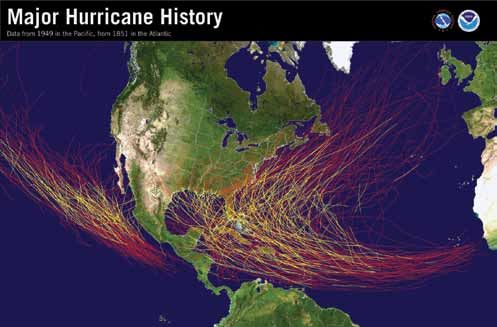
A hurricane can be compared to an engine.

                                                                                                                                                                         Hurricane activity varies over different time
                                                                                                                                                                         cycles, and the reasons for this variability

                                                                                                                                                 Hurricane Variability
                                                                                                                                                                         are not all well understood. One cycle that
                                                                                                                                                                         is well-defined in the Atlantic Region is the
                                                                                                                                                                         annual Atlantic hurricane season, which
                                                                                                                                                                         runs from June 1st to November 30th each
                                                                                                                                                                         year. The graph below shows the aver-

                                                                                                         Adapted from the UCAR / COMET Program
                                                                                                                                                                         age distribution of hurricane and tropical
                                                                                                                                                                         storm activity throughout the year. From
                                                                                                                                                                         this graph, it is clear that the majority of
                                                                                                                                                                         tropical cyclones in the Atlantic Basin occur
                                                                                                                                                                         between August and October with a peak
                                                                                                                                                                         in September. Another cause of tropical
                                                                                                                                                                         cyclone variability is the El Nino-Southern
                                                                                                                                                                         Oscillation (ENSO). ENSO is the term used
develop over land or outside of the warm tropical oceans where the sea surface temperature (SST)                                                                         to define the oceanic El Nino/La Nina cycle
is colder than ~26.5°C (~80°F). Heat is transferred from the ocean to the atmosphere when water at                                                                       (extreme phases of a naturally occurring
the ocean’s surface evaporates to become water vapor. This causes the ocean to cool slightly. The heat                                                                   climate cycle) and its associated atmo-
transferred to the atmosphere from the ocean is stored in atmospheric water vapor as latent heat.                                                                        spheric component termed the Southern
                                                                                                                                                                         Oscillation. In addition to the seasonal cycle
      In the lower troposphere, air parcels carry heat energy obtained from the ocean. These air
                                                                                                                                                                         and ENSO, other natural climate variations
parcels spiral inward towards the center of a developing hurricane. Once the air parcels reach                                                                           may influence Atlantic hurricane activity on
a hurricane’s eyewall, they turn upward and rise due to a process called convection. The added                                                                           time scales of a few weeks to a few years.
heat from the ocean causes the air rising in the eyewall to be warmer than the surrounding                                                                               On longer (e.g. multidecadal) time scales,
environment, allowing it to continue to rise.                                                                                                                            there is strong variability in the Atlantic that
      Once the rising air parcels reach the tropopause, the boundary between the                                                                                         affects storm activity.
troposphere and the stratosphere, they begin to spiral outward. As the air par-
cels spiral outward, they lose heat to outer space. At some point far away from
the center of the hurricane, the cooled air parcels begin to sink back towards the
lower troposphere. At this point, this cycle, which is known as the hurricane’s
secondary circulation, is complete.
      Since the conversion of heat energy to mechanical energy drives the hur-
ricane’s secondary circulation, a hurricane can be regarded as a heat engine.
For the engine to continue working, air entering the system (the hurricane)
                                                                                                                                                                                                                        Courtesy of Weather Underground

must be at a higher temperature than that which exits the system. As long as
the air parcels can rise in the eyewall and then spiral outward at the tropopause
faster than other air parcels can spiral inward towards the eyewall in the lower
troposphere, the central pressure in the developing hurricane will fall. A falling
central pressure is one way to measure how much a hurricane is intensifying.
When the central pressure falls, air parcels begin to spiral inward towards the eyewall faster
to fill the vacuum. If the air parcels spiral inward faster, then the maximum wind speed will
increase. Increasing winds boost the transfer of heat from the ocean, creating a positive feedback.

go to www.hurricanescience.org                                                                                                                                                                                        5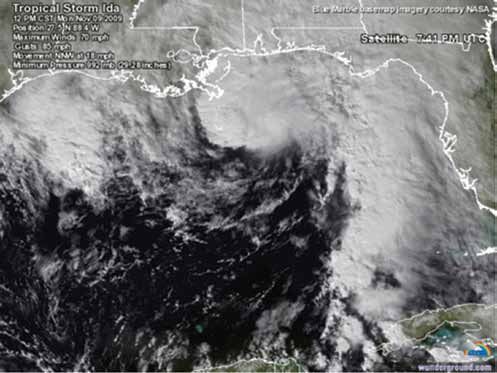
Hurricane Science

                                      A mature hurricane is nearly circular in shape. The winds of a hurricane are very light in the
                                      center of the storm (small blue circle in the image below) but increase rapidly to a maximum
                                      10 –50 km (6 –31 miles) from the center (red) and then fall off slowly toward the outer extent
                                      of the storm (yellow).
                                           The size of a hurricane’s wind field is usually a few hundred miles across, although the
                                      size of the hurricane-force wind field (with wind speed > 117.5 km/h [73 mph]) is typically
                                      much smaller, averaging about 161  km (100 miles) across. The area over which tropical storm-
                                      force winds occur is greater, ranging as far out as almost 500  km (300 miles) from the eye of
                                      a large hurricane.
                                                                                              One of the largest tropical cyclones
                                                                                        ever measured was Typhoon Tip (Northwest
    The strength of a hurricane is   not necessarily related to its size. Pacific Ocean, October 12, 1979), which at
                                                                                        one point had a diameter of about 2100 km
                                                                                        (~1350 miles). One of the smallest tropical
                                                                                        cyclones ever measured was Cyclone Tracy
                                                                                        (Darwin, Australia, December 24, 1974),
                                                                                        which had a wind field of only 60 miles
                                                                                        (~100 km) across at landfall.
                                                                                              In mature hurricanes, strong surface
                                                                                        winds move inward towards the center of
                                                                                        the storm and encircle a column of relatively
                                                                                        calm air. This nearly cloud-free area of light
                                                                                        winds is called the eye of a hurricane and is
                                                                                        generally 20-50 km (12-30 miles) in diam-
                                                                                     Adapted from the UCAR / COMET Program

                                                                                        eter. From the ground, looking up through
                                                                                        the eye, skies may be so clear that you might
                                                                                        see the stars at night or the sun during the
                                                                                        day. Surrounding the eye is a violent, stormy
                                                                                        eyewall, formed as inward-moving, warm
                                                                                        air turns upward into the storm. Usually, the
                                                                                        strongest winds and heaviest precipitation are
                                                                                        found in the eyewall area.
                                           A mature hurricane can be broken down into three main parts: the eye, eyewall, and outer
                                      region. In the Northern Hemisphere, the most destructive section of the storm is usually in the
                                      eyewall area to the right of the eye, known as the right-front quadrant. Based on the direction
                                      of movement of a hurricane during landfall, this section of the storm tends to have higher
                                      winds, causing high seas and storm surge on land.
                                           Outside the eyewall of a hurricane, rainbands spiral inwards towards the eyewall. These
                                      rain bands are capable of producing heavy rain and wind (and occasionally tornadoes). Some-
                                      times, there are gaps between the bands where no rain is found. In fact, if one were to travel
                                      from the outer edge of a hurricane to its center, one would typically experience a progression
                                      from light rain to no rain back to slightly more intense rain many times with each period of
                                      rainfall being more intense and lasting longer until reaching the eye.

6                                                                                                                            For more about hurricanes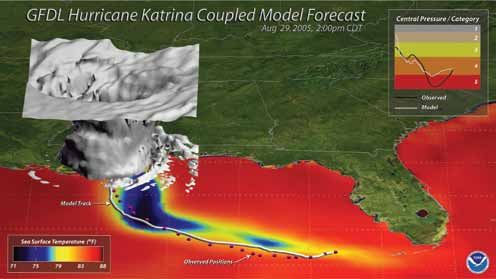
In the tropical oceans, the sea surface temperature (SST) is much warmer than that of
the deeper water below the surface. At an ocean boundary layer called the thermocline, the
transition from warm water to cold water occurs rapidly. Above the thermocline, in the up-
per ocean mixed layer, the water is fairly uniform in temperature and is approximately as
warm as the sea surface. Below the thermocline, the water is also nearly uniform in tem-
perature, but it is colder.
The thickness of the oceanic mixed layer varies in different parts of the tropical
oceans. In most parts of the Gulf of Mexico, for example, the oceanic mixed layer during
the summer and fall is relatively thin and
the thermocline is relatively close to the sea
surface. In the Caribbean Sea, the oceanic Deep, warm water can increase a hurricanes intensity.
mixed layer is relatively thick and so the
thermocline is deeper.
The three-dimensional cartoon of the temperature distribution in the upper
Vertical mixing occurs when a hurri- ocean shown below illustrates the impact of a hurricane passing over the ocean
cane passes over the surface of the ocean. when the oceanic mixed layer is thin like much of the Gulf of Mexico (left) and
The hurricane’s winds create turbulence in thick like the Caribbean Sea (right). In both cases, the hurricane propagates
the ocean, which mixes the surface water down and left over the warm sea surface (red), creating a cold wake behind
with the water below. This mixing brings the storm as colder water (blue) is brought towards the sea surface by the
hurricane’s wind stress. If the oceanic mixed layer is initially thin (left), the cold
the colder water from below the thermo-
wake is colder so the hurricane remains weaker than if the oceanic mixed layer
cline up into the surface layer, thereby is initially thick (right), all else being equal. A hurricane in the Caribbean Sea is
thickening and cooling the surface layer. less likely to be limited by cold water than a hurricane in the Gulf of Mexico.
Since this vertical mixing process happens
within a few hours, it usually cools the sea
surface underneath a hurricane, restricting
evaporation and therefore limiting the heat
National Geographic Magazine
available to the hurricane for intensifica-
tion and maintenance.
Another process that can cool the sea
surface under a hurricane is upwelling.
Rising cold
Winds from the hurricane cause the water water diminishes
in the upper ocean to move away from the a hurricane’s
storm center. Colder water from below then intensity Deep warm
water increases
moves upward towards the sea surface to a hurricane’s
fill the void. Unlike vertical mixing, up- intensity
welling caused by a hurricane usually oc-
curs over a period of a half day or more, so
its contribution to sea surface cooling only
occurs underneath the storm if a storm is
moving slowly
The thicker the oceanic mixed layer is before a hurricane ar-
rives, the less vertical mixing and upwelling can cool the sea surface. In the
image to the right, the combined effects of vertical mixing and upwelling on hurricane
intensity are shown if the oceanic mixed layer is initially thin versus if the oceanic mixed
layer is initially thick.
go to www.hurricanescience.org 7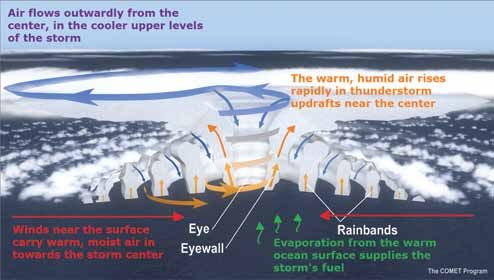
Hurricane Science

                                                          Just as there are many factors that contribute to the birth and survival of a hurricane,
                                                     there are also many causes for a hurricane to weaken and/or die.
                                                          Landfall usually causes a hurricane to quickly decay. Hurricanes require evaporation
                                                     from the warm ocean surface to survive. Once a hurricane makes landfall, it is separated
                                                     from its ocean energy source, and hence, can no longer extract heat from the ocean. Since
                                                     the air masses over land are drier and contain more aerosol particles than over the ocean,
                                                     less moisture is carried into the storm, cloud coverage lessens, and air is cooled and then
                                                     sinks, disrupting the hurricane’s secondary circulation and hindering critical thunderstorm
                                                     development. To a lesser extent, the increased roughness of the land surface also weakens a
                                                     hurricane as increased friction causes a reduction in surface circulation.
                                                                                                               Even if a hurricane remains over the
                                                                                                         ocean, once the storm moves northward (in
                                                                                                         the Northern Hemisphere) out of the tropi-
                                                                                                         cal ocean and into the mid-latitudes, it begins
                                                                                                         to move over colder water, again losing the
                                                                                                         warm water source necessary to drive the
                                                                                                         hurricane. As less moisture is evaporated
                                                                                                         into the atmosphere to supply cloud forma-
                                                                                                         tion, the storm weakens. Sometimes, even
                                                                                                         in the tropical oceans, colder water churned
                                                                                                         up from beneath the sea surface by the hurri-
                                                                                                         cane can cause the hurricane to weaken. Even
                                                                                                         when the ocean conditions are favorable for
                                                                                                         the hurricane to be maintained, a hurricane
                                                                                                         may encounter an area of particularly dry and
                                                                                                         dusty air causing the hurricane to weaken.
                                                                                                               Hurricane decay can also be caused by
                                                                                                         strong vertical wind shear, a change in wind
                                                                                                     Courtesy of wunderground.com

                                                                                                         direction or speed with height. This change in
                                                                                                         wind speed or direction with height can en-
                                                                                                         hance the mixing of drier environmental air
                                                                                                         into the storm eyewall leading to downdrafts,
Satellite image of Tropical Storm Ida (2009),                                                            which inhibit intensification. Fast, upper-tro-
showing the classic signature of a tropical storm    pospheric winds can create very high values of wind shear and can separate cloud tops from
undergoing transition to an extratropical cyclone.   their bases and cause the vertical circulation around a hurricane’s eyewall to tilt. As heat and
There is heavy thunderstorm activity near the
                                                     moisture at upper levels are advected away from the low-level circulation of the hurricane, its
center, but the long band of clouds to the east of
Ida doesn’t look much like a spiral band—it looks    development is inhibited. Midlevel warming within the storm’s center also reduces convective
more like a front.                                   activity and inhibits intensification. Without a strong secondary circulation, a hurricane cannot
                                                     be sustained. The response to vertical shear partially depends on the storm circulation, so the
                                                     response to similar values of vertical shear can vary from storm to storm. Vertical wind shear
                                                     is common in the mid-latitudes, although it can also occur over the tropical oceans where it
                                                     cannot only weaken a hurricane but also help to prevent one from forming in the first place.
                                                          When a hurricane moves into the mid-latitudes, it may be absorbed by a different kind
                                                     of low-pressure weather system called an extratropical cyclone. Extratropical cyclones are
                                                     responsible for much of the sensible weather (such as rain and snow) that people who live in
                                                     the mid-latitudes experience, especially during the winter months.

8                                                                                                                                   For more about hurricanes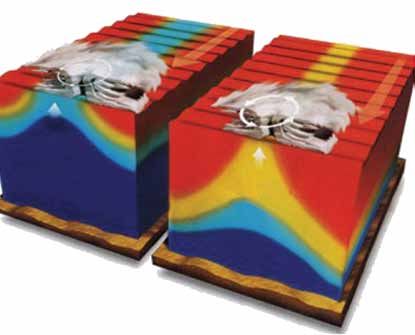
Long-term variations in hurricane activity due to climate change are distinct from
short-term year-to-year variations in hurricane activity or changes in hurricane activity dur-
ing a given hurricane season. Climate change may affect hurricane intensity, frequency,
track, size, and/or rainfall. As the global climate warms, the sea surface temperature also
increases in the tropical oceans where hurricanes form. In theory, hurricanes may then
become more intense or better able to survive at a high intensity for longer periods of time.
Current models project a 6 to 34% decrease in the global frequency of tropical
cyclones by the late 21st century; but in individual ocean basins, these models project that
the frequency may either increase or decrease by a substantial percentage. Scientists have a
low confidence in current model projected changes to tropi-
cal storm activity in individual ocean basins. There is some
agreement among hurricane climate scientists that it is like-
ly for the global frequency of tropical cyclones to either
decrease or remain essentially unchanged in response to
21st century climate warming.
A recent assessment concluded that with projected
climate warming “an increase in the mean maximum wind
speed of tropical cyclones is likely (+2 to +11% globally)”
(Knutson et al., 2010). However, this may not occur in all
ocean basins. “The frequency of the most intense storms
will more likely than not increase by a substantially larger
Bender et al. 2010, Science, 327, 454–458. doi: 10.1126/science.1180568
percentage in some basins” (Knutson et al., 2010).
It is important to note, however, that owing to dif-
ficulties in measuring hurricanes, separating the effects
of anthropogenically-influenced climate change from the
natural variability of hurricane activity is very difficult. At
present, it remains uncertain whether past changes in hur-
ricane activity have exceeded the variability from natural
causes.
Another concern is the complication of sea level rise
due to climatic warming, as increasing ocean tempera-
tures and increased melt water from melting glaciers and
ice sheets cause the ocean to expand. Higher sea levels
mean that storm surges and waves ride on a higher base
level, causing storm surge impacts such as coastal ero-
sion—even from minor storms—to increase, possibly dra-
matically. Low-lying coastal ecosystems are greatly threatened by continued sea level rise
and increased risk from extreme weather events. Increased hurricane rainfall rates and
storm surge levels would increase the risk of inland flood damage and coastal flood dam-
age, respectively, in areas affected by landfalling hurricanes.
Consensus statements on the potential link between hurricanes and climate change
can be found within the Intergovernmental Panel on Climate Change Fourth Assessment
Report* and in a recent assessment produced by a World Meteorological Organization ex-
pert team on climate change impacts on tropical cyclones.†
*IPCC Fourth Assessment Report; http://www.ipcc.ch/publications_and_data/ar4/syr/en/contents.html
†
Knutson et al., 2010; http://www.nature.com/ngeo/journal/v3/n3/abs/ngeo779.html
go to www.hurricanescience.org 9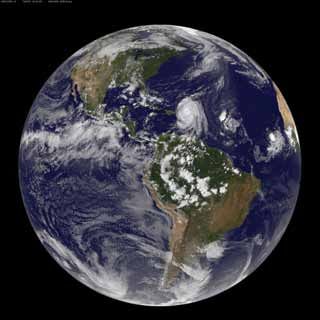
Hurricane
       Forecasting
                 Forecasts,
                   and Modeling
                            Observations, and Models

     Hurricane forecasting requires a coordinated effort that involves five main components:
     hurricane observations, hurricane forecast models, operational hurricane forecasts and
     warnings, dissemination to the public, and public response.
          Before forecasters can predict a hurricane’s track or intensity, they need to gather as
     much data as possible on that storm and the current state of the atmosphere and the ocean.
     Satellite imagery and airplane reconnaissance are considered to be the primary platforms for
     hurricane observation, but critical measurements are also taken at sea by buoys and ships,
     and over land by radar and radiosondes.
          Observations from satellites, reconnaissance aircraft, ships, buoys, radar, and other
     land-based platforms are the basis for all forecast and warning products issued by U.S. Na-
     tional Oceanic and Space Administration’s (NOAA) National Hurricane Center (NHC) and
     other worldwide hurricane forecast centers. These observations are checked for quality, an-
     alyzed, and fed into a suite of computer models. Results from the hurricane forecast models
     are interpreted and used as guidance for the appropriate forecast centers and local weather
     offices to help them issue official hurricane forecasts and warnings. The timely and reliable
     distribution of these forecast and warning products allows members of the public and their
     local emergency managers to make appropriate plans in the days and hours prior to a hurri-
     cane landfall.

                                                                                                     Air Force Photo/ Tech. Sgt. James Pritchett
                                                   NOAA NWS
                                                  NASA / NOAA

                                                                                                       NOAA

10                                                                    For more about hurricanes
The National Hurricane Center (NHC), in coordination with one or more National
Weather Service (NWS) Weather Forecast Offices (WFOs), issues a hurricane watch for
specific coastal areas when hurricane force winds (sustained winds of 119.1 km/h [74
mph] or higher) are possible within 48 hours. This hurricane watch is upgraded to a hur-
ricane warning when hurricane force winds
are expected within 36 hours or less. A hur-
The National Hurricane Center forecast cone represents the
ricane warning can remain in effect when
dangerously high water or a combination of
probable track of the center of a tropical cyclone.
dangerously high water and exceptionally
high waves continue, even though winds may be less than hurricane force. If only tropical
storm force winds are expected (sustained winds of 62.8- 117.5 km/h [39-73 mph]), then
a tropical storm watch or tropical storm warning will be issued for that area.
In addition to watches and warnings, the NHC issues a variety of text and graphical
products designed to inform the public of forecasted hurricane threats. A complete de-
scription of all of these products can be found in the National Hurricane Center Product
Description Document: A User’s Guide to Hurricane Products.
Once hurricane season begins, it is important for anyone at risk of being impacted by
This image shows the Tropical Cyclone
a hurricane to pay attention to these local weather updates and advisories on the television Track Forecast Cone and Watch/Warning
National Hurricane Center Forecast Graphic
and radio as well as to view the NHC products available online (www.nhc.noaa.gov). Graphic for Hurricane Ike (2008). This
graphic depicts the NHC forecast track
for the center of a hurricane along with
an approximate representation of asso-
ciated coastal areas under a hurricane
warning (red), hurricane watch (pink),
tropical storm warning (blue), and tropical
storm watch (yellow). The orange circle in-
dicates the current position of the center of
the tropical cyclone. The black dots show
the NHC forecast position of the storm
center at the times indicated. The letter in-
side the dot indicates the forecast strength
of the cyclone category: (D)epression,
(S)torm, (H)urricane, (M)ajor hurricane, or
remnant (L)ow. Systems forecast to be ex-
tratropical are indicated by white dots (with
black letters indicating intensity). The cone
represents the probable track of the cen-
ter of a tropical cyclone, and is formed by
enclosing the area covered by a set of cir-
cles (not shown) along the forecast track
(at 12, 24, 36 hours, etc). The size of each
circle is set so that two-thirds of historical
official forecast errors over a 5-year sam-
ple fall within the circle.
Courtesy of NOAA NHC
go to www.hurricanescience.org 11Hurricane
Forecasting
Forecasts,
and Modeling
Observations, and Models
Hurricane forecast models use obser-
vational data to describe the current state
of the atmosphere and then solve the mod-
el’s mathematical equations to produce one
or more forecasts. While hurricane forecast
models vary tremendously in their structure
and complexity, they can be separated into
a few broad categories. Dynamical models
use supercomputers to solve the mathemat-
ical equations governing the physics and
NOAA Geophysical Fluid Dynamics Laboratory
motion of the atmosphere. Statistical mod-
els are based on historical relationships
between hurricane-specific information
and the behavior of historical hurricanes.
Statistical-dynamical models blend both
dynamical and statistical techniques by
making a forecast based on established
The National Hurricane Center (NHC) historical relationships between storm behavior and atmospheric variables provided by
assigns a number to each new tropical dynamical models. Trajectory models move a hurricane along a forecasted track based on
Naming Hurricanes
depression that forms in the Atlantic the large-scale environmental wind field obtained from a separate dynamical model. En-
basin. This number depends on how
semble models (above left) use multiple forecasts created with different models, different
many other tropical cyclones have formed
so far during that hurricane season in physical parameterizations, or varying model initial conditions to create a single ensemble
that ocean basin. For example, Hurricane forecast. Finally, numerical models of storm surge, waves, and coastal flooding are used
Frances in 2004 was originally classified to forecast hurricane impacts at landfall instead of hurricane track and intensity.
as Tropical Depression Six because it was The NHC evaluates hurricane forecast model accuracy every year by evaluating fore-
the sixth tropical cyclone to form in the cast errors. Track
Atlantic Basin during the 2004 hurricane
season. Once a system is classified as a
forecast errors are
tropical storm, it is given a name by the defined as the dif-
NHC. Starting in the early 1950’s, six ference between the
separate lists of alphabetical storm names predicted and actu-
were developed. Each list is recycled al positions of the
every six years, although storm names
storm center at a giv-
that have resulted in substantial damage
or death (e.g. Ike, Katrina, Andrew, Betsy) en lead time (e.g. 24
are retired. As of the end of the 2009 hours in advance).
Atlantic hurricane season, seventy-three To the right is a
storm names have been retired in the graph showing the
Atlantic Basin. average 48-hour At-
lantic Basin tropical
Courtesy of NOAA NHC
storm and hurricane
track errors from
various models for
the period from 1970 to 2007. Each dot color represents a specific model. During this peri-
od, model track error decreased significantly, which was largely responsible for improved
official track forecasts made at NHC. In contrast, forecast model intensity and NHC offi-
cial hurricane intensity accuracy has not shown significant improvement over time.
12 For more about hurricanesEvery year, improvements are made to the hurricane forecast models, and large ef-
forts are currently ongoing to research ways to improve dynamical hurricane mod-
el forecasts: increasing model resolution, improving representation of modeled physical
processes both within the atmosphere and
at the air-sea interface where the hurricane
interacts with ocean, verifying model out-
Hurricane forecast models have improved significantly.
put with observations of atmospheric vari-
ables, and improving data assimilation techniques within the model. These efforts should
prove particularly useful for the complicated problem of predicting hurricane intensity,
which unlike track forecasting involves horizontal scales both larger than a hurricane and
smaller than a raindrop.
Hurricane History
The deadliest tropical cyclone in world his-
tory is the Great Bhola Cyclone, which struck
Bangladesh in 1970 and caused approximate-
ly 500,000 fatalities. More recently, Cyclone
Nargis, which made landfall in Myanmar in
2008, caused catastrophic destruction and at
least 138,000 fatalities. The Galveston Hurri-
cane of 1900 was responsible for over 6,000
deaths and still remains to be the deadliest
hurricane to strike the United States. When
Atlantic hurricanes have caused extensive
devastation, their names have been retired,
never to be used again by the National Hur-
ricane Center.
Many tropical cyclones have left im-
portant marks on regional and global his-
tory. The Great Bhola Hurricane is actually
NOAA NHC
linked to the creation of the state of Ban-
gledesh, and the Hakata Bay Typhoon wiped
out the Mongol fleet during their second and final attempt at invading Japan in 1281. In All North Atlantic (1851–2008) and Eastern North
1609, a fleet of ships carrying settlers from England to Virginia was struck by a hurricane Pacific (1949–2008) hurricanes. Major hurricanes
and some of these settlers became Bermuda’s first inhabitants as they found refuge on the (at least Category 3 on the Saffir-Simpson
Hurricane Scale) are in yellow. Category 1 and 2
island after the storm (their stories also helped inspire Shakespeare’s The Tempest). hurricanes are in red. Dashed lines are remnant
An average of about 2 major hurricanes every 3 years made landfall somewhere along the lows, extratropical and waves.
U.S. Gulf or Atlantic coast. The 2005 hurricane season set the record for the most U.S. major
hurricane strikes since 1851 and tied for second-most hurricane strikes. When looking at his-
torical storms that have occurred in the Atlantic ocean basin from 1851 to 2006: one-third of
the deadliest hurricanes were category four or higher, and fourteen out of the fifteen deadliest
hurricanes were category 3 or higher. Also, large death totals were primarily a result of storm
surge (10 ft or greater) associated with many of these major hurricanes, and a large portion of
the damage in four of the twenty costliest tropical cyclones resulted from inland floods caused
by torrential rain.
go to www.hurricanescience.org 13Hurricane
HurricaneImpacts,
Impacts,Preparation,
Preparation,and
andMitigation
Mitigation
Hurricanes are among the most powerful natural hazards known to humankind. During a
hurricane, residential, commercial, and public buildings, as well as critical infrastructure
such as transportation, water, energy, and communication systems may be damaged or de-
stroyed by several of the impacts associated with hurricanes. Wind and water are the twin
perilous agents of devastation associated
Inland flooding and storm surge are responsible for most of the deaths with hurricanes, and both can be tremen-
dously destructive and deadly.
from tropical cyclones in the U.S. When a hurricane makes landfall, the
sheer force of hurricane strength winds can
destroy buildings, topple trees, bring down power lines, and blow vehicles off roads. When
flying debris, such as signs, roofing material, building siding, and small items left outside are
added to the mix, the potential for building damage is even greater.
The coastal flooding triggered by hurri-
canes is as destructive as the high winds, but
can be even more deadly, and it is by far the
greatest threat to life and property along the
coastline. Storm surge, waves, and tides are
the greatest contributors to coastal flood-
ing, while precipitation and river flow also
contribute to damage during some storms.
Storm surge is the pulse of water that wash-
es onto shore during a storm, measured as
the difference between the height of the
Courtesy of NOAA
storm tide and the predicted astronomical
tide. It is driven by wind and the inverse
barometric effect of low atmospheric pres-
Hurricanes vs. Tornadoes sure, and is influenced by waves, tides, and
uneven bathymetric and topographic sur-
faces.
Response Team at NASA GSFC
In addition to high winds and storm
Courtesy of MODIS Rapid
Justin Hobson, 2007
surge, hurricanes threaten coastal areas with
their heavy rains. All tropical cyclones can
produce widespread torrential rains, which
Hurricanes Tornadoes cause massive flooding and trigger land-
Where they form Hurricanes form over warm Tornadoes form over land and slides and debris flows. Flash flooding, a
water in the tropical oceans form within storms that are often rapid rise in water levels, can occur quickly
and develop best when far very close to the jet stream.
from the jet stream.
due to intense rainfall over a relatively short
How big they are Can be several hundred miles Usually no more than ¼ mile wide
period of time. In 2001, Tropical Storm Alli-
across son brought rain to the Texas and Louisiana
How long they last Can last up to 3 weeks Usually lasts no more than 1 hour coasts for nearly 6 days. Thirty-seven inch-
How strong the winds are Usually less than 290 km/hr The most severe ones can be up to es of rain fell in the port of Houston, TX,
(180 mph) 480 km/hr (300mph) and nearly 30 inches inundated Thibodaux,
Occurrence per year An average of 10 tropical In the United States, 800 –1,000 LA. Tropical Storm Allison was actually the
storms in the Atlantic Ocean most costly tropical storm in U.S. history
Advance warning Several days Usually no more than 15 –30 with more than $5 billion in flood damage
from forecasters minutes to southeast Texas and southern Louisiana.
14 For more about hurricanesSome of the world’s most deadly natural disasters have been tropical weather events
including the Great Bhola Cyclone of 1970, which struck Bangladesh and killed as many
as 500,000 people (primarily as a result of storm surge), and Cyclone Nargis, which made
landfall in Myanmar in 2008, causing catastrophic destruction and at least 138,000 fatali-
ties. The most deadly U.S. hurricane was the 1900 Galveston Hurricane that killed more
than 6,000 people and recently hurricane
Katrina killed more than 1,800 people in
Louisiana and Mississippi.
Preparation can protect you and your home from damage in a hurricane.
The greatest threat to personal safety
exists during a storm and in the immediate aftermath when high winds can topple trees
and cause flying debris. Heavy rain can produce flash floods and storm surge can present
another deadly threat.
The most critical step in preparing
for a hurricane is to understand the risk
in terms of property damage and threat of
personal injury. The key hazards from hur-
ricanes come from wind and flooding, due
to storm surge or intense rainfall. Important
questions to ask about one’s home include:
Is a home at risk of flooding due to storm
surge or intense rainfall? Is the home in an
evacuation zone? If so, to where should
homeowners evacuate? Most people only
need to evacuate a few miles from the coast
to avoid the dangers of storm surge. Does a
home have proper insurance coverage for
both wind and flood losses? Taking time
to answer these critical questions before
Courtesy of FEMA
hurricane season is essential. FEMA has
published almost 100,000 individual Flood
Insurance Rate Maps (FIRMs*) to enable individuals to make informed decisions about
protecting property.
The science of hurricane protection has evolved significantly over the past decade,
fueled by the intensely destructive decade of hurricane activity, 1996 to 2005, that was one
of the most destructive decades in the last century with a total economic hurricane damage
of $198 billion. Applied scientific research is taking place on multiple fronts to give engi-
neers, inventors, and entrepreneurs new data with which to develop the next generation of
hurricane protection products.
Another factor driving the advancement of hurricane protection technologies was
the development of the 2000 International Residential and Commercial Building Codes,
which, for the first time, required the use of impact-resistant windows, doors and other
components for homes built in hurricane-prone areas. Subsequent editions of the Interna-
tional Building Codes are adopted every 3 years.
Regardless of the advances in home protection, making smart, informed decisions is
the best way to ensure safety during a tropical cyclone.
*http://www.fema.gov/hazard/map/firm.shtm
go to www.hurricanescience.org 15Hurricanes: Science and Society
Internet Resources
Hurricanes: Science and Society (www.hurricanescience.org) is one of the
most comprehensive Internet resources on hurricanes. In addition to in-
depth content on hurricane science, forecasting, and preparation, there are
educational resources, case studies, and a historical storm interactive.
The Interactive Hurricane History Timeline contains summaries and images
of significant storms throughout history, from the Hakata Bay Typhoon in
1281 to Hurricane Rick in 2009. There are also decadal summaries as well as
storm totals for the North Atlantic for the last 100 years.
www.hurricanescience.org
The Basic Science section provides foundational science on key concepts
in meteorology and oceanography that are important for understanding
hurricanes.
The Teacher Resources section contains classroom activities developed by
K–12 educators along with a list of select classroom resources. There is also
a list of links to image and data sources for hurricanes.
The Student Resources section contains features designed for students.
PowerPoint presentations for classroom use are available on the website.
Courtesy of NOAA NHC
Print Resources
This booklet and other printable material are available on the website as PDF
documents.
ES
GO
A
AS
N
A/
OA
ofN
sy
rte
Cou
www.hurricanescience.org
Graduate School of Oceanography
University of Rhode Island
University of Rhode Island THE
GSO
Graduate School
UNIVERSITY
of Oceanography
OF RHODE ISLANDYou can also read