2020 Atlantic Hurricane Season: A record-breaking season - JRC Publications Repository
←
→
Page content transcription
If your browser does not render page correctly, please read the page content below
2020 - Atlantic Hurricane Season:
A record-breaking season

                      Pamela Probst
                      Alessandro Annunziato
                      Chiara Proietti
                      Stefano Paris

                      2021

                                              EUR 30635 EN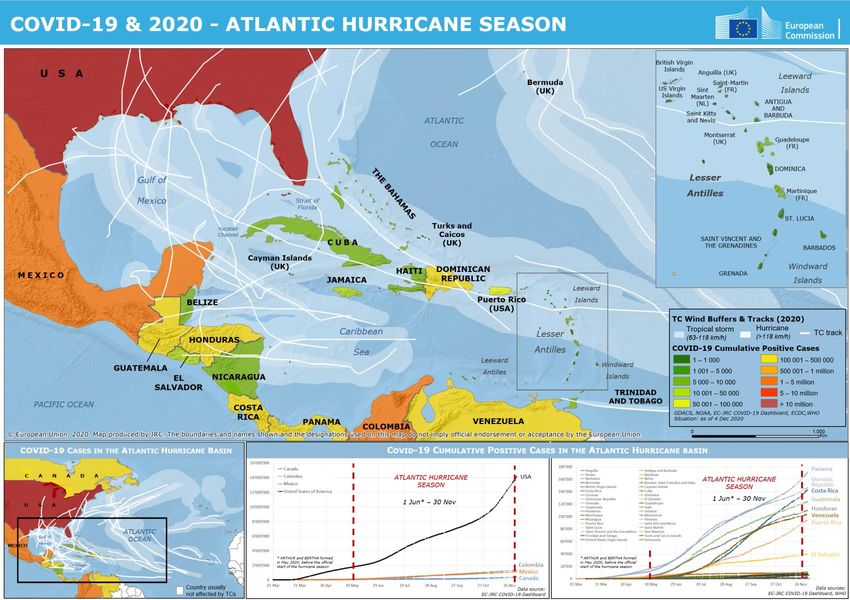
This publication is a Technical report by the Joint Research Centre (JRC), the European Commission’s science and knowledge service. It aims
to provide evidence-based scientific support to the European policymaking process. The scientific output expressed does not imply a policy
position of the European Commission. Neither the European Commission nor any person acting on behalf of the Commission is responsible
for the use that might be made of this publication. For information on the methodology and quality underlying the data used in this
publication for which the source is neither Eurostat nor other Commission services, users should contact the referenced source. The
designations employed and the presentation of material on the maps do not imply the expression of any opinion whatsoever on the part of
the European Union concerning the legal status of any country, territory, city or area or of its authorities, or concerning the delimitation of
its frontiers or boundaries.

EU Science Hub
https://ec.europa.eu/jrc

JRC123932

EUR 30635 EN

   PDF           ISBN 978-92-76-32177-4                ISSN 1831-9424             doi:10.2760/00114

Luxembourg: Publications Office of the European Union, 2021

© European Union, 2021

The reuse policy of the European Commission is implemented by the Commission Decision 2011/833/EU of 12 December 2011 on the
reuse of Commission documents (OJ L 330, 14.12.2011, p. 39). Except otherwise noted, the reuse of this document is authorised under the
Creative Commons Attribution 4.0 International (CC BY 4.0) licence (https://creativecommons.org/licenses/by/4.0/). This means that reuse
is allowed provided appropriate credit is given and any changes are indicated. For any use or reproduction of photos or other material that
is not owned by the EU, permission must be sought directly from the copyright holders.

All content © European Union, 2021

How to cite this report: Probst, P., Annunziato, A., Proietti, C., Paris, S. 2020 – Atlantic Hurricane Season: A record-breaking season, EUR
30635 EN, Publications Office of the European Union, Luxembourg, 2021, ISBN 978-92-76-32177-4, doi:10.2760/00114, JRC123932.

Authors affiliations:
Pamela Probst, European Commission, Joint Research Centre (JRC), Ispra, Italy
Alessandro Annunziato, European Commission, Joint Research Centre (JRC), Ispra, Italy
Chiara Proietti, European Commission, Joint Research Centre (JRC), Ispra, Italy
Stefano Paris, FINCONS service provider of European Commission, Joint Research Centre (JRC), Vimercate, Italy
Contents

Acknowledgements ....................................................................................................................................4
Abstract ....................................................................................................................................................5
1 Introduction .........................................................................................................................................6
2 2020 Atlantic hurricane season ..............................................................................................................9
    2.1 Overview: Impact, frequency and GDACS alerts ...............................................................................9
    2.2 Comparisons with past events: 2005 & 2016-2020 .........................................................................13
    2.3 Relevant past events ...................................................................................................................16
3 Hurricanes & COVID-19 .......................................................................................................................18
4 Hurricanes & La Niña ...........................................................................................................................19
    4.1 ENSO (El Niño-Southern Oscillation): El Niño and La Niña ...............................................................19
    4.2 ENSO situation & forecast ............................................................................................................20
5 Hurricanes & Climate change ...............................................................................................................21
6 Conclusions ........................................................................................................................................22
References ..............................................................................................................................................23
List of abbreviations and definitions ..........................................................................................................26
List of figures ...........................................................................................................................................27
List of tables ............................................................................................................................................28
List of boxes.............................................................................................................................................29
Annexes ..................................................................................................................................................30
    Annex 1. Detailed maps .......................................................................................................................30
    Annex 2. GDACS TC Alerts ....................................................................................................................32
    Annex 3. TCs Classification ...................................................................................................................33

                                                                              3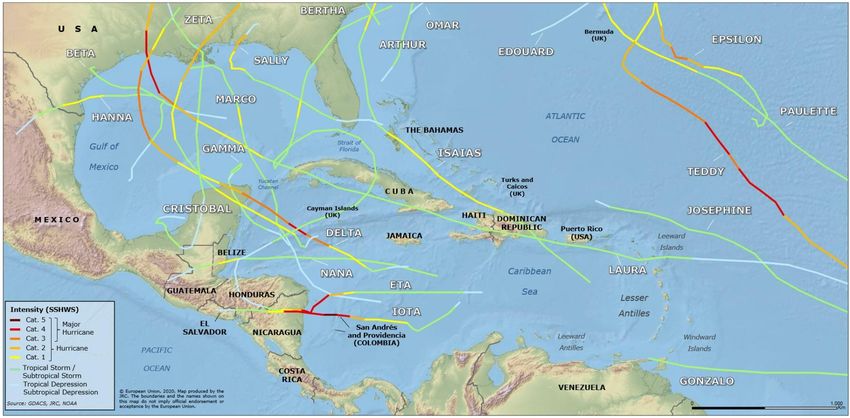
Acknowledgements
Daniele Brusa, Tom De Groeve, Luca Giustolisi, Jurgena Kamberaj, Marco Mastronunzio, Valerio Salvitti,
Michele Tucci.

                                                      4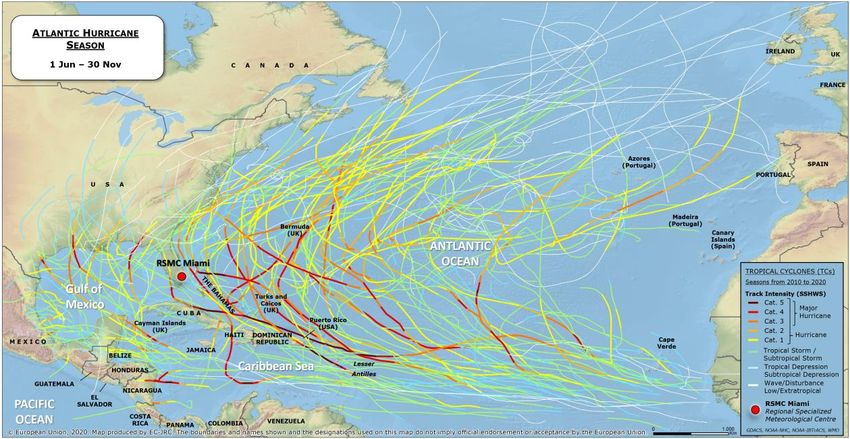
Abstract
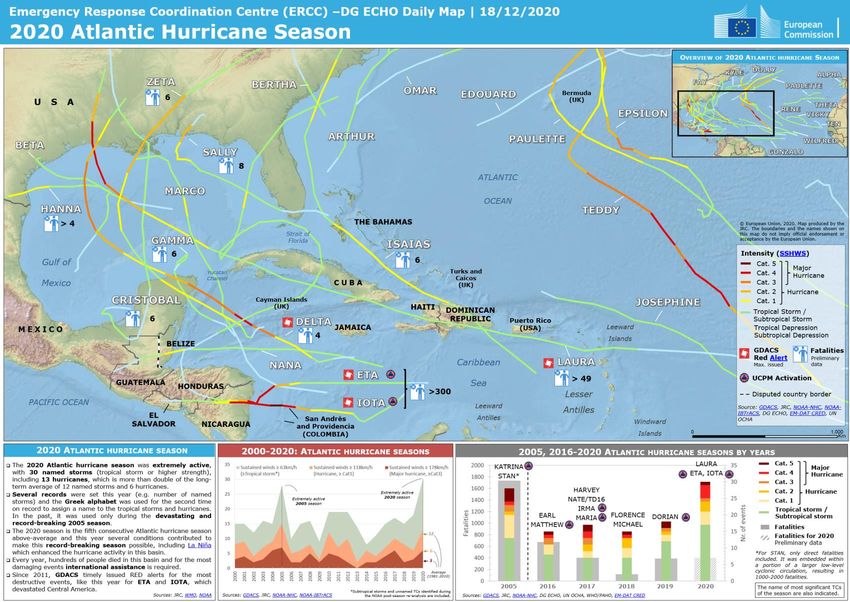
The 2020 Atlantic hurricane season was extremely active, with 30 “named storms” (tropical storm or higher
strength), including 13 hurricanes, which is more than double the long-term average of 12 named storms and 6
hurricanes. Several records were set (e.g. number of named storms) and the Greek alphabet was used for the
second time on record (in the past only in 2005) to assign a name to the tropical storms and hurricanes.
The Atlantic hurricane season (North Atlantic Ocean, Caribbean Sea and Gulf of Mexico) officially starts on 1 June
and ends on 30 November, with the highest activity from August to late October. However, in 2020, two tropical
storms formed in May, before the start of the season, and the last month of the season was particularly active
with two major hurricanes: ETA and IOTA.
The 2020 season is the fifth consecutive Atlantic hurricane season above-average and several conditions
contributed to make the 2020 record-breaking season possible, including La Niña which developed during the
peak of the hurricane season and enhanced the hurricane activity in this basin.
Every year the tropical cyclones (TCs) affect millions of people around the world, including several vulnerable
islands of the Caribbean area and Central America, leaving a trail of destruction that requires the international
assistance of the humanitarian community. In this report, the 2016-2020 Atlantic hurricane seasons and the
extremely active 2005 season have been analysed, considering the impact on the affected areas and the
international humanitarian support. Moreover, in 2020, the COVID-19 pandemic emergency influenced the TCs
preparedness and response activities, creating a multi-risk scenario and increasing the vulnerability.
Since 2011, the Global Disasters Alerts and Coordination System (GDACS) estimates the impact of all the TCs
occurring worldwide and timely issued RED alerts for the most destructive events, like for ETA and IOTA in 2020,
which devastated Central America.
5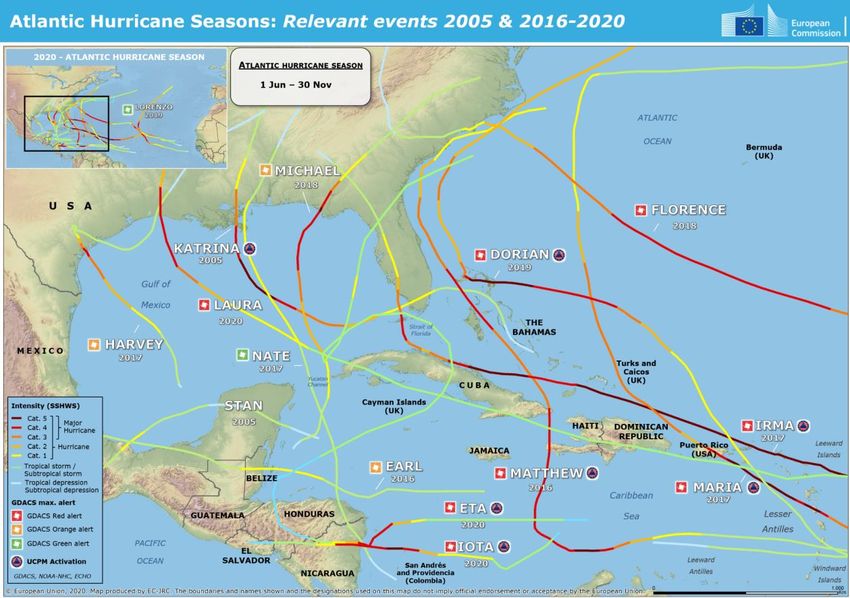
1      Introduction
The official hurricane season in the Atlantic Basin (North Atlantic Ocean, Caribbean Sea and Gulf of Mexico)
officially starts on 1 June and ends on 30 November1 and the highest activity is from mid-August to late October.
On average, 12 “named storms” (tropical storms or higher strength, see Annex 3) occur each season, with an
average of 6 becoming hurricanes and 3 major hurricanes2.
The official Tropical Cyclone3 (TC) Regional Specialized Meteorological Centre (RSMC) of this basin is the RSMC
Miami - NOAA National Hurricane Center (NOAA-NHC, https://www.nhc.noaa.gov/).
The TCs over the period 2010-2020 of this basin can be found in Fig. 1, while more information in the previous
JRC reports (see References) and on the World Meteorological Organization (WMO) websites 4.

The 2020 Atlantic hurricane season had:                                                                      Tropical Storm                Hurricane/
                                                                            Basin                              or stronger              Typhoon/Cyclone
❏ 30 Named storms (Vmax6 ≥ 63 km/h)                                                                         (Vmax≥63km/h)               (Vmax≥119km/h)

❏ 13 Hurricanes (Vmax ≥ 119 km/h)                                           NW Pacific                                       26.0                        16.5
                                                                            NE/Central Pacific                               16.6                          8.9
which is significantly above the normal activity.                           Atlantic                                         12.1                          6.4
The official NOAA’s 2020 Atlantic hurricane                                 Aus SW Pacific                                     9.9                         5.2
season Outlooks, as well as the other seasonal                              SW Indian                                          9.3                         5.0
forecasts of other agencies published before the                            Aus SE Indian                                      7.5                         3.6
start of the season, correctly predicted this                               N Indian                                           4.8                         1.5
extremely active season.                                                           Table 1 - Average TC number by basin (source: NOAA)5.

In particular, the number of systems that reached at least tropical/subtropical storms strength in 2020 is above
the 2005 record of 28 and even above the average number of all the other TCs basins (see Tab. 1).

                            Figure 1 - All TCs in the Atlantic basin (2010-2020, data sources: GDACS, NOAA).

1 TCs could form also outside the “official season” (e.g. Hurricane Alex formed in January in 2016, ARTHUR and BERTHA in May in 2020).
2 Hurricanes reaching Category 3 and higher are considered major hurricanes, due to their potential significant impact.
3 Tropical Cyclone (TC) is a generic term used to describe “a warm-core non-frontal synoptic-scale cyclone, originating over tropical or subtropical waters, with

       organized deep convection and a closed surface wind circulation about a well-defined center” (see NOAA and see Annex 3).
4 WMO Tropical Cyclone Programme website (https://www.wmo.int/pages/prog/www/tcp/index_en.html), at https://severeweather.wmo.int/ and in the WMO

       Global Guide to Tropical Cyclone Forecast (https://public.wmo.int/en/resources/library/global-guide-tropical-cyclone-forecasting)
5 Based on data from 1981-2010 (1981/82 to 2010/2011 for the Southern Hemisphere). The values are based on data supplied by the WMO Regional

       Meteorological Center responsible for tropical cyclone forecasting for that particular basin (source: NOAA https://www.aoml.noaa.gov/hrd-faq/#records-
       and-rankings)
6 Vmax = 1-min sustained winds (see WMO guidelines for converting between various wind averaging periods in TC conditions, WMO/TD-No. 1555

       https://library.wmo.int/doc_num.php?explnum_id=290)

                                                                               6
The extremely active 2005 Atlantic hurricane season had 28 “storms” (27 tropical storms and one subtropical
storm) with 15 hurricanes (including 7 major hurricanes), breaking the old record of 217set in 1933 (data available
since 1851). Only for the 2005 and 2020 seasons, the Greek alphabet has been introduced, since the
predetermined list of names includes only 21 names (see WMO8, NOAA9).
The 2020 season is the fifth consecutive Atlantic hurricane season above-average, while the 2015 season was
below-average, also due to strong El Niño conditions, which reduced the number of TCs in this basin. Instead, in
2020, La Niña developed in the Tropical Pacific in Aug-Sep (peak of the Atlantic hurricane season: Aug-Oct) and
affected the climate and weather patterns around the world, including the hurricane activity in the Caribbean:
when La Niña is sufficiently strong it could enhance the hurricane activity in the Atlantic basin, conversely El Niño
could reduce it in this basin (different behaviour in the other TC basins, see NOAA 10).

    Figure 2 - Atlantic hurricane seasons (2000-2020) distinguished by named storm (Vmax ≥ 63 km/h, *sub/tropical storm or
     higher strength, including unnamed TCs identified during the postseason re-analysis), hurricane (Vmax ≥ 119 km/h) and
                                 major hurricane (Vmax ≥ 178 km/h). Data sources: GDACS, NOAA.

Every year, TCs affect millions of people around the world, including several vulnerable islands of the Caribbean
area and Central America (see Fig. 1), causing fatalities and damage that requires international assistance, like in
2020 with hurricanes ETA and IOTA.
In addition, in 2020 the COVID-19 pandemic emergency had an effect also on the hurricane preparedness and
response activities, creating a multi-risk situation (COVID-19 & TCs) and increasing the vulnerability.
Given this situation, an Early Warnings System able to estimate the correct impact of TCs well in advance is
therefore essential, also considering the potential effects of climate change (see UN11 and WMO12).
The Global Disasters Alerts and Coordination System (GDACS, see Annex 2), which is a cooperation framework
between the United Nation13 and the European Commission14, provides the impact estimation of several
different natural hazards, including all TCs occurring worldwide since 2011. GDACS partners join their own
specific tools to provide different services within one single system, providing real-time access to web-based
disaster information systems and related coordination tools, facilitating information exchange among all
different actors. In particular, the Joint Research Centre (JRC) of the European Commission (EC) is responsible
of the development of the GDACS multi-hazards impact estimation.
During the 2020 Atlantic hurricane season, GDACS timely issued RED alerts for the two most destructive events,
hurricanes ETA and IOTA, which devastated Central America.

7 This number was reduced to 20 after the NOAA re-analysis: https://www.nhc.noaa.gov/news/20120507_pa_reanalysis1935.pdf
8 WMO: https://public.wmo.int/en/media/news/2020-hurricane-season-exhausts-regular-list-of-
names#:~:text=The%20use%20of%20the%20Greek,whose%20names%20were%20all%20retired
9 NOAA: https://www.noaa.gov/news/2020-atlantic-hurricane-season-takes-infamous-top-spot-for-busiest-on-record and

https://public.wmo.int/en/media/press-release/wmo-hurricane-committee-retires-tropical-cyclone-names-and-ends-use-of-greek
10 NOAA: https://www.climate.gov/news-features/blogs/enso/impacts-el-ni%C3%B1o-and-la-ni%C3%B1a-hurricane-season
11 UN: https://www.un.org/sg/en/content/sg/statement/2020-12-02/secretary-generals-address-columbia-university-the-state-of-the-planet-scroll-down-for-

       language-versions
12 WMO: https://library.wmo.int/index.php?lvl=notice_display&id=21804#.X8kDMs1KiUk
13 United Nations (UN) Office for the Coordination of Humanitarian Affairs (UN OCHA) and the UN Institute for Training and Research – Division for Satellite

        Analysis and Applied Research (UNITAR-UNOSAT).
14 Joint Research Centre (JRC).

                                                                             7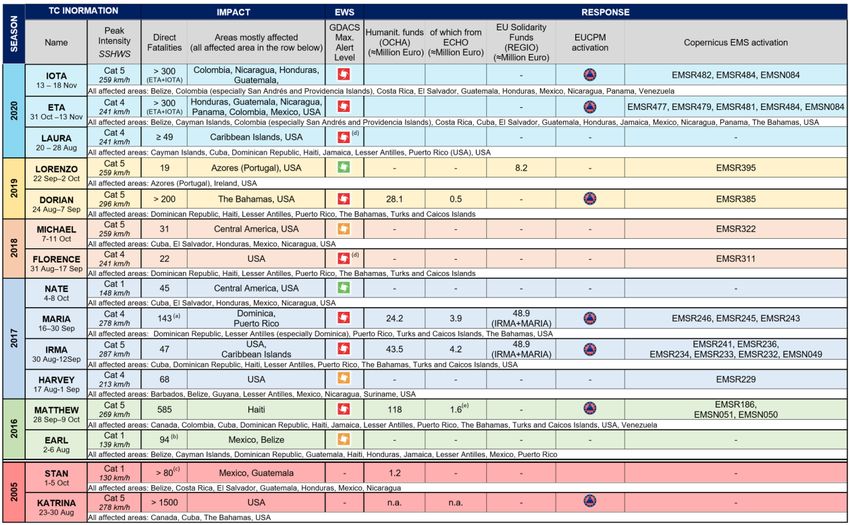
In this context, the JRC has provided a dedicated science-based support to the Emergency Response Coordination
Centre (ERCC) of the Directorate General for European Civil Protection and Humanitarian Aid Operations (DG
ECHO) for more than 15 years, following all emergencies with various activities (e.g. GDACS, Copernicus
Emergency Management Service, maps and reports).
In particular, the JRC has prepared detailed reports before the start of the TC seasons (see list below). These
reports include background information, detailed analyses of the previous seasons, considering scientific
information, impact on the affected areas (in terms of fatalities and economic losses) and the international
humanitarian support (OCHA funding, EUCPM activation, EU Solidarity Funds), as well as the seasonal forecasts
for the new season. They provide clear and simple information on the past and current situation in the specific
TC basin and the possible evolution over the next few months, as well as all the references to the official and
authoritative products. These reports could support the humanitarian communities during the preparedness
activities before the start of the seasons and as a “lesson learnt” after the end of the season. Here below the list
of this type of JRC reports, while all the other reports and maps are available in GDACS15 and on the ERCC portal16:
 ❏ 2018 - Caribbean: Past events, current situation and seasonal forecast:
   https://www.gdacs.org/Public/download.aspx?type=DC&id=155
 ❏ 2018 - NW Pacific Typhoons: Past events, current situation and seasonal forecast:
   https://www.gdacs.org/Public/download.aspx?type=DC&id=154
 ❏ 2018 - South Pacific Tropical Cyclones: Past events, current situation and seasonal forecast:
   https://www.gdacs.org/Public/download.aspx?type=DC&id=156
 ❏ 2018 - South West Indian Ocean Tropical Cyclones: Past events, current situation and seasonal forecast:
   https://www.gdacs.org/Public/download.aspx?type=DC&id=161
 ❏ 2020 - Atlantic Hurricane Season: Past events, current situation, seasonal forecast and COVID-19 situation:
   https://publications.jrc.ec.europa.eu/repository/bitstream/JRC121004/jrc_technical_report_2020_atlanti
   c_hurricane_season.pdf

For the Atlantic hurricane basin, as shown in the list above, the JRC has already produced two detailed reports,
therefore only the most relevant information has been included in this report, with two additional Sections (La
Niña and climate changes) as requested by ERCC/DG ECHO.
The analyses of the 2020 Atlantic hurricane season, including the comparisons with the previous fourth seasons
(2016-2019) and the extremely active 2005 season are presented in Section 2. The potential effects that the
COVID-19 pandemic emergency could have had during the hurricane season have been included in Section 3,
while the effects of La Niña and climate changes, linked to the Atlantic hurricane activity, respectively in Section
4 and Section 5. Concluding remarks are in Section 6, while additional information in Annexes 1-3 and in the
previous JRC reports (see References).

15   GDACS Publications: https://www.gdacs.org/Knowledge/publications.aspx
16   ERCC Portal: https://erccportal.jrc.ec.europa.eu/

                                                                             8
2          2020 Atlantic hurricane season
A short analysis of the 2020 extremely active season is shown in Section 2.1, while a comparison with the last
five above-normal seasons (2016-2020) and the 2005 season of the record-breaking are presented in Section 2.2.
In addition, a detailed analysis of the most significant events occurred over this period is shown in Section 2.3.
2.1          Overview: Impact, frequency and GDACS alerts
The Atlantic hurricane season officially runs from 1 June to 30 November, however in 2020 it started earlier17,
with the formation of tropical storms ARTHUR on 16 May and BERTHA on 27 May and was extremely active and
destructive. Several records for a single season activity were set, overpassing several records of the 2005 season,
including the highest number of “named storms” ever recorded (see Tab. 3 and Section 2.3).
All TC tracks of the 2020 season, categorised by intensity, and the max. GDACS Alerts issued are in Fig. 3.

     2020 Atlantic hurricane season
     1.     Tropical storm ARTHUR                           12.    Tropical storm KYLE                          22.   Tropical storm BETA
     2.     Tropical storm BERTHA                           13.    Hurricane LAURA (Category 4)                 23.   Tropical storm WILFRED
     3.     Tropical storm CRISTOBAL                        14.    Hurricane MARCO (Category 1)                 24.   Subtropical storm ALPHA
     4.     Tropical storm DOLLY                            15.    Tropical storm OMAR                          25.   Tropical storm GAMMA
     5.     Tropical storm EDOUARD                          16.    Hurricane NANA (Category 1)                  26.   Hurricane DELTA (Category 4)
     6.     Tropical storm FAY                              17.    Hurricane PAULETTE (Category 2)              27.   Hurricane EPSILON (Category 3)
     7.     Tropical storm GONZALO                          18.    Tropical storm RENE                          28.   Hurricane ZETA (Category 2)
     8.     Hurricane HANNA (Category 1)                    19.    Hurricane SALLY (Category 2)                 29.   Hurricane ETA (Category 4)
     9.     Hurricane ISAIAS (Category 1)                   20.    Hurricane TEDDY (Category 4)                 30.   Tropical storm THETA
     10.    Tropical depression TEN (unnamed)               21.    Tropical storm VICKY                         31.   Hurricane IOTA (Category 5)
     11.    Tropical storm JOSEPHINE

                        Table 2 and Figure 3 - 2020 Atlantic hurricane season (sources: GDACS, NOAA).
 Tab. 2: List of the names and peak strength, Fig. 3: all TC tracks (colours based on the Saffir Simpson Hurricane Wind Scale-
                                      SSHWS, see Annex 3) and max. GDACS alert issued.

17   Note: During the past 6 Atlantic hurricane seasons (2015-2020), a “named storm” formed before the “official start” (1 Jun).

                                                                                 9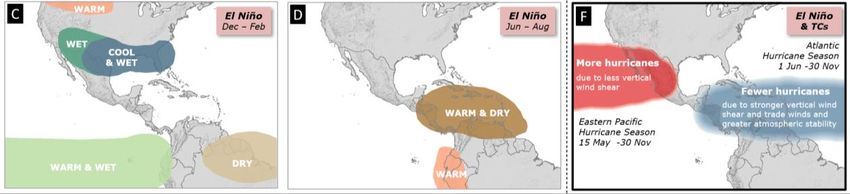
2020 - Total number of systems and GDACS Alerts issued

2020 - Number of systems by month

2020 - Cumulative number of systems and averages                                                2020 ATLANTIC
                                                                                              HURRICANE SEASON
                                                                                            EXTREMELY active season
                                                                                                    with:
                                                                                                30 Named storms
                                                                                                (Vmax ≥ 63 km/h)

                                                                                                 13 Hurricanes
                                                                                               (Vmax ≥ 119 km/h)

                                                                                               6 Major hurricanes
                                                                                               (Vmax ≥ 178 km/h)

            Figure 4 - 2020 Atlantic hurricane Season (names are coloured by intensity, see SSHWS Annex 3)
     TOP (Fig. 4a): Nr. of systems by intensity and max. GDACS alerts issued (Green, Orange or Red, see Annex 2)
MIDDLE (Fig. 4b): Total num. of TCs by intensity and month (the month corresponds to the first date of the max. intensity)
BOTTOM (Fig. 4c): Comparisons between the cumulative number of systems of the 2020 Atlantic hurricane season and the
                         average (1966-2009), source: NOAA (https://www.nhc.noaa.gov/climo/).

                                                           10
The 2020 Atlantic hurricane season was a “record-breaking” season18. The number of events recorded during
this season, as well as the averages, records and seasonal forecasts are in Tab. 3, while a number of records set
during this season are shown below:
❏ 30 Named storms formed during the season (previous record: 27 in 2005 considering only the named storms,
28 considering all the systems that reached at least tropical/subtropical storms 19).
➔ Only for the 2005 and 2020 seasons, the Greek alphabet has been introduced, since the predetermined list of
names includes only 21 names (see WMO20, NOAA21). It will not be used anymore in the future (see WMO22).
❏ 5 Named storms in July (previous record in 2005, typically only 1-2 named storms formed before August).
❏ 10 Named storms in September (record for any month, typically 4 named storms formed in September).
❏ 12 Named storms made landfall in the USA (previous record: 9 in 1916), 5 of them in Louisiana state, with
hurricane LAURA the most damaging event (see Box 1).
❏ Extremely active TC activity in November: 3 named storms (ETA 23, IOTA, THETA), including two major
hurricanes (ETA & IOTA, see Box 1), with IOTA becoming the latest-forming Category 5 Hurricane on record
in the North Atlantic basin (30-year climatology 1981-2010: 1 major hurricane every 7-8 year).
In should be noted that this season was longer-than-average with numerous rapid-intensification events, and
the ACE-Accumulated Cyclone Energy, which measures the strength/duration of tropical storms/hurricanes, of
the 2020 Atlantic hurricane season has been 75 % above the long-term mean24. More information on all the
records of this season can be found on the NOAA25 and WMO26 websites.
NOAA 2020 Atlantic Hurricane
Number of events Averages Records Season Outlook
Activity
2020 1981-2010 21 May 8 Aug
2020 New Record
Above normal ↑ 30 (≥TS) 12 (≥TS) 13-19 (≥TS) 19-25 (≥TS)
Previous: 28*(≥TS) in 2005
Above normal ↑ 13 (HU) 6 (HU) 15 (HU) in 2005 6-10 (HU) 7-11 (HU)
8 (MH) in 1950
Above normal ↑ 6 (MH) 3 (MH) 3-6 (MH) 3-6 (MH)
7 (MH) in 2005
Table 3 - 2020 TC activity, averages, records, seasonal forecasts (extended-range) (TS=Tropical Storm, HU=Hurricanes,
MH=Major Hurricanes, and ≥TS = Tropical Storms or higher strength, Named Storm, see Annex 3)
* 27 tropical storms (named storms) and one subtropical storm (unnamed), see Beven et al (2008).
NOTE: Early Warning Systems are essential to reduce the impact of these TCs and the preparedness actions play
a key role in reducing the impact of these phenomena. Following the forecast and advisories is essential because
a TC could quickly form and intensify: for example a devastating Category 5 Hurricane could be a tropical storm
or a Category 1 only a couple of days before landfall (e.g. Hurricane MARIA in 2017 intensified from Category 1
to 5 in less than one day before making landfall in Dominica, while Hurricane IOTA in 2020 intensified from
Category 1 to 5 in about one day, devastating Central America and the Colombian islands of San Andrés and
Providencia). In 2020, there were 10 rapid intensifications (see NOAA27).
The official NOAA’s 2020 Atlantic Hurricane Season Outlooks28 (see previous JRC reports and Tab. 3) published
before the start of the season correctly predicted this extremely active season. The potential La Niña
development was factored into the NOAA Outlooks issued in August (see Section 4).
18 NOAA: https://www.noaa.gov/media-release/record-breaking-atlantic-hurricane-season-draws-to-end
19 In 2005 there was also an unnamed subtropical storm, bringing the total to 28 considering the cumulative number of the systems reaching at least tropical or
subtropical storm intensity, while the number of named storms was 27.
20 WMO: https://public.wmo.int/en/media/news/2020-hurricane-season-exhausts-regular-list-of-
names#:~:text=The%20use%20of%20the%20Greek,whose%20names%20were%20all%20retired
21 NOAA: https://www.noaa.gov/news/2020-atlantic-hurricane-season-takes-infamous-top-spot-for-busiest-on-record
22 WMO: https://public.wmo.int/en/media/press-release/wmo-hurricane-committee-retires-tropical-cyclone-names-and-ends-use-of-greek
23 ETA formed at the end of October and continued in November reaching its max. intensity
24 NOAA: https://www.nhc.noaa.gov/text/MIATWSAT.shtml
25 NOAA: https://www.nhc.noaa.gov/data/tcr/, https://www.ncdc.noaa.gov/sotc/tropical-cyclones/202010,
https://www.nhc.noaa.gov/archive/tws/?yyyy=2020&bb=AT&mm=11
26 WMO: https://public.wmo.int/en/media/news/record-breaking-atlantic-hurricane-season-ends
27 NOAA: https://www.noaa.gov/media-release/record-breaking-atlantic-hurricane-season-draws-to-end
28 NOAA: https://www.cpc.ncep.noaa.gov/products/outlooks/hurricane2020/August/Slide1.JPG and https://www.nesdis.noaa.gov/content/noaa-expert-
answers-our-questions-about-historical-2020-hurricane-season
11GDACS Alerts (2020)
Since 2011, the Global Disasters Alerts and Coordination System (GDACS, www.gdacs.org) includes the real-time
impact estimation of every TCs occurring worldwide and its alerts allow to identify the cases in which the
assistance of the international community could be required (see Annex 2).
Specifically, for the 2020 Atlantic hurricane season, GDACS issued 4 Red alerts (LAURA29 in August, DELTA in
October, ETA and IOTA in November) and 5 Orange alerts (see Fig. 5c). For 2 Red alerts (ETA & IOTA), the
International Assistance (IA) was effectively required (see Section 2.2 and 2.3).
❏ Hurricane LAURA (20-28 Aug 2020): it made landfall on 27 Aug along the coasts of Louisiana (USA), close
to the border with Texas, as an intense Category 4 with max. sustained winds of 240 km/h. Strong winds,
heavy rainfall and storm surge (up to 3-4 m) affected these areas. After the landfall, it moved inland
weakening, but still producing heavy rainfall in several states of the USA. LAURA, before reaching the
USA, moved across the Caribbean as a tropical storm, causing damage and fatalities, especially in Haiti
and Dominican Republic. It caused the death of at least 49 people, including 31 in Haiti. It should be
noted that the coastal areas of Louisiana were affected only a few days before, by the passage of tropical
storm MARCO, and LAURA was the strongest (tied) hurricane to ever hit Louisiana30.
❏ Hurricane ETA (31 Oct - 13 Nov 2020): it formed over the Caribbean Sea on 31 Oct and started moving
west strengthening. It made landfall in Nicaragua, in the area south of Puerto Cabezas, on 3 Nov as a
Category 4 hurricane with max. sustained winds of 220 km/h. Then it moved inland over Nicaragua and
Honduras and emerged again over the Caribbean Sea, reaching Cuba on 8 Nov and Florida (USA) on 9
and 12 Nov, as a tropical storm. During its passage, it caused very heavy rainfall and extensive floods in
several areas of Central America (mostly in Guatemala, Honduras, Nicaragua, Mexico and Panama), as
well as in parts of the Caribbean islands and south-eastern USA.
❏ Hurricane IOTA (13-18 Nov 2020): it formed over the Caribbean Sea on 13 Nov and moved west towards
Nicaragua, strengthening into a very dangerous Category 5 Hurricane on 16 Nov, passing very close to
the archipelago of San Andrés, Providencia and Santa Catalina (Colombia). Then it slightly weakened and
reached the area south of Puerto Cabezas (almost the same landfall area of hurricane ETA) early on 17
Nov, still as a dangerous Category 4 Hurricane with max. sustained winds of 240 km/h. Afterwards, it
continued moving inland towards Honduras and El Salvador weakening, but affecting these areas with
heavy rain. IOTA especially affected Nicaragua, San Andrés and Providencia (Colombia) 31 and Honduras.
➔ ETA & IOTA caused extensive floods and damage in Central America, as well in the Colombian islands of
San Andrés and Providencia, affecting millions of people and causing over 300 fatalities (preliminary
data32) and the international assistance was required (see Section 2.3).
➔ The extended severe weather situation due to the passage of hurricanes ETA and IOTA posed increasing
risk of excessive overspilling for the El Cajon dam in Honduras, one of the countries mostly hit by these
events. The international community in general and the humanitarian organizations in particular raised
concerns on the possible consequences of the dam emergency release operations. To support the
ongoing humanitarian response JRC performed a specific dam inundation analysis, as for the situation of
the dams after the passage of MARIA in Puerto Rico (2017), SON-TINH in Laos PDR (2018) and IDAI in
Mozambique (2019).
Box 1 - Description of the deadliest events of the 2020 Atlantic hurricane season.
29 Final GDACS alert for LAURA: Orange (at the beginning it was a Red alert, but after the new forecasts became available, the alert level was reduced to Orange).
30 WMO: https://public.wmo.int/en/media/news/hurricane-laura-hits-usa
31 It should be noted that Colombia was also facing the effects of La Niña (see Section 4)
32 ECHO Daily Map of 18 Dec 2020: https://erccportal.jrc.ec.europa.eu/getdailymap/docId/3576
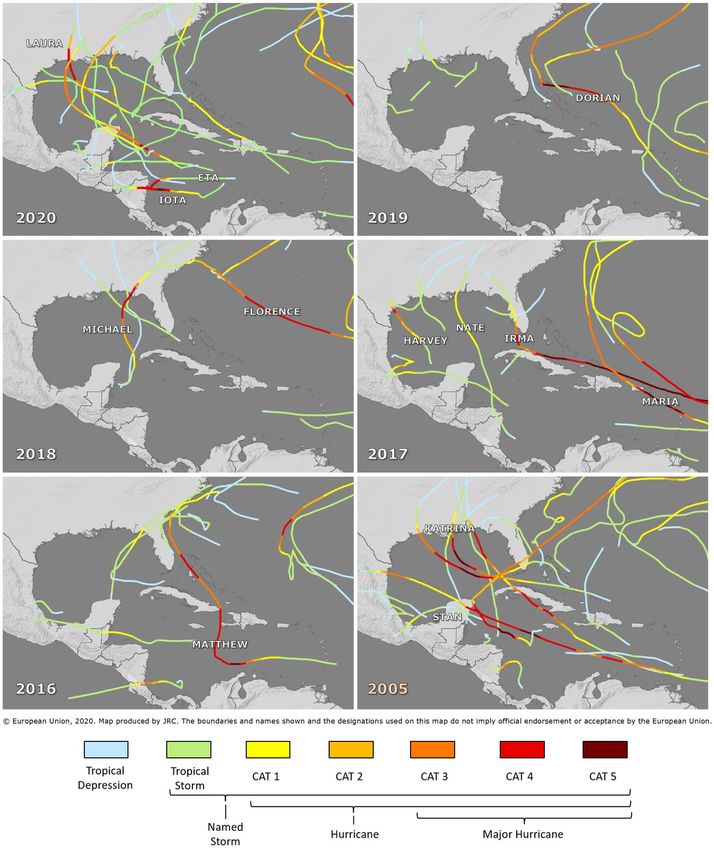
122.2 Comparisons with past events: 2005 & 2016-2020
In this Section, a comparison among the latest four seasons with above-normal activities (2016-2019) and the
“record-breaking seasons” (2005, 2020) is presented. All TC tracks over the period of this analysis, categorised
by intensity, are shown in Fig. 6.
Of these TCs, JRC has analysed the following aspects:
o Humanitarian impact by TC season (Fig. 5a)
o Total number of TCs by season and intensity (Fig. 5b)
o Maximum alerts issued by GDACS (Fig. 5c)
The TCs that form in this basin could affect several vulnerable islands of the Caribbean area (see Fig. 1), causing
every year hundreds of fatalities and damage that could require international assistance (see previous JRC
Reports and UN OCHA report - Latin America and the Caribbean: Natural Disasters 2000-201933).
Specifically, the 2005 is one of the most active and deadliest Atlantic hurricane seasons ever recorded 34, with
several devastating events like KATRINA, STAN, RITA, WILMA, DENNIS, ALPHA, GAMMA. Among them, KATRINA
and STAN were the deadliest events and only these two events have been described in Box 2 and analysed in
Section 2.3, while more information can be found on the NOAA website35 and in Baven et al. (2008).
❏ Hurricane KATRINA (23-30 Aug 2005): One of the most damaging TCs disasters in the history of the USA,
which caused fatalities and damage in several regions (Florida, Gulf of Mexico, Louisiana and Mississippi,
Georgia and Alabama), with more than 1500 direct fatalities, mostly in Louisiana. KATRINA, after reaching
Category 5 hurricane over the Gulf of Mexico, made landfall in Louisiana as a Category 3. It caused a large
storm surge, straining the levee system protecting New Orleans and significant failures occurred in this
system, causing extensive floods.
❏ Hurricane STAN (1-5 Oct 2005): It formed over the Caribbean Sea and it reached first the Yucatan
Peninsula (Mexico) early in October, as a tropical storm, then Veracruz state as a Category 1 hurricane,
causing the direct death of 80 people. However, STAN was “embedded within a portion of a larger low-
level cyclonic circulation”, which caused very heavy rains and floods in Mexico and Central America,
causing the death of 1000-2000 people, especially in Guatemala (see Beven et al., 2008).
Box 2 - Description of the two deadliest events of the 2005 Atlantic hurricane season.
Considering the last fourth Atlantic hurricane seasons 2016-201936, the 2017 was particularly active and intense,
with 6 major hurricanes (as in 2020), 3 of them (HARVEY, IRMA and MARIA) caused large damage 37 and fatalities
in the Caribbean and USA38. In addition, hurricane MATTHEW in 2016 caused nearly 600 fatalities (mostly in Haiti)
and hurricane DORIAN in 2019 left a trail of destruction in the Bahamas. Also, during the 2020 extremely active
Atlantic season, around 400 people died (preliminary number), with hurricanes ETA and IOTA that affected
millions of people and caused extensive damage in Central America and Colombian islands. During the same
season, several hurricanes affected the USA, especially Louisiana, with LAURA the most severe event, and
Caribbean islands like Haiti, Dominican Republic, Cuba and the Bahamas were also affected by various systems.
For the most significant events of the period analysed (except for NATE in 2017, see previous JRC reports), GDACS
issued a Red or Orange alert at least 3 days in advance, timely alerting the international community.
33 https://www.humanitarianresponse.info/en/operations/latin-america-and-caribbean/document/latin-america-and-caribbean-natural-disasaters-2000
34 2005 Atlantic hurricane season was the most active on record before the 2020 season in terms of named storms and it is still the most active in terms of
hurricanes. It broke several “records”: 27 tropical storms (named storms) and one subtropical storm (unnamed), with 15 becoming hurricanes and 7 major
hurricanes (with five Category 5 Hurricanes), see Beven et al. (2008)
35 NOAA: https://www.ncdc.noaa.gov/sotc/tropical-cyclones/200513
36 A detailed analysis of these seasons is presented in the previous JRC Emergency Reports.
37 WMO: https://public.wmo.int/en/media/news/lessons-learnt-from-2017-caribbean-hurricane-season.
38 WMO: https://public.wmo.int/en/media/news/wmo-hurricane-committee-reviews-devastating-2017-season-retires-names
13✻ Most of the deaths due to
hurricane Katrina. For STAN,
only the direct fatalities have
been included, but it was
embedded within a portion of
a larger low-level cyclonic
circulation, resulting in 1000-
2000 fatalities, see Box 2.
✻ Only direct fatalities have
been included (number of
indirect fatalities could be
significantly higher).
✻ Preliminary data of the
2020 Atlantic season.
✻ 2005 “unnamed”
subtropical storm included
Figure 5 - TOP (Fig. 5a): Number of fatalities and people affected by TC season (2005, 2016-2020), as well as the names of
the most significant TCs of the season. MIDDLE (Fig. 5b) - Total number of named storms (Tropical storms or higher
strength) by season (2005, 2016-2020) and intensity (see SSHWS, classification in Annex 3). BOTTOM (Fig. 5c) - All TCs
GDACS Alerts (Green, Orange, Red) issued for the Atlantic Basin (max. alert sent to the users), including also the tropical
depressions. The names of the TCs GDACS Red Alert are also indicated in this figure.
Sources: Impact (ECHO, UN, EM-DAT, NOAA, Beven et al. 2008), TC information (GDACS, NOAA).
14Figure 6 - TCs in the Atlantic basin for the seasons 2005 & 2016 - 2020. The names of the most significant events (see
Section 2.3) are included in the maps. Data sources: GDACS, NOAA.
152.3 Relevant past events
The most significant TCs for the seasons analysed (2005, 2016-2020) have been selected, considering:
• Humanitarian impact (number of fatalities > 20*)
• Support from UN OCHA (on field and economic)
• EUCPM activation
• EU Solidarity Funds request
* NOTE: For the 2005 Atlantic hurricane season there were several devastating events that caused extensive
damage with more than 20 fatalities (e.g. KATRINA, STAN, RITA, WILMA, DENNIS, ALPHA, GAMMA). Among
them, KATRINA and STAN (see Section 2.2.) were the deadliest events and only these two events have been
selected. For 2020, only the three major events IOTA, ETA and LAURA have been included using the information
available so far and not the NOAA’s 2020 - TC final reports (not yet available for all TCs).
Tab. 4 on the next page contains the following information for the 15 TCs identified and included in Fig.7.
TC Information
● TC time period: from the formation until its dissipation (sources: GDACS, NOAA)
● TC intensity: information provided for the peak intensity (sources: GDACS, NOAA)
○ Classification based on the maximum 1-min sustained winds (Vmax) and the category of the
Saffir-Simpson Hurricane Wind Scale (SSHWS), see Annex 3.
■ Vmax ≤ 62 km/h (Tropical Depression-TD)
■ Vmax 63-118 km/h (Tropical Storm-TS)
■ Vmax ≥ 119 km/h (Hurricane, Category from 1 to 5)
Impact
● Humanitarian impact: in terms of number of direct fatalities (sources: NOAA, EM-DAT, ECHO, OCHA)
○ Direct fatalities: “fatalities occurring as a direct result of the forces of the TC, including people
who drowned in storm surge, rough seas, rip currents and freshwater floods, as well as
casualties resulting from lightning and wind-related events”.
○ Indirect fatalities: “fatalities occurring from other indirect factors like heart attacks, house fires,
electrocutions from downed power lines, vehicle accidents on wet roads.”
The number of “indirect fatalities” could be considerably higher than the direct ones.
➔ In the case of hurricane MARIA in 2017, the number of fatalities is highly uncertain: the
official number in Puerto Rico is 65, but various studies suggested that hundreds (possibly
thousands) may have died during its aftermath, when lack of electricity, water and access to
medical cares affected many people. The total number of fatalities is highly uncertain also in
the case of hurricane STAN in 2005 (see Box. 2).
● Affected area: the most affected countries.
Early Warning System
● GDACS Alert level: Red/Orange/Green alert issued (max. alert sent to the users);
Response
● Humanitarian response: total amount of the requested funds39
(source: UN OCHA, https://fts.unocha.org) and amount of which provided from European Commission's
Humanitarian Aid and Civil Protection Department).
● EUCPM Activation.
● European Union Solidarity Fund (EUSF): total EUSF aid
(source: EC, https://ec.europa.eu/regional_policy/en/funding/solidarity-fund/).
● Copernicus EMS activations: activation code for Rapid Mapping and Risk and Recovery activations.
39 Values converted to EUR from USD
16Figure 7 and Table 4 - Relevant TCs in the Atlantic basin for the seasons 2005 & 2016 - 2020. Data sources: TC information
(GDACS, NOAA), Humanitarian impact (NOAA Reports, EM-DAT, UN OCHA, ECHO), Response (ECHO, OCHA, Copernicus EMS
(a) death toll in Puerto Rico was uncertain see Pag. 16, (b) including pre-disturbance, (c) only direct fatalities of STAN, the
whole complex system: 1000-2000 fatalities see Box 2, (d) reduced to Orange in the Final alert level, (e) further economic
support has been provided, see https://ec.europa.eu/echo/news/eu-adds-35-million-post-hurricane-matthew-aid-
haiti_en). Note for 2020 events: Preliminary number of fatalities / TC intensity (NOAA RSMC Miami TC reports not yet
available for all the events) and total humanitarian funds amount not yet available.
173 Hurricanes & COVID-19
In 2020, the COVID-19 pandemic emergency influenced the preparedness and response activities of the TC
seasons and the governments updated/revised their guidelines to address all the containment measures adopted
for COVID-19. This “multi-risk situation” could have increased the vulnerability of the people at risk, complicating
the management of the emergency (see WHO40); for example, as a consequence of the difficulty to respect the
social distancing inside the shelters and during the evacuations and recovery activities, with the potential risk of
the insurgence of new cases. It might also have affected the response and recovery operations (see WMO41).
A detailed analysis on the potential effects and containment measures was included in the previous JRC Report
(Probst et al., 2020), while more information can be found at: EC-JRC COVID-19 Dashboard42, ECDC43, WHO
COVID-19 Dashboard44, Pan American Health Organization (PAHO)/WHO45, CDEMA46, CARICOM47 and CARPHA48.
For example, the number of cases in Honduras in Nov showed an increase in the departments strongly affected
by the passage of ETA at the beginning of the month 49 . The same areas were affected again by the passage of
the hurricane IOTA only two weeks later. It is difficult to say if its passage could have had an effect on the number
of cases (e.g. due to possible lack of social distancing), but it is clear however that any additional crisis can
endanger the efforts for the COVID-19 crisis, especially since several areas were still recovering from the previous
hurricane. Preliminary reports showed health/care facilities damaged, limitation/no access to health services,
major losses in medical equipment and other supplies in the areas affected. According to PAHO/WHO report 50:
“The affected countries present a multi-hazard scenario, where in addition to the impacts of both hurricanes Eta and
Iota, the countries have been facing an ongoing COVID19 pandemic which have been saturating their already
vulnerable health services for months. The situation is worsened by pre-existing epidemiological situation (Dengue,
Malaria, Leptospirosis) in some countries. Furthermore, there are existing risks related to COVID19 shelter
management due to the insufficient access to PPE and the difficulties implementing COVID19 preventive measures.”
In this context, during the 2020 Atlantic hurricane season, JRC monitored the COVID-19 emergency, through the
EC-JRC COVID-19 Dashboard (https://covid-statistics.jrc.ec.europa.eu/), and the new GDACS section on the
COVID-19 situation in the affected countries (see Fig. 8 for hurricanes ETA and IOTA).
Figure 8 - COVID-19 time evolution in Honduras affected by hurricanes ETA & IOTA (Source: GDACS, as of 3 Dec 2020)
40 WHO: https://www.who.int/publications/i/item/WHO-2019-nCoV-Advisory-Preparedness-2020.1
41 WMO: https://public.wmo.int/en/resources/bulletin/early-warnings-and-actions-mitigate-disasters-pandemic-
situation?utm_source=WMO+Bulletin&utm_campaign=e3b7035b2e-
EMAIL_CAMPAIGN_2018_11_20_01_43_COPY_01&utm_medium=email&utm_term=0_46acf39490-e3b7035b2e-,
https://library.wmo.int/doc_num.php?explnum_id=10444
42 EC-JRC: https://covid-statistics.jrc.ec.europa.eu/
43 ECDC: https://www.ecdc.europa.eu/en/geographical-distribution-2019-ncov-cases
44 WHO: https://covid19.who.int/
45 PAHO/WHO: https://who.maps.arcgis.com/apps/opsdashboard/index.html#/16a046e687b3400b920b5b2f398587e1 and
https://ais.paho.org/phip/viz/COVID19Table.asp
46 CDEMA: https://www.cdema.org
47 CARICOM: https://caricom.org/
48 CARPHA: https://carpha.org/What-We-Do/Public-Health/Novel-Coronavirus
49 WHO/PAHO: https://reliefweb.int/sites/reliefweb.int/files/resources/ETA.pdf
50 PAHO/WHO: https://www.paho.org/en/documents/pahowho-response-hurricanes-eta-and-iota-central-america-situation-report-9
184 Hurricanes & La Niña
The 2020 is the fifth consecutive year with an above-normal TC activity in the Atlantic basin (see Section 2.2) and
La Niña had an important role, but “El Niño/La Niña” are not the only factors that could influence the TCs activity,
there are many other aspects that have to be considered. As reported by NOAA 51:
“This increased hurricane activity is attributed to the warm phase of the Atlantic Multi-Decadal Oscillation (AMO)
— which began in 1995 — and has favoured more, stronger, and longer-lasting storms since that time. Such active
eras for Atlantic hurricanes have historically lasted about 25 to 40 years. The interrelated set of atmospheric and
oceanic conditions linked to the warm AMO were again present in 2020. These included warmer-than-average
Atlantic sea surface temperatures and a stronger west African monsoon, along with much weaker vertical wind
shear and wind patterns coming off of Africa that were more favourable for storm development. These conditions,
combined with La Nina, helped make this record-breaking, extremely active hurricane season possible.”
NOTE: Since this analysis is not focused on the topic “El Niño/La Niña”, only the most significant information for
the Atlantic TC basin is reported below, while for more information see the links included in the References.
4.1 ENSO (El Niño-Southern Oscillation): El Niño and La Niña
El Niño-Southern Oscillation (ENSO) describes a period of fluctuation in the sea surface temperature and air
pressure of the overlying atmosphere in the east and central Equatorial Pacific Ocean, which can have a
large impact on the usual climate/weather pattern throughout the year (see References, NOAA, WMO)
Warm phase: El Niño, Cold phase: La Niña
These phenomena could also affect the TCs in various parts of the world: when El Niño is sufficiently strong could
reduce the TC activity in the Atlantic basin (different effect in the other basins) like in 2015 (see Fig. 2),
conversely La Niña could enhance it in this basin, like in 202052.
Atlantic basin: Typical Weather Impacts (temperature & precipitation patterns, Hurricane activity)
during a typical La Niña event and not specific for the 2020-2021 event
during a typical El Niño event and not specific for the 2020-2021 event
Figure 9 - Typical influence of La Niña (TOP) and El Niño (BOTTOM) on the weather patterns (A-D) (see NOAA53) and
potential effects on the hurricane activity (E-F) (see ENSO blog, climate.gov54)
51 NOAA: https://www.noaa.gov/media-release/record-breaking-atlantic-hurricane-season-draws-to-end
52 NOAA: https://www.noaa.gov/media-release/extremely-active-hurricane-season-possible-for-atlantic-basin and https://www.aoml.noaa.gov/behind-the-
2015-atlantic-hurricane-season-wind-shear-tropical-cyclones/
53 https://www.climate.gov/news-features/featured-images/global-impacts-el-ni%C3%B1o-and-la-ni%C3%B1a
54 https://www.climate.gov/news-features/blogs/enso/impacts-el-ni%C3%B1o-and-la-ni%C3%B1a-hurricane-season
19An indication of the ENSO intensity over the past 40 years is presented in Fig. 10, where the Multivariate ENSO
Index55(MEIV2.0) is shown, as well as the most recent major strong events of La Niña / El Niño. Specifically, the
last strong La Niña event occurred nearly a decade ago (2010-2011) and was one of the strongest events,
followed by a moderate event in 2011-201256,57. These events caused widespread floods in several countries, like
in Australia and in part of south-east Asia, drought in East Africa, and enhanced the TC activity in the Atlantic
basin (see NOAA58, WMO59). It also affected other countries, like Colombia, where 4 million people were affected
with large economic losses (see Hoyos et al, 2013), see more information in the References.
NOTE: After the 2015-2016 El Niño event, which affected millions of people around the world, an ENSO cell was
developed by the Food and Agricultural Organisation of the United Nations, WMO and humanitarian
organizations to provide impact-based advice to the United Nations and its humanitarian partners (see WMO 60).
Figure 10 - Multivariate ENSO Index (MEIv2.0, NOAA61). The latest strong La Niña/El Niño events are highlighted.
4.2 ENSO situation & forecast
La Niña developed in the tropical Pacific in Aug-Sep62 2020, during the peak of hurricane season, influencing the
climate/weather patterns around the world, including the Caribbean, enhancing the Atlantic hurricane activity 63
(see impact summary in WMO64 and UN65). It strengthened in Oct and continued over the following months.
According to the latest forecast (11 Mar 2021, NOAA66), La Niña persisted in Jan and Feb 2021 and there is:
❏ ~60% chance of a transition to ENSO-Neutral during the Northern Hemisphere spring 2021 (April-June)
→ ENSO Alert system Status: La Niña Advisory
Current ENSO conditions/forecasts are available at WMO67, NOAA68, IRI69, CariCOF70 (see References).
55 A description of the ENSO indexes available are in https://www.weather.gov/fwd/indices and https://psl.noaa.gov/enso/mei/
56 La Niña 2010-2011 event was comparable in strength with the events of 1917–1918, 1955–1956 and 1975–1976,
http://www.bom.gov.au/climate/enso/history/La-Nina-2010-12.pdf, see the strong events on the NOAA MEI website
57 BOM: http://www.bom.gov.au/climate/enso/lnlist/
58 NOAA: https://www.climate.gov/news-features/understanding-climate/double-dip-la-ni%C3%B1a
59 WMO: https://public.wmo.int/en/media/press-release/la-ni%C3%B1a-has-developed
60 WMO: https://public.wmo.int/en/media/press-release/la-ni%C3%B1a-has-developed
61 NOAA: https://psl.noaa.gov/enso/mei/
62 WMO: https://public.wmo.int/en/our-mandate/climate/el-ni%C3%B1ola-ni%C3%B1a-updat e
63 Additional conditions for an extremely active season: warmer-than-average sea surface temperatures in the tropical Atlantic Ocean and Caribbean Sea, reduced
vertical wind shear, weaker tropical Atlantic trade winds and an enhanced west African monsoon, see NOAA https://www.noaa.gov/media-
release/extremely-active-hurricane-season-possible-for-atlantic-basin
64 WMO: https://public.wmo.int/en/media/press-release/la-ni%C3%B1a-has-developed
65 UN: https://news.un.org/en/story/2020/10/1076432
66 NOAA: https://www.cpc.ncep.noaa.gov/products/analysis_monitoring/enso_advisory/ensodisc.shtml
67 WMO: https://public.wmo.int/en/our-mandate/climate/el-ni%C3%B1ola-ni%C3%B1a-update
68 NOAA: https://www.cpc.ncep.noaa.gov/products/analysis_monitoring/enso_advisory/ensodisc.shtml
69 IRI: https://iri.columbia.edu/our-expertise/climate/forecasts/enso/current/
70 CariCOF: https://rcc.cimh.edu.bb/long-range-forecasts/caricof-climate-outlooks/
205 Hurricanes & Climate change
As shown in the previous sections, Tropical Cyclones (TCs) are among the most dangerous natural disasters, with
their destructive winds, torrential rainfall (and consequent effects like floods, flash floods and landslides) and
storm surge. Every year these natural phenomena affect millions of people around the world, leaving a trail of
destruction in several countries, especially along the coastal areas, including in the Caribbean area. In 2020, the
number of TCs (globally) was above average with more than double long-term activity in the Atlantic basin71,72.
The destructive effects of the climate change around the world are widely studied around the world (see UN 73)
and in 2020, as reported in the latest WMO Provisional Report on the State of the Global Climate 202074:
“Concentrations of the major greenhouse gases, CO2, CH4, and N2O, continued to increase in 2019 and 2020. Despite
developing La Niña conditions, global mean temperature in 2020 is on course to be one of the three warmest on
record. The past six years, including 2020, are likely to be the six warmest years on record.”
In this context, to understand the role of the climate change also on the TC activity is fundamental and the
dialogue between the humanitarian and scientific communities is even more important to improve the TC impact
estimation. However, the link between TCs and climate change is very complex and it has been looked at closely
by several scientists over the last decade, with sometimes conflicting results.
Note: This complex topic goes beyond the aim of this report and therefore only some relevant information are
reported below, to show how climate change could have influenced TCs activity in the past and could affect them
in the future. More information can be found on the WMO and IPCC websites (see References).
❏ Past TC activity:
A new study (see Murakami et al, 2020, NOAA75) shows how the climate change may have been influencing
the locations where the TCs occur, in terms of global spatial distribution.
→ An increasing trend has been observed over the period 1980-2018 in the North Atlantic and Central Pacific,
while a decreased trend in the western North Pacific and southern Indian Ocean.
→ According to the same study, three forces are influencing where the TCs are hitting: greenhouse gases,
manmade aerosols (including particulate pollution and other aerosols) and volcanic eruptions.
❏ Future TC activity:
According to several studies, climate change might have for example the following impacts in the future:
▪ Future sea level rise, due to global warming, could lead to a higher storm surge
▪ TC precipitation rates will likely increase
Other studies (see References) show also other possible effects (e.g. slowdown in TC translation speed,
poleward shift, rapid intensification, decreases in TC numbers, but increases in their maximum intensities).
It should be noted that there is still uncertainty among the various topics and work is still on-going, especially
on the representation of the air-sea processes and how the extreme intensity of TC’s centre and its rapid
intensifications can be modelled. There is also a variation between different modelling studies of the TC
parameters in the different TC basins.
More information on the WMO76, IPCC77, NOAA78 websites, as well as in several studies like Walsh et al.
(2019), Kossin (2018), Sharmila and Walsh (2018), Knutson et al. (2010 and 2019).
Note: More information on El Niño Southern Oscillation (ENSO), see Section 4, and climate change can be found
at: https://www.pmel.noaa.gov/elnino/news-story/el-ni%C3%B1o-southern-oscillation-changing-climate
71 NOAA: https://www.nesdis.noaa.gov/content/noaa-expert-answers-our-questions-about-historical-2020-hurricane-season
72 NOAA: https://www.ncdc.noaa.gov/sotc/tropical-cyclones/202013
73 UN: https://www.un.org/sg/en/content/sg/statement/2020-12-02/secretary-generals-address-columbia-university-the-state-of-the-planet-scroll-down-for-
language-versions
74 WMO: https://library.wmo.int/doc_num.php?explnum_id=10444
75 NOAA: https://www.noaa.gov/news/study-climate-change-has-been-influencing-where-tropical-cyclones-rage
76 WMO: https://public.wmo.int/en/bulletin/tropical-cyclones-warmer-climate and https://public.wmo.int/en/media/news/devastating-tropical-cyclones-
florence-and-mangkhut-raise-renewed-questions-about-climate
77 IPCC: https://www.ipcc.ch/
78 NOAA: https://www.noaa.gov/news/study-climate-change-has-been-influencing-where-tropical-cyclones-rage
216 Conclusions
The 2020 Atlantic hurricanes season (North Atlantic Ocean, Caribbean Sea, and Gulf of Mexico) was extremely
active: 30 named storms (tropical storm or higher strength), with 13 hurricanes and 6 major hurricanes; these
numbers are more than double the long-term averages (respectively: 12, 6 and 3).
The season in this Tropical Cyclone (TC) basin officially starts on 1 June and ends on 30 November, with the
highest activity from mid-August to late October. However, in 2020 two tropical storms formed in May, before
the start of the season, and two major hurricanes (ETA and IOTA) formed during the last month of the season,
including hurricane IOTA which was the latest-forming Category 5 hurricane on record.
Numerous records were set in 2020, including the highest number of named storms in one single season (30),
single month (10 in September), and which made landfall in USA (12).
In this report, the 2016-2020 seasons and the extremely active 2005 season have been analysed in detail,
considering the impact on the affected areas (in terms of fatalities) and the international humanitarian support
(OCHA funding, EUCPM activation, EU Solidarity Funds). Notably, there were: KATRINA (2005) in the USA, STAN
(2005) in Central America; MATTHEW (2016) in Haiti; IRMA (2017) and MARIA (2017) in the Caribbean and USA;
DORIAN (2019) in the Bahamas; ETA and IOTA (2020) which left a trail of destruction in Central America.
The 2020 season is the fifth consecutive Atlantic hurricane season above-average and several conditions
contributed to make this record-breaking season possible: La Niña, which enhanced the hurricane activity in this
basin, combined with the interrelated set of atmospheric and oceanic conditions linked to the warm phase of
the Atlantic Multi-Decadal Oscillation-AMO (e.g. warmer-than-average Atlantic sea surface temperatures,
stronger west African monsoon, much weaker vertical wind shear, wind patterns coming off of Africa; NOAA).
It should be noted that the COVID-19 pandemic emergency influenced the hurricane preparedness and response
activities, creating a multi-risk situation and increasing the vulnerability of the affected areas.
The Global Disasters Alerts and Coordination System (GDACS, www.gdacs.org) timely and correctly issued RED
alerts also for the most destructive events of the 2020 record-breaking hurricane season: ETA and IOTA.
22You can also read