Climate impacts associated with reduced diet diversity in children across nineteen countries - IOPscience
←
→
Page content transcription
If your browser does not render page correctly, please read the page content below
PAPER • OPEN ACCESS

Climate impacts associated with reduced diet diversity in children across
nineteen countries
To cite this article: Meredith T Niles et al 2021 Environ. Res. Lett. 16 015010

View the article online for updates and enhancements.

                                This content was downloaded from IP address 46.4.80.155 on 12/03/2021 at 23:39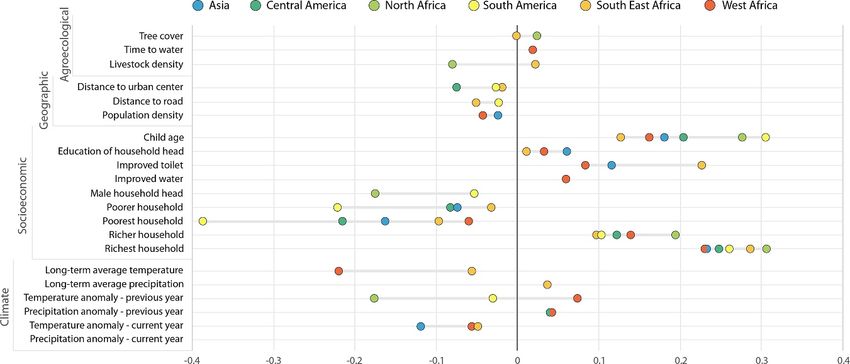
Environ. Res. Lett. 16 (2021) 015010 https://doi.org/10.1088/1748-9326/abd0ab
LETTER
Climate impacts associated with reduced diet diversity in children
OPEN ACCESS
across nineteen countries
RECEIVED
9 September 2020 Meredith T Niles1,2, Benjamin F Emery3, Serge Wiltshire4, Molly E Brown5, Brendan Fisher2,6,7
REVISED
20 November 2020
and Taylor H Ricketts2,7
1
ACCEPTED FOR PUBLICATION Department of Nutrition and Food Sciences and Food Systems Program, University of Vermont, Burlington, VT, United States of
4 December 2020 America
2
PUBLISHED
Gund Institute for Environment, University of Vermont, Burlington, VT, United States of America
3
14 January 2021 Sandia National Laboratory, Albuquerque, NM, United States of America
4
Department of Environmental Science, Policy, and Management, University of California, Berkeley, CA, United States of America
5
Department of Geographical Sciences, University of Maryland, College Park, MD, United States of America
Original content from 6
this work may be used Environmental Program, University of Vermont, Burlington, VT, United States of America
7
under the terms of the Rubenstein School of Environment and Natural Resources, University of Vermont, Burlington, VT, United States of America
Creative Commons
Attribution 4.0 licence. E-mail: mtniles@uvm.edu
Any further distribution Keywords: climate change, child health, malnutrition, adaptation, nutritional security
of this work must
maintain attribution to Supplementary material for this article is available online
the author(s) and the title
of the work, journal
citation and DOI.
Abstract
It is widely anticipated that climate change will negatively affect both food security and diet
diversity. Diet diversity is especially critical for children as it correlates with macro and
micronutrient intake important for child development. Despite these anticipated links, little
empirical evidence has demonstrated a relationship between diet diversity and climate change,
especially across large datasets spanning multiple global regions and with more recent climate data.
Here we use survey data from 19 countries and more than 107 000 children, coupled with 30 years
of precipitation and temperature data, to explore the relationship of climate to child diet diversity
while controlling for other agroecological, geographic, and socioeconomic factors. We find that
higher long-term temperatures are associated with decreases in overall child diet diversity, while
higher rainfall in the previous year, compared to the long-term average rainfall, is associated with
greater diet diversity. Examining six regions (Asia, Central America, North Africa, South America,
Southeast Africa, and West Africa) individually, we find that five have significant reductions in diet
diversity associated with higher temperatures while three have significant increases in diet diversity
associated with higher precipitation. In West Africa, increasing rainfall appears to counterbalance
the effect of rising temperature impacts on diet diversity. In some regions, the statistical effect of
climate on diet diversity is comparable to, or greater than, other common development efforts
including those focused on education, improved water and toilets, and poverty reduction. These
results suggest that warming temperatures and increasing rainfall variability could have profound
short- and long-term impacts on child diet diversity, potentially undermining widespread
development interventions aimed at improving food security.
1. Introduction the diversity of foods eaten in the diet over a given
time period. Overall, diet diversity is demonstrated
Childhood malnutrition and undernourishment can to be a good indicator of micronutrient intake, a
lead to a number of health outcomes, which can lack of which indicates malnutrition [3] including
negatively impact children’s life trajectories [1]. The obesity [4]. Poor diet diversity is also associated
majority of childhood malnutrition occurs in low with undernourishment outcomes including stunt-
and middle income countries in children under the ing and wasting in children [3, 5–8]. Though child-
age of five [2]. Diet diversity is an indicator of diet hood malnutrition has decreased over the past sev-
quality, which is typically measured by a count of eral decades globally, there has been an increase in
© 2021 The Author(s). Published by IOP Publishing Ltd
Environ. Res. Lett. 16 (2021) 015010                                                                    M T Niles et al

global undernourishment since 2015, in part associ-             A shortcoming of existing studies linking cli-
ated with climate and extreme events [9]. While there       mate to child malnutrition is both their geographic
is an abundance of research exploring the relationship      and their temporal scope. For example, while 80%
of agroecological, geographic, socioeconomic, and           of studies in a 2015 review found weather variables
demographic factors to child malnutrition [10, 11],         related to child stunting outcomes, almost all of these
the evidence linking climate and child malnutrition         studies focused on Africa [12], despite the fact that
is limited, especially across multiple geographic scales    Asia has 55% of all stunted children globally [37].
[12, 13].                                                   Furthermore, the majority of these studies included
     Existing evidence suggests that many factors cor-      data from the 1980s and 1990s, with only one-third
relate with child malnutrition, including stunting and      integrating any data from the early 2000s [12]; a
wasting. Ecological factors, including increased forest     timeframe that might not capture the more recent
cover, have been associated with better child health        anomalies and extreme events associated with climate
outcomes like improved diet diversity and reduced           change.
stunting and wasting [11, 14] because of their capa-            Here we aim to overcome both the geographic and
city to provide food sources, forest-based income,          the temporal gaps in the literature by linking demo-
and pollination for crops. Geographic factors, includ-      graphic health data from 107 000 children under
ing road and transportation infrastructure, which           five in 19 low- and middle-income countries across
can provide market access and potentially improve           six regions (SI appendix table S1, which is available
incomes [15], are associated with reductions in stunt-      online at stacks.iop.org/ERL/16/015010/mmedia),
ing and wasting, while shorter distance to a water          with climate data and other agroecological, geo-
source is associated with reduced stunting [16].            graphic, socioeconomic, and demographic control
Socioeconomic and demographic factors including             variables (table 1) to estimate diet diversity. Our
wealth [5, 17, 18], improved water sources [19, 20]         work adds to the current body of research in mul-
and improved toilet facilities [20–22] as well as edu-      tiple ways. First, we employ a large primary dataset
cation [8, 23] are also associated with reductions          (Demographic Health Surveys [DHS]) with more
in child stunting. However, with a few exceptions           recent data (2005–2009) than many existing studies
(e.g. [13, 14]), most of these studies focus on a single    (SI appendix table S1). Second, we integrate geocoded
country or region.                                          human health data with 30 years of geocoded temper-
     Compared to these factors, the role of climate         ature and precipitation data. Finally, we utilize hier-
and its relationship to diet and malnutrition is            archical models, which have been suggested to more
poorly understood, especially across diverse geo-           holistically explore the relationship of climate to child
graphic regions [12]. The way in which climate affects      malnutrition outcomes [38], with random effects at
nutritional outcomes is complex, but occurs primar-         multiple levels to facilitate cross-regional analyses. We
ily through an agroecosystems pathway with diverse          report our model results in standardized coefficients
impacts on crops, pests, diseases, weeds, pollination,      to enable comparison between and understanding of
forests, livestock, and aquatic food sources [24]. As       relative impact across multiple factors.
a result, climate change impacts on these agroecosys-
tems could affect multiple components of food secur-        2. Results
ity and diet diversity by changing the availability
and quality of food sources within a region. Climate        2.1. Diet diversity
effects on these pathways could occur over short-term       On average, we find that diet diversity of children
timeframes (e.g. extreme weather events or floods) as       five and under in our dataset is 3.22 (s.d. = 2.43),
well as longer-term changes (e.g. increasing temper-        meaning that in the 24 h prior to the survey inter-
atures) Climate can also affect nutritional outcomes        view, children ate on average 3.2 foods groups (out
through indirect pathways such as through heat              of ten possible). Diet diversity ranged from a high
impacts on pregnant women and children [25, 26],            of 4.48 in South America to a low of 2.66 in South-
and through changes in food costs, trade, and mar-          east Africa (figure 1(a)). Country-level diet diversity
ket availability associated with climate disruptions        ranged from a high of 4.77 in Colombia to a low of
[27]. Child malnutrition has been associated with           1.80 in Lesotho (SI appendix table S2 and figure S1).
decreases in rainfall in Rwanda, Kenya, Mexico and          Additional information for all variables utilized in
Swaziland [28–31] as well as drought [5, 32–35] and         this analysis (means and standard deviations) as a
floods [17, 33] at the regional or country level. Associ-   whole and across regions is in SI appendix table S3.
ations between temperature and child stunting/wast-
ing are less explored [12], but there is evidence that      2.2. Hierarchical models
climate shocks are associated with child stunting via       A hierarchical model with data from 19 coun-
warmer temperatures in the previous dry season in           tries and more than 107 000 individual observa-
Mexico [30]. Temperature anomalies have also been           tions finds a number of climate variables and agroe-
found to be associated with moderate stunting in            cological, geographic, and socioeconomic controls
Ethiopia [36].                                              that correlate with child diet diversity (figure 2).

                                               2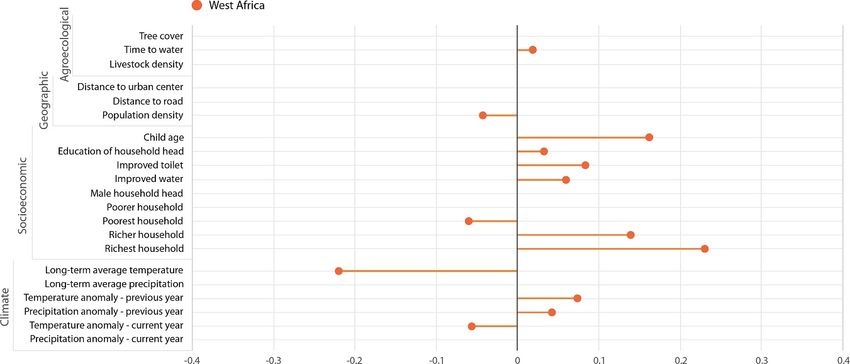
Environ. Res. Lett. 16 (2021) 015010                                                                                     M T Niles et al

Table 1. Agroecological, geographic, and socioeconomic variables used in the study, with descriptions and sources. Additional details
about the variables are described in more complete detail in the methods.

Variable type       Variable name                 Variable description                                      Unit                Source

Diet Diversity      Diet diversity           FAO individual diet diversity score (IDDS),                    Number 0–10         [39]
                                             scale ranging from 0 to 10 based on intake of
                                             10 foods including cereal grains, white tubers
                                             and root foods, dark leafy greens, vitamin A rich
                                             vegetables/tubers, vitamin A rich fruits, other
                                             fruits and vegetables, meat and fish foods, eggs,
                                             legumes/nuts/seeds, and milk and milk products
Agroecological      Tree cover               Percent tree cover within a 20 km radius of                    % tree cover        [40]
                                             cluster
                    Time to water            Time from household to get to water source                     Minutes             [39]
                                             (min)
                    Livestock density        Ruminant livestock density at cluster 10 km                    Tropical            [41]
                                             grid circa 2000; expressed as tropical livestock               livestock units
                                             units (TLU) (1: less than 1 TLU; 2: 1–5 TLU; 3:                (TLU)
                                             5–10 TLU; 4: 10–20 TLU; 5: 20–50 TLU; 6: 50–
                                             100 TLU; 7: 100–200 TLU; 8: more than 200 TLU;
                                             9: water)
Geographic          Distance to urban center Distance from a cluster to its nearest urban center            Meters              [42]
                                             (settlement with 5000 or more inhabitants) circa
                                             2000
                    Distance to road         Distance to nearest road                                       Meters              [43]
                    Population density       Average population density within 5 km buffer                  People per km2      [44]
                                             around cluster (density in 2000 for 2000–2004
                                             surveys, density in 2005 for 2005–2009 surveys,
                                             and density in 2010 for 2010–2013 surveys)
Socioeconomic       Child age                Age of child                                                   Months
                    Education of household Education years of head of household                             Years
                    head
                    Improved toilet          Improved sanitation                                            Binary
                    Improved water           Improved water based on WHO definitions                        Binary              [39]
                    Male household head      Household head male                                            Binary
                                                                                                            male/female
                    Poorer household              Binary being poorer—as compared to being
                                                  average
                    Poorest household             Binary being poorest—as compared to being                 Full category is
                                                  average                                                   poorest, poorer,
                    Richer household              Binary—richer—as compared to being average                average, richer,
                    Richest household             Binary—richest—as compared to being average               richest
Climate             Long-term average             Average of 30 years of CHIRTS monthly data                Degrees C        [45]
                    temperature                   between initial year of data and survey month
                    Long-term average             Average of 30 years of CHIRPS monthly data                Centimeters         [46]
                    precipitation                 between initial year of data and survey month
                    Temperature anomaly—          Number of standard deviations below or above              Standard            [45]
                    previous year                 long-term average in the year prior to the survey         deviations
                    Precipitation anomaly—        Number of standard deviations below or above              Standard            [46]
                    previous year                 long-term average in the year prior to the survey         deviations
                    Temperature anomaly—          Number of standard deviations below or above              Standard            [45]
                    current year                  long-term average in the year of survey                   deviations
                    Precipitation anomaly—        Number of standard deviations below or above              Standard            [46]
                    current year                  long-term average in the year of survey                   deviations

Factors associated with reductions in diet diversity                  to the survey (SI appendix table S4 and figure 2).
include greater distance to urban centers and roads,                  While wealth is the greatest correlate predicting
higher livestock density, male-headed households,                     diet diversity, long-term average temperature and
poor households, and higher long-term average tem-                    higher-than-average precipitation in the previous
peratures (SI appendix table S4 and figure 2). Factors                year correlate with diet diversity at levels equal to or
associated with increases in diet diversity include                   greater than many variables that are often a focus of
child age, years of education for the household head,                 current development policy, including market access
use of an improved toilet, household wealth, and                      (i.e. distance to urban center), livestock density, edu-
higher-than-average precipitation in the year prior                   cation, and gender.

                                                       3
Environ. Res. Lett. 16 (2021) 015010 M T Niles et al
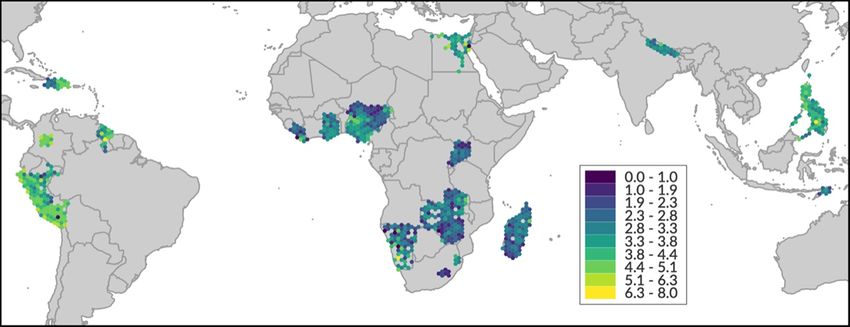
Figure 1. Child individual diet diversity score across 19 countries in the Demographic Health Surveys dataset. Color gradients
indicate the number of food groups eaten by children in the household in the last 24 h prior to the survey. Among the surveyed
countries, diet diversity is highest in South America and lowest in Southeast Africa.
Figure 2. Standardized coefficient effects of different agroecological, geographic, socioeconomic, and climate factors on child diet
diversity across 19 countries. Dark circles indicate statistically significant coefficients (p < 0.05); grey dots are insignificant. Lines
drawn from 0 to a coefficient point are only to clearly highlight the varying level of effects. Points to the left of zero (negative
coefficients) indicate the variable is associated with decreased diet diversity while those to the right of zero (positive coefficients)
indicate the variable is associated with increased diet diversity. Full model estimates are found in SI appendix table S4.
2.3. Regional models prior to the survey was significantly correlated with
Regional models demonstrate similar trends as those greater diet diversity in Central America and West
shown in full dataset models (figure 3). In five out Africa.
of six regions, higher temperature (either long-term Similar to the full dataset model, we find sev-
averages or short-term anomalies) have a consistent eral instances in which climate factors have a relat-
negative relationship with child diet diversity. Reduc- ively large impact on diet diversity outcomes as com-
tions in diet diversity are significantly associated with pared to many control variables. For example, tem-
higher long-term average temperatures in Southeast perature has a greater effect on diet diversity than
Africa and West Africa, higher than average temperat- at least some agroecological, geographic or socioeco-
ures in the year prior to the survey in North Africa and nomic controls in all regions but Central America. In
South America, and higher than average temperatures many cases, these control variables are the focus of
in the year of the survey in Asia, Southeast Africa, and development programs, including education, gender-
West Africa. In half of our regional models, precip- based programs, road and market access, poverty alle-
itation variables also had a significant, and consist- viation, and improved sanitation.
ently positive, relationship to diet diversity. Higher
long-term average precipitation was significantly cor- 2.4. West Africa case study
related with greater diet diversity in Southeast Africa, To explore regional relationships in more detail, we
while greater precipitation than average in the year examine West Africa as a case study (figure 4), because
4Environ. Res. Lett. 16 (2021) 015010 M T Niles et al
Figure 3. Significant standardized coefficients (p < 0.05) of different agroecological, geographic, socioeconomic, and climate
factors on child diet diversity across 19 countries. Points indicate coefficients for each region, and only statistically significant
coefficients are shown. Points to the left of zero (negative coefficients) indicate the variable is associated with decreased diet
diversity while dots to the right of zero (positive coefficients) indicate the variable is associated with increased diet diversity in a
given place. Underlying grey lines between coefficient plots indicate the full range of coefficients across all models. Full regional
model results including non-significant coefficients appear in SI appendix tables S5–S10.
it had the greatest number of significant climate within the study is very low, with a global average of
effects. In West Africa, we find that higher long- children eating slightly more than three varied food
term average temperatures have a greater negative groups daily in our sample. While there are no estab-
relationship to diet diversity than being in the poorest lished cut-off points to indicate adequate or inad-
households in the region. Higher temperature also equate dietary diversity [37], these results are signi-
outweighs the positive relationships between diet ficantly lower, on average, than has been found in
diversity and education, improved toilets, access to middle income countries such as China [47], but is
improved water, and wealth. Higher-than-average consistent with child diet diversity scores in similar
precipitation in the year prior to the survey also countries in Africa [48, 49].
had a greater relationship to diet diversity than Our research suggests that both long- and short-
population density or education of the household term temperature increases have a significant rela-
head. Further, it is worth noting that higher-than- tionship with child diet diversity internationally and
average temperatures in the previous year were asso- regionally. This evidence is important, since the effect
ciated with increases in diet diversity, counter to of temperature on child malnutrition outcomes has
all other models. However, in West Africa, higher- not been extensively explored [12], with the majority
than-average precipitation in the previous year cor- of previous studies focusing on rainfall, drought, and
related with greater diet diversity, suggesting that the floods (e.g. [13, 29, 33, 35]). However, our models
coupling of both higher temperatures and greater indicate consistent relationships between high tem-
rainfall may explain higher diet diversity in the perature and lower diet diversity in nearly all regions.
region. In some regions (i.e. Southeast Africa and Western
Africa) we find relationships between temperature
3. Discussion and diet across multiple temporal scales, with both
long-term average temperature increases and acutely
In the largest global study to date exploring the con- hotter-than-average years associated with reductions
nections between child diet diversity and recent cli- in child diet diversity. This provides new and broad
mate, we find international and regional evidence geographic evidence that both long-term warming
that temperature and precipitation significantly cor- temperatures and acutely hot years may have consist-
relate with diet diversity and in many cases have ently negative impacts on diet diversity, which in turn
a larger impact than agroecological, geographic, or also may negatively affect child stunting and wasting.
sociodemographic variables. Most importantly, we There are likely both direct and indirect path-
find that climate factors, especially temperature, have ways that influence this relationship. Higher temper-
a greater relative negative impact on diet diversity atures can directly impact the yield of many globally
than the positive relationship of many factors that are important staple crops (e.g. [50, 51]). Higher temper-
often the target of development interventions, includ- atures can also affect the physiology of animals and
ing education, water and sanitation, and poverty alle- may reduce livestock productivity and also increase
viation. We also find that overall child diet diversity livestock water consumption [52]. Both of these
5Environ. Res. Lett. 16 (2021) 015010 M T Niles et al
Figure 4. Significant standardized effects (p < 0.05) of different agroecological, geographic, socioeconomic, and climate factors on
child diet diversity in West Africa. Results highlight the relatively-large effect of temperature on diet diversity as compared to
other development efforts such as education, water, and sanitation interventions. Lines drawn from 0 to a coefficient point are
only to clearly highlight the varying level of effects. Full regional West Africa model results appear in SI appendix table S10.
pathways could influence the amount and quality of relationship between climate and weather factors and
food available in a given region and thereby affect food security are numerous and not immediate, with
food prices and access [12]. Higher temperatures also availability affecting food prices and access, leading
have known physiological impacts on human beings. to nutritional impacts over time [12]. As such, we can
Women who are pregnant during hot spells often expect that precipitation changes may have both acute
deliver babies with lower birth weights [53]. Indir- impacts and longer-term anticipated outcomes.
ectly, higher temperatures also have the potential Much of the existing research on climate and its
to influence the macro and micronutrient content relationship to child malnutrition and diet outcomes
of a variety of crops, which may not directly affect suggests that investments in development may help
the overall number of diet categories consumed, but to overcome the negative impacts of a changing cli-
could contribute to micronutrient deficiencies over mate. For example, both [56] and [29] argue that
time [54]. while a warmer and drier future may lead to mal-
Precipitation’s relationship to diet diversity in half nourished children, education and basic infrastruc-
of our models was consistently positive, which gen- ture may help overcome these outcomes. However,
erally follows the existing evidence that dry condi- our study suggests that higher temperatures may have
tions are correlated with lower diet diversity and other greater impacts on diet diversity than the presence
child malnutrition outcomes [13]. Our models gener- of many common development investments includ-
ally show that higher precipitation in the year prior ing education, water and sanitation improvements,
to the survey, as compared to the long-term aver- and road infrastructure in low and middle-income
age of a given region, positively correlates with diet countries. This is deeply concerning; it indicates that
diversity. Others have shown that the opposite can in many regions these positive socioeconomic and
also be true: short-term reductions in rainfall can demographic changes may not be adequate to out-
negatively impact child nutrition [55]. Similar to tem- weigh the negative effects of a changing climate going
perature impacts, there are likely direct and indirect forward.
pathways that lead to these outcomes [12]. Mostly While there has been considerable discussion of
obviously, the direct impact of a reduction in rainfall potential adaptation efforts to safeguard food secur-
can lead to a reduction in agricultural productivity, ity and nutritional outcomes, empirical evidence to
with these impacts most profound in drought con- assess the relationship between climate adaptation
ditions [35]. Our models suggest that the greater the and human nutrition is still nascent with incon-
reduction in precipitation in a given place compared sistent outcomes. Given both the direct and indir-
to their long-term average, the greater the impact ect pathways in which climate can affect agriculture
on diet diversity. Furthermore, the impact of pre- and nutrition, potential adaptation efforts should
cipitation on diet quality likely has lag effects, with take a food systems approach [57]. Agricultural
the previous year’s precipitation reductions impact- adaptations could focus on both agroecological and
ing that year’s harvest leading to potential impacts on crop improvement pathways. For example, child-
food insecurity and malnutrition the following year hood deficiencies of Vitamin A and zinc have the
when there is not as much food to eat. Indeed, the greatest relative impact on childhood malnutrition
6Environ. Res. Lett. 16 (2021) 015010 M T Niles et al
outcomes [58], providing an important area of focus have a relatively greater impact on diet diversity
for crop breeding. Furthermore, recent evidence outcomes as compared to other controls variables,
also highlights that agroecological interventions pur- including some that are commonly promoted for
sued for climate adaptation improved household diet development-oriented projects. This suggests that
diversity outcomes in Malawi [59]. Other potential safeguarding child diet diversity, and related nutrition
adaptation strategies could fall across the suite of outcomes, requires adaptation efforts explicitly con-
the control variables we considered. New evidence sidering climate, though our empirical understanding
highlights the complementary ways in which envir- of these remains limited. Future research can explore
onmental conservation (e.g. forest preservation) may these potential adaptation strategies and their out-
have beneficial outcomes for child health outcomes comes, as well as examine the impact of climate on
including malnutrition [10, 11, 14]; however, the diet diversity outcomes at different scales, and ideally,
mechanisms for this relationship and possible adapt- with long-term panel data.
ation interventions remain limited [60]. There is also
a rising understanding of the role that social net-
5. Methods
works can play for improving household food security
outcomes [60], which may be particularly critical for
We utilize multiple datasets, joined together through
marginalized households.
longitude and latitude, to develop an integrated data-
Given the complexity of these relationships, there
set to assess child diet diversity outcomes across 19
is an immediate need to increase our poor under-
countries and six regions. Below we describe the data-
standing of climate adaptation efforts to safeguard
sets as well as our statistical approaches. Table 1
childhood nutrition [60], especially for vulnerable
provides an overview of all of the variables utilized in
populations in low and middle-income countries
this analysis.
across the tropics where the most profound climate
changes are expected. To achieve a better understand-
ing of the potential adaptation strategies that may 5.1. Demographic health surveys
help improve child nutrition in a changing climate The main basis of our analysis builds off a com-
requires a shift away from the ways traditional food pilation of DHS datasets, which are nationally rep-
security research is conducted. Food assistance or resentative data on population demography, health
interventions that fail to consider the complexity of and nutrition, from 2000 to 2013 (SI appendix for
food systems as well as the trickle-down effect that individual countries and years of surveys). For NSF
climate can have across that system will fall short SESYNC Grant DBI-1052875 we consolidated DHS
in response. This requires a need to design studies across 47 countries. We normalized survey responses
explicitly for assessing interventions for their climate across these countries for over 200 DHS variables.
adaptation potential, rather than purely their nutri- We used geocoded cluster references to add economic
tional assistance potential in the current state. These and ecological data to the health and household data
efforts could involve a better integration of climate of DHS (see [62] for details). Here we compile data
data with health data across global datasets, but there across 19 developing countries in Africa, Central and
remain many challenges with current data scale and South America, and Southeast Asia for geographic
scope, especially with a lack of comprehensive long- diversity of this original aggregated dataset. The DHS
term panel data to enable causal inference [12]. Fur- dataset was subsampled to select only the variables
thermore, statistical approaches may limit capacity of interest (including complete data for diet diversity,
to fully assess the social and behavioral aspects of which was limited), based on previous research, and
adaptation and household dynamics related to diet some minor data cleaning was applied where neces-
diversity in a changing world; agent-based models sary (for example, standardizing the encoding of
and other social modeling may help solve this gap. missing values across the dataset). Our key dependent
However, it is also critical that as the evidence for variable—an individual diet diversity score (IDDS)—
action increases, scaling up of any adaptation inter- is constructed through a series of questions in the
ventions come with additional resources and support DHS related to dietary intake of children under five.
to ensure that programs that expand can achieve the The IDDS is based on the United Nations Food and
same health and nutrition outcomes as their original Agriculture Organization [63], and is a scale ranging
focus [61]. from 0 to 10 based on intake of 10 types of foods
including: (a) cereal grains; (b) white tubers and root
4. Conclusion foods; (c) dark leafy greens; (d) vitamin A rich veget-
able/tubers; (e) vitamin A rich fruits; (f) other fruits
In this large-scale, multi-country analysis, we demon- and vegetables; (g) meat and fish foods; (h) eggs; (i)
strate the relationship between climate on child diet legumes/nuts/seeds; and (j) milk and milk products.
diversity outcomes, including temperature, which has We incorporate other variables of interest as described
not been previously widely recognized. Our work in table 1, which include variables from both the DHS
demonstrates that climate variables in some regions surveys as well as other global datasets.
7Environ. Res. Lett. 16 (2021) 015010 M T Niles et al
5.2. Climate data We include a random effect for the country and DHS
The Climate Hazards Group InfraRed Precipita- cluster identification number, which is a geographic
tion with Station (CHIRPS) dataset combines 0.05◦ stratification, chosen by the survey designers, usu-
resolution satellite imagery with in-situ station data ally containing 25–30 households that are in relatively
to generate 30 years of local rainfall timeseries data close proximity. Hierarchical models are structured
across most of the globe at a 1 month temporal res- with nested units [64]; in our case, households, nes-
olution. The Climate Hazards Group InfraRed Tem- ted in DHS clusters, nested in countries, included as
perature with Station (CHIRTS) dataset uses sim- random effects. We run six regional models (West
ilar methods to generate gridded timeseries temper- Africa, Southeast Africa, North Africa/Middle East,
ature data. We obtained CHIRP/TS data according to Asia, South America and Central America) as well as
the latitude and longitude of each survey location in one global model. In total, our models represent the
the DHS dataset. We obtained all available historical data from 107 741 individual responses across these
timeseries CHIRP/TS datapoints for each geospatial regions.
location, and coded each row with latitude, longitude,
and DHS date identifiers. Data availability statement
Based on the survey month, we calculated sev-
eral temperature and precipitation columns from the The data that support the findings of this study
raw timeseries CHIRP/TS data. We selected current are available upon reasonable request from the
and previous month values from the raw data. We authors. The code supporting this work is avail-
calculated annual means by averaging the 12 months able at https://github.com/dbemerydt/climate-diet-
prior to and including the survey month. We calcu- diversity. Data will be available from 16 January 2020.
lated long-term averages by averaging monthly val- June 2020.
ues across all full years between the survey month
and the beginning of the CHIRP/TS timeseries. For
example, if there were 124 months of available data Acknowledgments
preceding the survey month, only 120 months (10 full
years) were included in the long-term average to avoid We are grateful to direct funding support from
skewing the result by including an extra set of winter the USDA Hatch Program (Grant No. VT-H02303,
months. In the event that an individual monthly data- Accession Number 1010486), and for funding sup-
point within the long-term data window was missing, port for the dataset from the Grant Biodiversity Res-
we inputted its value based on the long-term aver- ults and Integrated Development Gains Enhanced
age for that month. We stipulated that the long-term Program of the USAID, the Luc Hoffman Institute
CHIRP/TS average would only be included if 10 full at WWF International under funding from the Mava
years of data were available prior to the survey month. Foundation, and the National Socio-Environmental
We generated columns representing long-term Synthesis Center with funding from the National Sci-
climatic variability by calculating the standard devi- ence Foundation DBI-1052875. We thank Thomas
ation across all monthly datapoints within the long- Wentworth for figure design assistance throughout
term temperature and precipitation averages. the manuscript.
Additionally, we include a column representing
the average number of months per year within the ORCID iDs
long-term data in which the temperature was over
32.2 ◦ C (90 ◦ F), and another for average number of Meredith T Niles https://orcid.org/0000-0002-
months per year in which there was less than 25 cm 8323-1351
of precipitation. Molly E Brown https://orcid.org/0000-0001-7384-
Binary anomaly variables were generated indicat- 3314
ing whether the survey month and previous month
were drier or hotter than the long-term average for References
that month, and also whether the survey year and
[1] Arthur S S, Nyide B, Soura A B, Kahn K, Weston M and
previous year were drier/hotter than the annual long-
Sankoh O 2015 Tackling malnutrition: a systematic review of
term average. We also calculated columns represent- 15-year research evidence from INDEPTH health and
ing the number of standard deviations above or below demographic surveillance systems Glob. Health Action
the long term average for the survey year and previous 8 28298
[2] Bhutta Z A et al 2017 Severe childhood malnutrition Nat.
year.
Rev. Dis. Primers 3 17067
[3] Steyn N P, Nel J H, Nantel G, Kennedy G and Labadarios D
5.3. Hierarchical models 2006 Food variety and dietary diversity scores in children:
To assess the relationship of agroecological, geo- are they good indicators of dietary adequacy? Public Health
Nutr. 9 644–50
graphic, socioeconomic, and climate variables on
[4] Asghari G, Mirmiran P, Yuzbashian E and Azizi F 2017 A
IDDS, we utilize a series of regional and full data- systematic review of diet quality indices in relation to obesity
set hierarchical linear models with random effects. Br. J. Nutr. 117 1055–65
8Environ. Res. Lett. 16 (2021) 015010 M T Niles et al
[5] Mueller I and Smith T A 1999 Patterns of child growth in [24] Reddy V, Devi M J and Anbumozhi V 2019 Ensuring food
Papua New Guinea and their relation to environmental, and nutritional security in the face of disasters and climate
dietary and socioeconomic factors—further analyses of the change: what is the adaptive solution? Towards a Resilient
1982–1983 Papua New Guinea National Nutrition Survey P. ASEAN Volume 1: Disasters, Climate Change, and Food
N. G. Med. J. 42 94–113 Security: Supporting ASEAN Resilience, ed V Anbumozhi,
[6] Panter-Brick C 1997 Seasonal growth patterns in rural M Breiling and V Reddy (Jakarta, Indonesia: Economic
Nepali children Ann. Hum. Biol. 24 1–18 Research Institute for ASEAN and East Asia) pp 290–330
[7] Rah J H, Akhter N, Semba R D, Pee S D, Bloem M W, [25] DeNicola N G, Bekkar B, Pacheco S, Basu R and Scoping A
Campbell A A, Moench-Pfanner R, Sun K, Badham J and 2019 Review of climate-change related exposures on
Kraemer K 2010 Low dietary diversity is a predictor of child obstetrics outcomes [18G] Obstet. Gynecol. 133 78S
stunting in rural Bangladesh Eur. J. Clin. Nutr. 64 1393–8 [26] Zhang Y, Yu C and Wang L 2017 Temperature exposure
[8] Kim R, Mejía-Guevara I, Corsi D J, Aguayo V M and during pregnancy and birth outcomes: an updated
Subramanian S V 2017 Relative importance of 13 correlates systematic review of epidemiological evidence Environ.
of child stunting in South Asia: insights from nationally Pollut. 225 700–12
representative data from Afghanistan, Bangladesh, India, [27] Brown M E, Carr E R, Grace K L, Wiebe K, Funk C C,
Nepal, and Pakistan Soc. Sci. Med. 187 144–54 Attavanich W, Backlund P and Buja L 2017 Do markets and
[9] FAO 2018 The State of Food Security and Nutrition in the trade help or hurt the global food system adapt to climate
World (http://www.fao.org/state-of-food-security-nutrition/ change? Food Policy 68 154–9
2018/en) [28] Akresh R, Verwimp P and Bundervoet T 2011 Civil war, crop
[10] Galway L P, Acharya Y and Jones A D 2018 Deforestation failure, and child stunting in Rwanda Econ. Dev. Cult.
and child diet diversity: a geospatial analysis of 15 Change 59 777–810
Sub-Saharan African countries Health Place 51 78–88 [29] Grace K, Davenport F, Funk C and Lerner A M 2012
[11] Johnson K B, Jacob A and Brown M E 2013 Forest cover Child malnutrition and climate in Sub-Saharan Africa: an
associated with improved child health and nutrition: analysis of recent trends in Kenya Appl. Geogr.
evidence from the Malawi Demographic and Health Survey 35 405–13
and satellite data Glob. Health Sci. Pract. 1 237–48 [30] Skoufias E and Vinha K 2012 Climate variability and
[12] Phalkey R K, Aranda-Jan C, Marx S, Höfle B and Sauerborn child height in rural Mexico Econ. Hum. Biol.
R 2015 Systematic review of current efforts to quantify the 10 54–73
impacts of climate change on undernutrition Proc. Natl [31] Huss-Ashmore R and Curry J J 1994 Diet, nutrition, and
Acad. Sci. 112 E4522–29 agricultural development in Swaziland. 3. Household
[13] Cooper M W, Brown M E, Hochrainer-Stigler S, Pflug G, economics and demography Ecol. Food Nutr. 33 107–21
McCallum I, Fritz S, Silva J and Zvoleff A 2019 Mapping the [32] Alderman H 2010 Safety nets can help address the risks to
effects of drought on child stunting Proc. Natl Acad. Sci. nutrition from increasing climate variability J. Nutr.
116 17219–24 140 148S–52S
[14] Rasolofoson R A, Hanauer M M, Pappinen A, Fisher B and [33] Rodriguez-Llanes J M, Ranjan-Dash S, Degomme O,
Ricketts T H 2018 Impacts of forests on children’s diet in Mukhopadhyay A and Guha-Sapir D 2011 Child
rural areas across 27 developing countries Sci. Adv. malnutrition and recurrent flooding in rural eastern India: a
4 eaat2853 community-based survey BMJ Open 1 e000109
[15] Shively G E 2017 Infrastructure mitigates the sensitivity of [34] Chotard S, Mason J B, Oliphant N P, Mebrahtu S and Hailey
child growth to local agriculture and rainfall in Nepal and P 2010 Fluctuations in wasting in vulnerable child
Uganda Proc. Natl Acad. Sci. 114 903–8 populations in the greater horn of Africa Food Nutr. Bull.
[16] Mbwana H A, Kinabo J, Lambert C and Biesalski H K 2017 31 S219–33
Factors influencing stunting among children in rural [35] Belesova K, Agabiirwe C N, Zou M, Phalkey R and
Tanzania: an agro-climatic zone perspective Food Secur. Wilkinson P 2019 Drought exposure as a risk factor for child
9 1157–71 undernutrition in low- and middle-income countries: a
[17] Gaire S, Delbiso T D, Pandey S and Guha-Sapir D 2016 systematic review and assessment of empirical evidence
Impact of disasters on child stunting in Nepal Risk Manage. Environ. Int. 131 104973
Healthcare Policy 9 113–27 [36] Hagos S, Lunde T, Mariam D H, Woldehanna T and
[18] Lee J, Houser R F, Must A, de Fulladolsa P P and Bermudez Lindtjørn B 2014 Climate change, crop production and child
O I 2010 Disentangling nutritional factors and household under nutrition in Ethiopia; a longitudinal panel study BMC
characteristics related to child stunting and maternal Public Health 14 884
overweight in Guatemala Econ. Hum. Biol. 8 188–96 [37] United Nations Food and Agriculture Organization 2019
[19] Cumming O and Cairncross S 2016 Can water, sanitation The State of Food Security and Nutrition in the World 2019
and hygiene help eliminate stunting? Current evidence and (http://www.fao.org/3/ca5162en/ca5162en.pdf)
policy implications Matern. Child Nutr. 12 91–105 [38] Custodio E, Herrador Z, Nkunzimana T,
[20] Beal T, Tumilowicz A, Sutrisna A, Izwardy D and Neufeld L We˛ziak-Białowolska D, Perez-Hoyos A and Kayitakire F 2019
M 2018 A review of child stunting determinants in Indonesia Children’s dietary diversity and related factors in Rwanda
Matern. Child Nutr. 14 e12617 and Burundi: a multilevel analysis using 2010 Demographic
[21] Dearden K A, Schott W, Crookston B T, Humphries D L, and Health Surveys PloS One 14 e0223237
Penny M E and Behrman J R 2017 Children with access to [39] United States Agency for International Development
improved sanitation but not improved water are at lower risk Demographic Health Surveys (https://dhsprogram.com/
of stunting compared to children without access: a cohort Data/)
study in Ethiopia, India, Peru, and Vietnam BMC Public [40] University of Maryland 2017 Global Land Cover Facility
Health 17 110 (https://geog.umd.edu/feature/global-land-cover-facility-
[22] Rah J H, Cronin A A, Badgaiyan B, Aguayo V M, Coates S %28glcf%29)
and Ahmed S 2015 Household sanitation and personal [41] FAO 2010 IIASA, Global Agro-ecological Zones (GAEZ v3.0)
hygiene practices are associated with child stunting in rural (http://www.gaez.iiasa.ac.at/)
India: a cross-sectional analysis of surveys BMJ Open [42] Millennium Ecosystem Assessment (Program) 2005
5 e005180 Ecosystems and Human Well Being: Synthesis (Washington,
[23] Semba R D, de Pee S, Sun K, Sari M, Akhter N and Bloem M DC: Island Press)
W 2008 Effect of parental formal education on risk of child [43] NASA Socioeconomic Data and Applications Center Global
stunting in Indonesia and Bangladesh: a cross-sectional Roads Open Access Data Set (gROADS) (https://sedac.ciesin.
study Lancet 371 322–8 columbia.edu/data/set/groads-global-roads-open-access-v1)
9Environ. Res. Lett. 16 (2021) 015010 M T Niles et al
[44] NASA Socioeconomic Data and Applications Center 2016 [55] Epstein A, Torres J M, Glymour M M, López-Carr D and
Gridded Population of the World (https://sedac.ciesin. Weiser S D 2019 Do deviations from historical precipitation
columbia.edu/data/collection/gpw-v4) trends influence child nutrition? An analysis from Uganda
[45] Funk C et al 2019 A high-resolution 1983–2016 Tmax Am. J. Epidemiol. 188 1953–60
climate data record based on infrared temperatures and [56] Davenport F, Grace K, Funk C and Shukla S 2017 Child
stations by the Climate Hazard Center J. Clim. 32 5639–58 health outcomes in sub-Saharan Africa: a comparison of
[46] Funk C et al 2015 The climate hazards infrared precipitation changes in climate and socio-economic factors Glob.
with stations—a new environmental record for monitoring Environ. Change 46 72–87
extremes Sci. Data 2 150066 [57] HLPE (High Level Panel of Experts on Food Secruity and
[47] Zhao W, Yu K, Tan S, Zheng Y, Zhao A, Wang P and Zhang Y Nutrition) 2016 Sustainable agricultural development for
2017 Dietary diversity scores: an indicator of micronutrient food security and nutrition: what roles for livestock? Rome
inadequacy instead of obesity for Chinese children BMC (http://www.fao.org/3/a-i5795e.pdf)
Public Health 17 440 [58] Black R E, Allen L H, Bhutta Z A, Caulfield L E, de Onis M,
[48] Girard A W et al 2017 Women’s empowerment is associated Ezzati M, Mathers C and Rivera J 2008 Maternal and child
with maternal and child diet diversity but not household undernutrition: global and regional exposures and health
food security in pastoral communities in Tanzania Faseb J. consequences Lancet 371 243–60
31 455.5 [59] Bezner Kerr R et al 2019 Participatory agroecological
[49] Koppmair S, Kassie M and Qaim M 2017 Farm production, research on climate change adaptation improves smallholder
market access and dietary diversity in Malawi Public Health farmer household food security and dietary diversity in
Nutr. 20 325–35 Malawi Agric. Ecosyst. Environ. 279 109–21
[50] Asseng S et al 2015 Rising temperatures reduce global wheat [60] Bailey M K, McCleery A R, Barnes G and McKune L S 2019
production Nat. Clim. Change 5 143–7 Climate-driven adaptation, household capital, and
[51] Peng S, Huang J, Sheehy J E, Laza R C, Visperas R M, Zhong nutritional outcomes among farmers in Eswatini Int. J.
X, Centeno G S, Khush G S and Cassman K G 2004 Rice Environ. Res. Public Health 16 4063
yields decline with higher night temperature from global [61] Weber A M, Galasso E and Fernald L C H 2019 Perils of
warming Proc. Natl Acad. Sci. USA 101 9971–5 scaling up: effects of expanding a nutrition programme in
[52] Rojas-Downing M M, Nejadhashemi A P, Harrigan T and Madagascar Matern. Child Nutr. 15 e12715
Woznicki S A 2017 Climate change and livestock: impacts, [62] Herrera D, Ellis A, Fisher B, Golden C D, Johnson K,
adaptation, and mitigation Clim. Risk Manage. 16 145–63 Mulligan M, Pfaff A, Treuer T and Ricketts T H 2017
[53] Grace K, Davenport F, Hanson H, Funk C and Shukla S 2015 Upstream watershed condition predicts rural children’s
Linking climate change and health outcomes: examining the health across 35 developing countries Nat. Commun. 8 811
relationship between temperature, precipitation and birth [63] United Nations Food and Agriculture Organization 2011
weight in Africa Glob. Environ. Change 35 125–37 Guidelines for measuring household and individual dietary
[54] Zhu C et al 2018 Carbon dioxide (CO2 ) levels this century diversity (http://www.fao.org/3/i1983e/i1983e.pdf)
will alter the protein, micronutrients, and vitamin content of [64] Raudenbush S W 1993 Hierarchical linear models and
rice grains with potential health consequences for the experimental design Statistics: Textbooks and Monographs, ed
poorest rice-dependent countries Sci. Adv. 4 eaaq1012 L K Edwards (New York, USA: Marcel Dekker) pp 459–96
10You can also read


