Analysis of Facial Expressions: Explaining Affective State and Trust-Based Decisions during Interaction with Automation - Dtic
←
→
Page content transcription
If your browser does not render page correctly, please read the page content below
ARL-TR-8945 ● APR 2020

Analysis of Facial Expressions: Explaining
Affective State and Trust-Based Decisions
during Interaction with Automation

by Catherine Neubauer, Gregory Gremillion, Kristin E
Schaefer, Brandon S Perelman, Claire La Fleur, and Jason S
Metcalfe

Approved for public release; distribution is unlimited.
NOTICES
                                    Disclaimers
The findings in this report are not to be construed as an official Department of the
Army position unless so designated by other authorized documents.
Citation of manufacturer’s or trade names does not constitute an official
endorsement or approval of the use thereof.
Destroy this report when it is no longer needed. Do not return it to the originator.
ARL-TR-8945 ● APR 2020

Analysis of Facial Expressions: Explaining
Affective State and Trust-Based Decisions
during Interaction with Automation

Catherine Neubauer, Gregory Gremillion, Kristin E Schaefer, Brandon
S Perelman, Claire La Fleur, and Jason S Metcalfe
Human Research and Engineering Directorate, CCDC Army Research Laboratory

Approved for public release; distribution is unlimited.

Form Approved
                                 REPORT DOCUMENTATION PAGE                                                                                                         OMB No. 0704-0188
Public reporting burden for this collection of information is estimated to average 1 hour per response, including the time for reviewing instructions, searching existing data sources, gathering and maintaining the
data needed, and completing and reviewing the collection information. Send comments regarding this burden estimate or any other aspect of this collection of information, including suggestions for reducing the
burden, to Department of Defense, Washington Headquarters Services, Directorate for Information Operations and Reports (0704-0188), 1215 Jefferson Davis Highway, Suite 1204, Arlington, VA 22202-4302.
Respondents should be aware that notwithstanding any other provision of law, no person shall be subject to any penalty for failing to comply with a collection of information if it does not display a currently
valid OMB control number.
PLEASE DO NOT RETURN YOUR FORM TO THE ABOVE ADDRESS.
1. REPORT DATE (DD-MM-YYYY)                             2. REPORT TYPE                                                                      3. DATES COVERED (From - To)
April 2020                                              Technical Report                                                                    2016–2020
4. TITLE AND SUBTITLE                                                                                                                       5a. CONTRACT NUMBER
Analysis of Facial Expressions: Explaining Affective State and Trust-Based
Decisions during Interaction with Automation                                                                                                5b. GRANT NUMBER

                                                                                                                                            5c. PROGRAM ELEMENT NUMBER

6. AUTHOR(S)                                                                                                                                5d. PROJECT NUMBER
Catherine Neubauer, Gregory Gremillion, Kristin E Schaefer, Brandon S                                                                       W911-NF-12-2-0019
Perelman, Claire La Fleur, and Jason S Metcalfe                                                                                             5e. TASK NUMBER

                                                                                                                                            5f. WORK UNIT NUMBER

7. PERFORMING ORGANIZATION NAME(S) AND ADDRESS(ES)                                                                                          8. PERFORMING ORGANIZATION REPORT NUMBER
CCDC Army Research Laboratory
ATTN: FCDD-RLH-FA                                                                                                                           ARL-TR-8945
Aberdeen Proving Ground, MD 21005
9. SPONSORING/MONITORING AGENCY NAME(S) AND ADDRESS(ES)                                                                                     10. SPONSOR/MONITOR'S ACRONYM(S)

                                                                                                                                            11. SPONSOR/MONITOR'S REPORT NUMBER(S)

12. DISTRIBUTION/AVAILABILITY STATEMENT
Approved for public release; distribution is unlimited.
13. SUPPLEMENTARY NOTES
ORCID ID(s): Catherine Neubauer, 0000-0002-6686-3576; Gregory Gremillion, 0000-0002-0205-688X; Kristin E Schaefer,
0000-0002-1342-3446; Brandon S Perelman, 0000-0001-6558-0286; and Jason S Metcalfe, 0000-0001-9086-9962
14. ABSTRACT
Trust is a critical factor in the development and maintenance of effective human-autonomy teams. This becomes more
important as the technology advances in independent and interdependent decision-making with humans, especially in high-
risk dynamic environments. As such, new processes are needed to classify an individual’s affective state change that could be
related to either an accurate or a misaligned change in trust that occurs during collaboration. The task for the current study was
a simulated leader–follower driving task with two different types of driving automation (Level 2: full vs. Level 1: speed only)
and across two different automation reliability levels (good vs. bad). Facial expression analysis and subjective questionnaire
measurement were evaluated to gauge group differences in affect-based trust. Through a novel analysis approach, results
indicated that the participant sample was best described by four distinct group clusters based on demographics, personality
traits, response to uncertainty, and initial perceptions about trust, stress, and workload associated with interacting with the
driving automation. These groups showed marked differences in their level of subjective trust and affect via facial
expressivity. This suggests that trust calibration metrics may not be equally critical for all groups of people.
15. SUBJECT TERMS
Driving Automation, Affective Computing, Affect-Based Trust, Trust-Based Decision-Making, Human-Autonomy Teaming
                                                                                         17. LIMITATION               18. NUMBER            19a. NAME OF RESPONSIBLE PERSON
16. SECURITY CLASSIFICATION OF:                                                              OF                           OF
                                                                                                                                            Catherine Neubauer
                                                                                             ABSTRACT                     PAGES
a. REPORT                  b. ABSTRACT                   c. THIS PAGE                                                                       19b. TELEPHONE NUMBER (Include area code)
                                                                                                  UU                         39
Unclassified                 Unclassified                   Unclassified                                                                    310-448-5354
                                                                                                                                                                                         Standard Form 298 (Rev. 8/98)
                                                                                                                                                                                        Prescribed by ANSI Std. Z39.18

                                                                                                         ii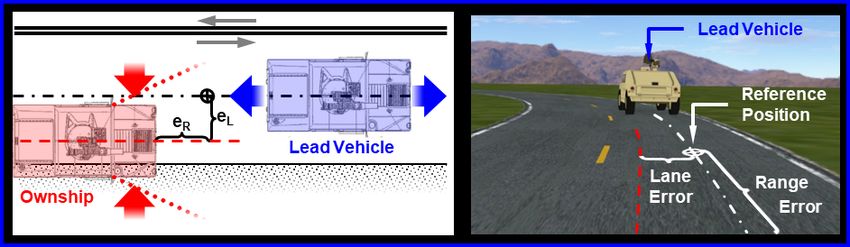
Contents

List of Figures                                  iv

List of Tables                                    v

Summary                                          vi

1.   Introduction                                 1

2.   Autonomous Driving Background                1

3.   Method                                       3
     3.1 Experimental Design                      4
     3.2 Participants                             5
     3.3 Measures                                 5
     3.4 Clustering Approach                      7

4.   Results                                      8
     4.1 Clustering Analysis                      8
     4.2 Effect of Trust, Stress, and Workload   11
     4.3 Analysis of Facial Expressivity         14

5.   Conclusions                                 22

6.   References                                  25

List of Symbols, Abbreviations, and Acronyms     30

Distribution List                                31

                                       iii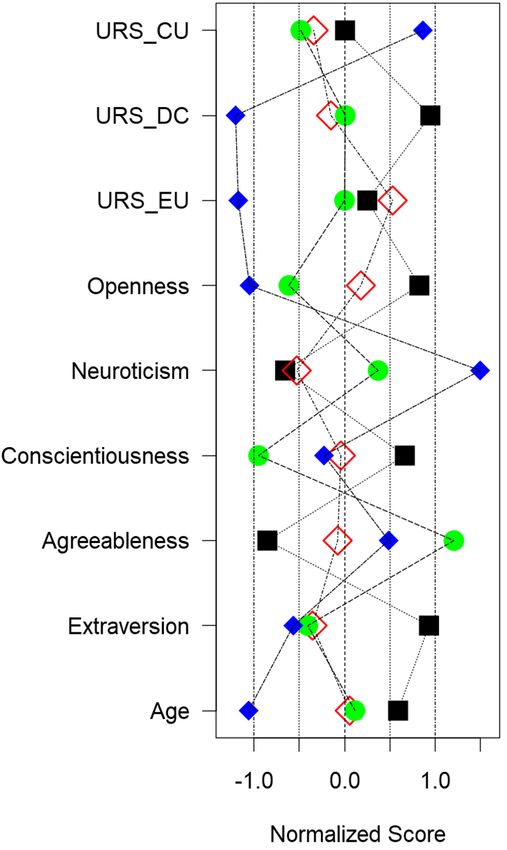
List of Figures
Fig. 1 (a) Ride Motion Simulator; (b) simulated roadway circuit; (c) example
view of leader–follower simulation trajectory and participant view of
display, respectively.............................................................................. 5
Fig. 2 Scree plot for cluster analysis, indicating that the participant sample
was best described as four distinct groups ............................................ 8
Fig. 3 Participants’ Z-scores for various characteristic traits, averaged by
cluster .................................................................................................... 9
Fig. 4 Differences from baseline trust as a function of cluster, automation
level, and automation reliability using the Muir and Moray trust
questionnaire (top) and the Checklist for Trust in Automation
(bottom). Error bars are 95% confidence intervals. ............................ 11
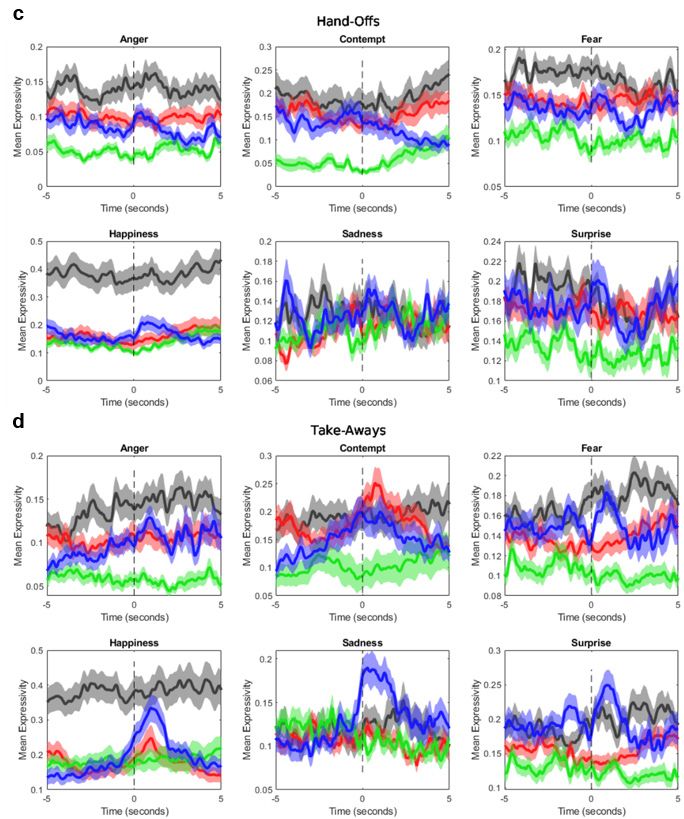
Fig. 5 Differences from baseline stress using the SVAS questionnaire as a
function of cluster, automation level, and automation reliability. Error
bars are 95% confidence intervals. ..................................................... 13
Fig. 6 Differences from baseline workload using the TLX questionnaire as a
function of cluster, automation level, and automation reliability. Error
bars are 95% confidence intervals. ..................................................... 14
Fig. 7 Mean values are depicted for the six facial expressions calculated for
the duration of the experimental drive within the four clusters. Values
taken within each condition are shown in order of the MM, SG, SB,
FG, and FB driving conditions. The rightmost (bold) values for each
cluster correspond to the overall mean computed across conditions.
Error bars are standard error. .............................................................. 16
Fig. 8 Comparisons between the automation (x-axis) and human driving (y-
axis) mean facial expression values within clusters. The distance of
these mean values from the plot origin indicates the overall magnitude
of expression. Mean values are shown within each condition and
across all conditions by the respective markers. Major axes of the
ellipses are respective standard errors for the mean within conditions
(shaded) and across driving conditions (solid outline). ...................... 18
Fig. 9 Comparisons between the magnitudes of facial expressivity exhibited
during periods of automation (x-axis) and human driving (y-axis)
within clusters. The distance of these mean values from the plot origin
indicates the overall magnitude of expression. Mean values are shown
within each condition and across all conditions by the respective
markers. Major axes of the ellipses are respective standard errors for
the mean within conditions (shaded) and across driving conditions
(solid outline). ..................................................................................... 19
iv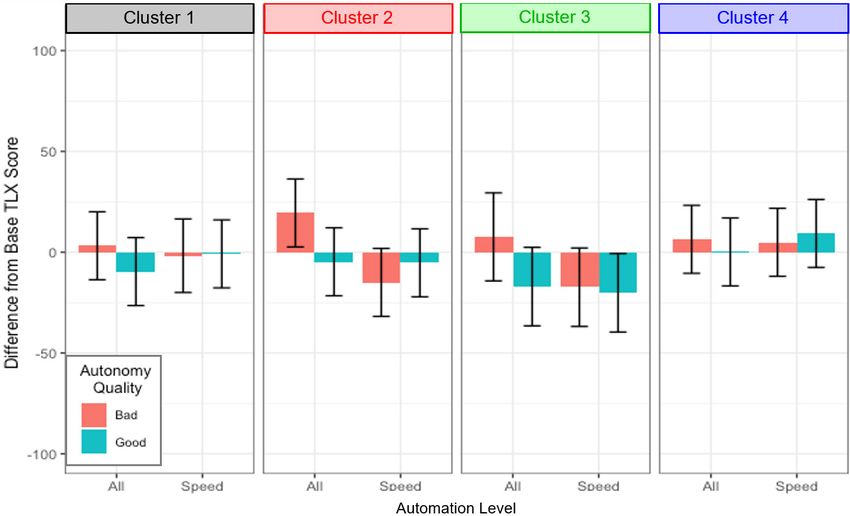
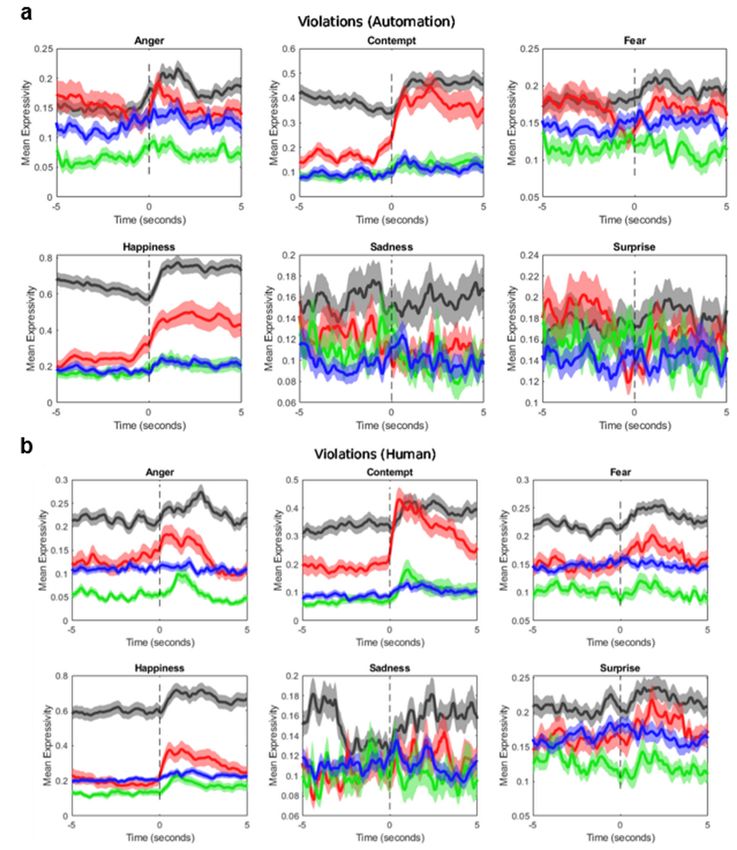
Fig. 10   Event-locked time histories for the six expressions in 10-s windows
          centered on instances of a) violations during automation driving, b)
          violations during human driving, c) hand-offs, and d) takeaways. Solid
          curves are averaged values across all conditions for subjects within the
          four clusters. Shaded bands are standard errors. The color of each time
          history corresponds, respectively, to Cluster 1 (black), Cluster 2 (red),
          Cluster 3 (green), and Cluster 4 (blue). ................................................ 20

List of Tables
Table 1   Facial expression emotion calculation from single AUs
          (Ekman and Friesen 1978) .................................................................... 7

                                                 v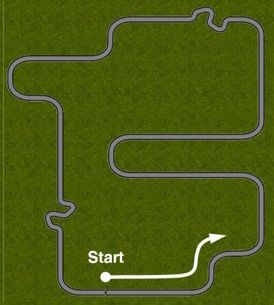
Summary

Novel assessment practices and metrics for evaluating trust in human-autonomy
teams are needed to develop and calibrate effective team performance. This report
provides insights into new assessment practices that can help quantify affect-based
trust by analyzing facial expressivity. Affect-based trust is an emergent attitudinal
state in which the individual makes attributions about the motives of their robot
partner 1,2 that can have a direct impact on comfort, satisfaction, and attitudes
toward automation. 3 This is critical for future crew stations because each of these
factors influences how and when we interact with autonomy-enabled systems.

There are two major outcomes from this research that advance the science in this
domain and provide direct support to Army initiatives, including the Human
Autonomy Teaming Essential Research Program and Army Modernization Priority
Next Generation Combat Vehicle (NGCV). First, we developed a new method for
grouping individuals prior to engaging in an autonomous driving scenario based on
demographics, personality traits, response to uncertainty, and initial perceptions
about trust, stress, and workload associated with interacting with automation.
Analyses showed that these groups (rather than individuals) had unique differences
in their reported state-based trust and consequently different patterns of facial
expressivity while interacting with different levels and reliability patterns of
automation. These findings suggest that trust calibration metrics may not be equally
critical for all groups of people, meaning that trust-based interventions (e.g.,
changes in user display features, communication of intent, etc.) may not be
necessary for all individuals, or may vary depending on group dynamics.

This report is a more complete version of our published research as part of the 3rd
International Conference on Intelligent Human System Integration (IHSI):
Integrating People and Intelligent Systems in Modena, Italy, 19–21 February 2020. 4

1
  Burke C, Sims DE, Lazzara EH, Salas E. Trust in leadership: a multi-level review and integration.
Leadership Quarterly. 2007;18:606–632. doi:10.1016/j.leaqua.2007.09.006.
2
  McAllister D. Affect- and cognition-based trust as foundations for interpersonal cooperation in
organizations. Academy of Management Journal. 1995;38:24–59. doi:10.2307/256727.
3
  Schaefer KE, Chen JYC, Szalma JL, Hancock PA. A meta-analysis of factors influencing the
development of trust in automation: implications for understanding autonomy in future systems.
Hum Fact. 2016;58:377–400.
4
  Neubauer C, Gremillion G, Perelman B, La Fleur C, Metcalfe J, Schaefer-Lay K. How analysis of
facial expressions explain affective state and trust-based decisions during interaction with autonomy
aids. Proceedings of the 3rd International Conference on Intelligent Human Systems Integration:
Integrating People and Intelligent Systems; 2020 Feb 19–20; Modena, Italy.

                                                 vi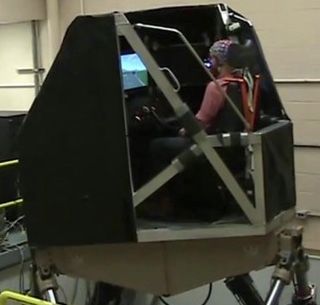
1.   Introduction

While trust has been shown to be critical for effective teaming, the methods and
metrics needed to assess team trust need to be more fully developed. The traditional
measurement practices for evaluating general trust are primarily associated with
subjective feedback (Yagoda and Gillan 2012; Schaefer et al. 2016), with some
research supporting behavioral or performance-based response (Freedy et al. 2007).
More recently, there has been a push for integrating wearable sensing of the human
to identify psycho-physiological signal differences during an interaction (Marathe
et al. 2018); however, part of the difficulty in identifying new trust metrics and
measurement practices is that trust in human-autonomy teams is a complex process.

Through a large review of the literature, it has been found that there are six
identified types of trust that impact human-autonomy teams: trust propensity,
trustworthiness, affect-based trust, cognitive-based trust, situational trust, and
learned trust (Schaefer et al. Forthcoming 2020). For this work, we are interested
in identifying possible assessment metrics for evaluating affect-based trust within
human-autonomy teams. Affect-based trust is an emergent attitudinal state in which
the individual makes attributions about the motives of the automation (McAllister
1995; Burke et al. 2007). The reason for this specific focus is that newer autonomy-
enabled technologies, such as automation-enabled driving aids, are being designed
to help alleviate high-task demands that lead to negative emotional states, poor
performance, or even dangerous decision-making strategies. Further, simulated
driving tasks are capable of eliciting large-scale changes in affective response
(Neubauer et al. 2010); therefore, simulated driving is a valuable domain to identify
new assessment practices for affect-based trust.

The current work extends the state of the art by explicitly evaluating facial
expressions in response to the level and degree of reliability of the automation
during a leader–follower driving task. We seek to investigate the following two
research aims: (Aim 1) quantify the effects of a simulated drive on facial
expressivity in response to the level and reliability of the aid and (Aim 2) robustly
model trust-based responses using multimodal data streams relating to subjective
response, demographic and individual difference clustering, and facial expressivity.

2.   Autonomous Driving Background

Army modernization is demanding increased implementation of driving
automation, up to and including full autonomy, as a fundamental capability for Next
Generation Combat Vehicles (Army Modernization Priority #2: NGCV; see
Purtiman 2018). Though the implementation of driverless technologies has long

                                         1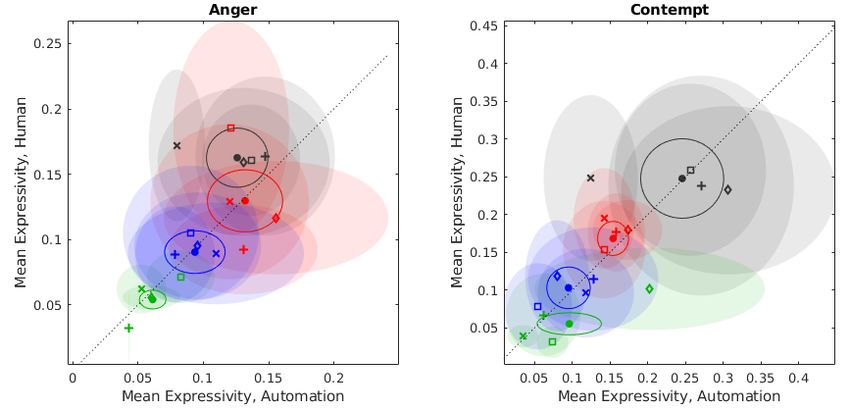
been a goal of Army science and technology efforts, autonomous driving platforms
have not enjoyed widespread integration into tactical ground-based platforms. In
the civilian sector, however, the ever-increasing number of drivers on the road,
along with added daily demands on our everyday lives, requires humans to juggle
several tasks with limited bandwidth (often while driving). This inevitably results
in an increase in the amount of traffic and roadway accidents.

As such, negative emotional states, such as stress and fatigue, can arise while
driving. When fatigued, drivers may have difficulty regulating their emotional
responses, especially in conditions where task-underload is present. Here, drivers
may cope with low-task demands by withdrawing effort, resulting in a state of
passive fatigue (Matthews and Desmond 2002; Desmond and Matthews 2009).
Additionally, stress causes driver attention to narrow, which may interfere with
concentration and appropriate decision-making and may lead to aggressive driving
and distraction. The National Highway and Transportation Security Administration
estimated that there were over 72,000 crashes involving drowsy drivers from 2009
to 2011 (National Center for Statistics and Analysis 2011), while the estimate of
stress-related accidents remains unknown. For this reason, it is essential that active
monitoring systems are developed to alert drivers of unsafe driving conditions.
Within this domain, technologies relating to computer vision have long been
employed for enhancing safe driving through detection and alerting systems for
fatigue (Dong et al. 2011) and emotions relating to stress and impatience (Lisetti
and Nasoz 2005; Nass et al. 2005).

Recently, there has been an increased push toward developing intelligent vehicles
(Little 1997). One such technology that has become increasingly popular is the use
of automation-enabled assisted driving aids. Examples of these systems include
adaptive cruise control, hazard detection, and lane monitoring or correcting
systems. It appears that such systems may promote safer driving by reducing a
driver’s workload and in turn decreasing stress and fatigue. However, it is also
possible that these technological advances may result in poorer performance by
decreasing task engagement (Hancock and Verwey 1997; Desmond et al. 1998) and
shifting the driver’s attention to personal discomfort and stress symptoms during
full vehicle automation (Stanton and Young 2005; Neubauer et al. 2012).
Additionally, prolonged automation use may reduce situation awareness, whereby
reaction times may increase in response to unexpected events in the roadway
(Young and Stanton 2002; Young and Stanton 2007; Saxby et al. 2013). Continuous
automation use may be particularly dangerous when drivers quickly need to take
back manual control of the vehicle in the case of automation failure (Desmond et
al. 1998; Saxby et al. 2013; Neubauer et al. 2014). Finally, automation level and

                                          2
transparency are two factors that may leave the human feeling “out of control”,
which may decrease situation awareness and, in turn, trust in the system.
Although the benefits and potential dangers of automation use in driving have been
extensively researched (Desmond et al. 1998; Desmond and Hancock 2001; Young
and Stanton 2007; Neubauer et al. 2012; Saxby et al. 2013; Neubauer et al. 2014),
a further issue revolves around the adequate development and assessment of trust.
As more of the functional tasks of daily life are being changed by the integration of
autonomy-enabled systems, human-autonomy teaming will be commonplace. A
misaligned level of trust in the system (i.e., when expectations do not match system
behaviors) typically results in unnecessary or preemptive human intervention,
essentially rendering the system ineffective (Parasuraman and Manzey 2010).
Mitigating this effect, denoted as miscalibrated trust (Sarter et al. 1997), requires
accurate estimation of underlying psychological traits and states that relate to trust,
and trust-related decisions.
Many metrics to measure operator state exist and typically include questionnaire
assessment; however, these are taken after an operator performs a task, requires
them to remember how they felt in a given moment, and may reflect subjective bias.
Additionally, unimodal streams of data may not accurately capture all aspects of an
affective state or decision. Most of the published research on computer vision
approaches to operator state detection have focused on fatigue assessment and
typically relied on analyses focused on eye tracking and head movements (Gu and
Ji 2004; Zhang and Zhang 2006; Dong et al. 2011). While the relationship between
trust and facial expressivity has not been studied thoroughly during driving, we
posit that these methods for measuring emotional response will provide more
directed insight on understanding affect-based trust. This line of research is critical
because it will be necessary to develop autonomy-enabled systems that can robustly
perceive and respond to our emotions as we interact with them if human–agent
teams are to be successful (Bartlett et al. 2004). In this context, it is vital that
automated agents not only accurately perceive our affective state but also respond
appropriately to avoid misinterpreting social cues during collaboration to improve
decision-making and performance (Scheutz et al. 2006).
3. Method
The current study was conducted on an immersive 6-degree-of-freedom motion
platform equipped with a full driving control interface and a three-screen visual
presentation system at the US Army Combat Capabilities Development Command
3(CCDC) Ground Vehicle Systems Center *. The following section describes the
experimental design, participants, and measures used (see Fig. 1a for a view of the
apparatus setup).
3.1 Experimental Design
A simulated leader–follower driving task was created using SimCreator (Real-Time
Technologies, Royal Oak, Michigan), which allowed participants to operate a
simulated vehicle on a two-lane closed-circuit roadway. During this drive,
participants were instructed to safely navigate the roadway while avoiding
collisions with all vehicles and pedestrians. Though the participants were not
explicitly instructed to make any particular use of the driving automation (when
available), they were encouraged to make their own decisions as to whether using
the autonomous assistant would be beneficial to the goal of maintaining lane
position and headway with respect to the lead vehicle. This joint human-automation
driving task was conducted while simultaneously performing a secondary
pedestrian classification button-press task (see Figs. 1b and 1c for roadway circuit
and experimental display).
The design was a 2 level of automation (level 1 automated speed control only; level
2 full control of speed and steering) × 2 automation reliability (good; bad) within
subjects design. Throughout this report, these four driving conditions are referred
to as speed, good (SG) (i.e., level 1 speed control, high automation reliability);
speed, bad (SB) (i.e., level 1 speed control, low automation reliability); full, good
(FG) (i.e., level 2 full control of speed and steering, high automation reliability);
and full, bad (FB) (i.e., level 2 full control of speed and steering, low automation
reliability). In addition to the automated driving conditions, participants also
completed one manual (no automation) drive as a baseline (referred to as the MM
driving condition). The average drive time around the course for each condition
lasted approximately 12 min. Full methods including additional information about
participants, task descriptions, and all measures and procedures can be found in
Drnec and Metcalfe (2016) and Gremillion et al. (2016).
*
Prior to 2019, the CCDC Ground Vehicle Systems Center was referred to as the US Army Tank
and Automotive Research, Development and Engineering Center.
4a b
c
Fig. 1 (a) Ride Motion Simulator; (b) simulated roadway circuit; (c) example view of
leader–follower simulation trajectory and participant view of display, respectively
3.2 Participants
Twenty-four participants, ages 18–65 years with normal-to-corrected vision to
normal vision were recruited. Only participants who had completed all sections of
data collection were included for this analysis, resulting in a sample size of 19
participants.
3.3 Measures
The larger intention of the paradigm from which the data were obtained was to
develop a robust set of measures that could detect online changes in the human
drivers of trust in the driving automation. Given that trust is subject to significant
individual differences, it was deemed important to record a variety of measures
spanning the range from subjective self-report to objective behaviors as well as the
intervening physiological indicators of the underlying psychological processes. For
a full discussion and rationale behind the paradigm design and measures, see Drnec
and Metcalfe (2016) and Metcalfe et al. (2017). The following descriptions are
5those included in data analysis for this report; however, this set does not comprise
all variables that were recorded per the study design.
1. Demographics: Although several demographics were collected, only age is
reported due to the results of the cluster analysis.
2. Personality: The Big Five Inventory (BFI) is a 44-item questionnaire that
indexes personality traits relating to extraversion, openness to experience,
agreeableness, conscientiousness, and neuroticism (John et al. 1991; 2008).
3. Uncertainty: The Uncertainty Response Scale (URS) is a trait measure that
contains 48 items designed to predict individual differences in coping with
uncertainty (Greco and Roger 2001). The URS has three subscales:
Emotional Uncertainty (EU), Desire for Change (DFC), and Cognitive
Uncertainty (CU).
4. Trust: Two scales were used to measure trust—a four-item version of the
Muir and Moray trust scale (Muir and Moray 1996) and the Checklist for
Trust in Automation (Jian and Bisantz 1998).
5. Workload: The NASA-Task Load Index (NASA-TLX) is a standard
measure of subjective workload based on ratings of task demands and is
widely used in human performance research (Hart and Staveland 1988).
6. Stress: The Stress Visual Analogue Scale (SVAS) is a one-item analogue
scale to identify task-based stress.
7. Analysis of Facial Expressivity: The participant’s face was continuously
recorded throughout the task via a webcam mounted to the simulation
screen. Measures relating to emotional expression were automatically
extracted through the OpenFace freeware (Baltrušaitis et al. 2018). More
specifically, OpenFace yields frame-by-frame evidence of facial action unit
(AU) evidence, which corresponds to specific muscle movements of the
face. Facial expressions relating to both positive and negative affect (i.e.,
emotions such as happiness, sadness, surprise, fear, anger, and contempt)
were calculated on a frame-by-frame basis separately for each task, using
computations of single AU evidence following the Facial Action Coding
System (Ekman and Friesen 1978). Table 1 outlines the specific AUs
needed to calculate each universal emotion.
6Table 1 Facial expression emotion calculation from single AUs (Ekman and Friesen 1978)
Emotion classification Action units
Anger 4+5+7+23
Contempt R12A+R14A
Disgust 9+15+16
Fear 1+2+4+5+7+20+26
Happiness 6+12
Sadness 1+4+15
Surprise 1+2+5B+26
3.4 Clustering Approach
It is known that individual differences impact trust development (Schaefer and
Scribner 2015; Schaefer et al. 2016); however, how the understanding of individual
differences should (or should not) directly feed into the trust calibration process is
unknown. Given the current state of the literature in this domain, it is difficult and
in many cases impossible to completely individualize trust-based interventions
when working with autonomy-enabled systems. Because of this, we employed a
model-based clustering method to determine the trust-based patterns that emerge
over subgroups of people in our sample rather than individuals. The process
described here provides a data-driven means to infer clusters of participants within
datasets. This analysis approach provides an attractive alternative to k-means
clustering and related approaches since the analysis does not require a priori
knowledge of underlying groups and can work with a relatively small sample size
(see Perelman et al. 2019).
We employed a mixture modeling approach aimed at revealing subgroups within
our sample, defined by their traits and state responses to experimental stimuli. This
statistical technique was selected on the basis that it defines these subgroups in a
data-driven fashion; this is a contrast to traditional experiment design in which
groups are experimenter-defined. Flexible mixture modeling (FMM) fits a mixture
of Gaussian models to the data using expectation maximization (E-M) iteratively
by minimizing a criterion value. Because mixture models are inherently
probabilistic, they are amenable to Bayesian analyses. Specifically, when these
models are generated in a stepwise fashion (i.e., stepwise FMM), exploring a range
of mixture models containing different numbers of components, the resulting
mixture models can be compared to one another to prevent overfitting.
We used an implementation of stepwise FMM from the R Flexmix package (Leisch
2004; Gruen and Leisch 2007). First, we selected a wide range of data upon which
to cluster participants, including participant demographics (age), personality traits
(BFI), response to uncertainty (URS), baseline perceived trust (both trust scales),
7workload (NASA-TLX), and subjective stress response (SVAS). Second, we
selected a model driver that was specifically designed to handle continuous data
(adapted from Tan and Mueller 2016). Next, we generated mixture models
containing 1 through n-1 components. Fixed variance in the process was set
relatively low (σ = 0.1), and 200 E-M iterations were permitted to ensure
convergence to an acceptable solution. Finally, we compared all of the resultant
mixture models, which contained a range of components, on the basis of Bayes
Information Criterion (BIC), which balances the model fit against the number of
components. This process allowed us to determine the number of underlying
subgroups present in the data, without specifying an overly complex model or
overfitting the data.
4. Results
This section includes results of the flexible mixture modeling approach to
clustering, and the associated changes in trust ratings and results relating to global
changes in facial expressivity according to group cluster and driving condition.
4.1 Clustering Analysis
Results of the clustering analysis indicated that the participant sample was best
described by four distinct groups indicated by the Akaike Information Criterion,
BIC, and Integrated Completed Likelihood values (Fig. 2).
Fig. 2 Scree plot for cluster analysis, indicating that the participant sample was best
described as four distinct groups
8The final four clusters are depicted in Fig. 3. In describing these clusters, terms
such as “average”, “higher”, or “lower” refer to the value relative to the sample
mean and do not reflect any normative values reported in other studies.
Fig. 3 Participants’ Z-scores for various characteristic traits, averaged by cluster
9Cluster 1 (black squares) was representative of the oldest participants in the sample
(though these participants were still relatively young relative to traditional age-
related trust effects) with a high DFC, high openness, extraversion, and
conscientiousness (N = 6). Tied with their low neuroticism scores, we expect this
group to be novelty-seeking, be less impacted by stress or workload, and thus be
more willing to accept and trust automation. When identifying trust calibration
metrics, we expect members of this group to use the automation and be willing to
hand off and take away control, but they may be prone to overtrust.
Cluster 2 (red diamonds) was relatively average on nearly all of the dimensions in
the analysis (N = 6). However, this group did exhibit the highest EU in the sample,
indicating a potential for maladaptive emotional and anxious responses to
uncertainty. Therefore, we expect to see higher anxiety-based ratings in the
facial data. For trust calibration metrics, we expect to see a greater negative
trust response when the reliability of the automation is low.
Cluster 3 (green circles) was relatively average across most dimensions (N = 3).
However, this group reported extremely low CU and conscientiousness but had
high agreeableness suggesting a high preference for predictable, planned behavior
but some willingness to give automation a chance. Based on this clustering, we
would expect this group to exhibit more stress and workload with bad automation
and thus lower trust, but less stress and workload with good automation and thus
higher trust.
Cluster 4 (blue solid diamonds) was the youngest in the sample and reported
extremely polarized scores on several key scales (N = 4). This group reported
the lowest DC and EU scores, indicating that they do not seek novelty and
would not respond emotionally to uncertainty. However, they reported the
highest CU, indicating that they prefer predictability and structure in uncertain
conditions. This coincided with this cluster’s neuroticism scores, which were
the highest in the sample. We expect this group to have higher stress and
workload while interacting with automation and to exhibit a general negative
response to automation.
For illustrative purposes of our data analysis, in Figs. 4–10 we have tried to
depict differences among clusters according to their color grouping
classification (e.g., Cluster 1 [Black], Cluster 2 [Red], Cluster 3 [Green], and
Cluster 4 [Blue]).
104.2 Effect of Trust, Stress, and Workload
The mixed effect models described in this section were conducted in R (R Core
Team 2016) using the lme4 package (Bates et al. 2015). Both trust measures (Muir
and Moray 1996; Jian and Bisantz 1998) were analyzed and showed similar patterns
of predicted changes in trust from the base condition across the type and reliability
of the automation for each cluster (Fig. 4).
Cluster 1 Cluster 2 Cluster 3 Cluster 4
Difference from Base MM Score
Bad
Good
Full Speed Full Speed Full Speed Full Speed
Automation Level
Cluster 1 Cluster 2 Cluster 3 Cluster 4
Difference from Base Jian Score
Bad
Good
Full Speed Full Speed Full Speed Full Speed
Automation Level
Fig. 4 Differences from baseline trust as a function of cluster, automation level, and
automation reliability using the Muir and Moray trust questionnaire (top) and the Checklist
for Trust in Automation (bottom). Error bars are 95% confidence intervals.
11For both trust scales, automation reliability was a significant predictor of change in
reported trust, χ2 (1) = 9.37, p = 0.002 (Muir and Moray 1996), and χ2 (1) = 7.08,
p = 0.008 (Checklist), whereby the mean difference from baseline trust improved
with good automation and decreased with bad automation. When analyzing the
clusters, the Muir and Moray trust scale showed a significant interaction between
automation reliability and cluster, χ2 (3) = 10.73, p = 0.013 and automation level
and cluster, χ2 (3) = 9./84, p = 0.020. The checklist also showed a significant
interaction between automation level and cluster, χ2 (3) = 11.67, p = 0.009, but only
a borderline significant interaction between automation reliability and cluster, χ2
(3) = 7.28, p = 0.064. All other predictors were nonsignificant, p’s > .10.
Follow-up analyses were conducted to determine specific differences between the
clusters. Cluster 1 showed higher trust in good automation but had less negative
response to bad automation. Cluster 2 had a stronger negative trust reaction to bad
automation, especially when in the full automation condition, which identifies
maladaptive anxiety responses to uncertainty. The patterns in trust-based response
for Cluster 3 resulted in higher trust with good automation, but the results also show
a trust degradation when the pattern of behavior becomes less predictable, as in the
bad full automation condition. Finally, Cluster 4 showed an impact of bad
automation on trust degradation, which corresponds with the high CU and
neuroticism scores and general negative response to automation.
We then examined whether cluster (1–4), automation level (Speed, Full), and
automation reliability (Good, Bad) predicted changes in stress from the baseline
condition using the SVAS questionnaire. The best-fitting model included a fixed
effect for cluster, automation level, and automation reliability and a random effect
for participants, as shown in Fig. 5. However, the only significant predictor was the
cluster, χ2 (3) = 9.67, p = 0.022. Overall, the patterns suggest that for that
individuals in Cluster 2, stress increased with the presence of automation. In
contrast, for Cluster 3, stress generally decreased with automation. There was not a
significant change in stress for Clusters 1 and 4.
12Fig. 5 Differences from baseline stress using the SVAS questionnaire as a function of
cluster, automation level, and automation reliability. Error bars are 95% confidence intervals.
Finally, we examined whether corresponding changes from the baseline condition
would be found in participants’ self-reported workload using the NASA-TLX
questionnaire. As with the SVAS models, the best-fitting model included a fixed
effect for cluster, automation level, automation reliability, and a random effect for
participants, as shown in Fig. 6. Automation reliability was a borderline significant
predictor of change in workload, χ2 (1) = 2.91, p = 0.09. Perceived workload tended
to decrease with good automation and increase with bad automation, although the
changes were small.
There was also a significant interaction between automation level and cluster, χ2
(3) = 12.37, p = 0.006. Although the change in workload from baseline did not
significantly differ based on automation level for any of the clusters, Cluster 2
participants reported an increase in workload for the FB condition that is
significantly greater than zero. This fits with previous findings that Cluster 2 had
maladaptive responses to emotional uncertainty, resulting in lower trust, higher
stress, and higher workload.
13Automation Level
Fig. 6 Differences from baseline workload using the TLX questionnaire as a function of
cluster, automation level, and automation reliability. Error bars are 95% confidence intervals.
Overall, there is a relationship between trust, stress, and workload within human-
autonomy teams. Previous research tends show an increase in trust when stress and
workload decrease. The patterns in our analyses provide a more in-depth
understanding into this relationship. It is clear that the relationship is not a one-to-
one correspondence, but rather a more complex interaction that can be more
prominent in certain people and not others. In particular, more extreme changes in
trust, stress, and workload are identified in Clusters 2 and 3. For Cluster 2, results
showed that adding any type of automation led to an increase in stress, but also that
a degradation of trust and increase in workload were only significant in the full
automation, bad condition. These findings directly correspond to maladaptive
anxiety responses to uncertainty. For Cluster 3, results showed that adding any
type of automation reduced stress. There were also patterns of lower workload
and higher trust, except for the full, bad automation condition. Results are in
line with the cluster analysis that suggests a high preference for predictable,
planned behavior but some willingness to give automation a chance.
4.3 Analysis of Facial Expressivity
Our last analysis focused on analyzing mean facial expressivity as a function of
group clustering, automation type, and reliability. In the previous section, results of
the subjective trust showed different patterns of trust for each of the four clusters,
while stress and workload data indicated differences in responses for participants
14in Clusters 2 and 3. In regard to our analysis of differences in facial expressivity,
results of interest point to differences in Clusters 1 and 3 (Fig. 7). Here, participants
in Cluster 1 had higher average expression values than all other clusters, with
significantly higher values of happiness and contempt than all other clusters, which
was likely due to their having the highest extraversion scores and generally positive
subjective response to automation (with the exception of the FB driving condition).
Members of Cluster 3 yielded generally lower mean expression values than other
clusters, with significant differences in mean values of anger, fear, and surprise than
all other clusters, which concurs with their low conscientiousness and high
agreeableness scores and higher trust with good automation reliability ratings.
While no significant trend was found between the mean expressivity values and
driving condition, it can be posited that the increases in anger, fear, and surprise
were correlated with deviations from predictable, planned behavior of the
automation.
15Fig. 7 Mean values are depicted for the six facial expressions calculated for the duration of
the experimental drive within the four clusters. Values taken within each condition are shown
in order of the MM, SG, SB, FG, and FB driving conditions. The rightmost (bold) values for
each cluster correspond to the overall mean computed across conditions. Error bars are
standard error.
Next, we looked at any differences between relative levels of facial expressivity
that were exhibited during periods when participants were engaged in human (e.g.,
no automation) or automated driving (Fig. 8) and where participant driving
violations occurred (Fig. 9). We refer to “driving violations” as any instance where
points were deducted from the subject’s score. Violations were labeled as “position
16violations” (i.e., deviations from the participant’s lane position and following
distance tolerances lasting more than 3 s) as well as collisions with pedestrians or
other vehicles. Additionally, when looking at the following figures, it is imperative
to note that the distance of these mean values from the plot origin indicates the
overall magnitude of the expression. In other words, the degree to which these
values lie above or below the 45° line (dotted) indicates whether greater
expressivity was seen during human (x-axis) or automated driving (y-axis),
respectively.
We first separated our analysis to illustrate individual facial expression magnitude
during human and automated driving for all driving conditions and across group
cluster. From Fig. 8, it is evident that the positions of mean happiness and contempt
for each cluster indicated relatively even expressivity between instances of human
and automated driving, while the relative expressivity between human and
automated driving appears to vary significantly among the clusters for the other
expressions. Specifically, the expressions of anger and fear, for members of
Cluster 1, are above the 45° line, indicating a relatively higher mean expressivity
during human rather than automated driving. This conforms to expectations that
Cluster 1 would be most willing to accept and trust automation, possibly to the point
of overtrust, yielding relatively higher levels of anger and fear when in control of
driving themselves than during automated driving.
17Fig. 8 Comparisons between the automation (x-axis) and human driving (y-axis) mean
facial expression values within clusters. The distance of these mean values from the plot origin
indicates the overall magnitude of expression. Mean values are shown within each condition
and across all conditions by the respective markers. Major axes of the ellipses are respective
standard errors for the mean within conditions (shaded) and across driving conditions (solid
outline).
18Further, the position of the cluster means for expression shows generally greater
similarity between Clusters 1 and 2 with higher expressivity, and greater similarity
between Clusters 3 and 4 with lower expressivity. However, as shown in Fig. 9, the
position of the cluster means for violation rates instead show similarity between
Clusters 1 and 4 with more frequent violations, and similarity between Clusters 2
and 3 with less frequent violations. Additionally, Cluster 1 (black) displayed higher
magnitudes of expressivity during these periods of driving than the members of the
other clusters, generally consistent with the results from Fig. 7. This illustrates that
expression responses are not directly tied to performance rates and are more likely
moderated by subject characteristics captured in their questionnaire responses,
which delineate them by cluster.
Fig. 9 Comparisons between the magnitudes of facial expressivity exhibited during periods
of automation (x-axis) and human driving (y-axis) within clusters. The distance of these mean
values from the plot origin indicates the overall magnitude of expression. Mean values are
shown within each condition and across all conditions by the respective markers. Major axes
of the ellipses are respective standard errors for the mean within conditions (shaded) and
across driving conditions (solid outline).
Finally, we looked at time-dependent trends that differed between members of the
four clusters (Fig. 10). More specifically, this figure illustrates emotional responses
for a 10-s window around events of interest (i.e., violations and authority toggles,
either hand-offs or takeaways), averaged across all instances exhibited by members
within each cluster. From this figure it is most notable that Cluster 2 had the
strongest expressive reactivity to violations, which aligns with our expectation to
see maladaptive anxiety responses to uncertainty and greater negative trust
response to instances of low reliability. Cluster 4 showed the most expression
reactivity to toggles of driving authority to the automation (hand-offs) and from the
automation (takeaways), which corresponds with expectations of higher stress and
workload while interacting with, and greater negative response to, automation.
19Finally, subjects in Cluster 3 demonstrated relatively low expressive reactions to
either authority toggles or violations, which again concurs with their low
conscientiousness and high agreeableness scores. Overall, these findings indicate
that expressivity between human and automated driving varied significantly among
the clusters for each expression, which has implications for individual trust
calibration and appropriate intervention development.
Fig. 10 Event-locked time histories for the six expressions in 10-s windows centered on
instances of a) violations during automation driving, b) violations during human driving, c)
hand-offs, and d) takeaways. Solid curves are averaged values across all conditions for subjects
within the four clusters. Shaded bands are standard errors. The color of each time history
corresponds, respectively, to Cluster 1 (black), Cluster 2 (red), Cluster 3 (green), and Cluster 4
(blue).
20Fig. 10 Event-locked time histories for the six expressions in 10-s windows centered on
instances of a) violations during automation driving, b) violations during human driving, c)
hand-offs, and d) takeaways. Solid curves are averaged values across all conditions for
subjects within the four clusters. Shaded bands are standard errors. The color of each time
history corresponds, respectively, to Cluster 1 (black), Cluster 2 (red), Cluster 3 (green), and
Cluster 4 (blue) (continued).
215. Conclusions
In this report we were interested in identifying possible assessment metrics for
evaluating affect-based trust within human-autonomy teaming. Results of our
clustering analysis indicated that the participant sample was best described by four
distinct groups who varied in their level of subjective trust and facial expressivity
across the different drives. Convergent results from the cluster analysis of the trust
questionnaires and mean facial expressivity values showed that there are indeed
different patterns of response by different groups of people. It is not enough to look
at single individual difference ratings in isolation, but rather the variance is
dependent on an interplay of multiple features. It is often stated that for appropriate
trust to be developed and effectively calibrated, an individual’s expectations need
to match the system’s actual behaviors. What this research shows is that calibration
metrics will not be the same for all people. In these cases, certain groups may be
more prone to overtrust in automation (as seen in Cluster 1’s high levels of baseline
trust) compared to a misaligned level of trust in automation from the start (as seen
in Cluster 4’s somewhat moderate to low levels of baseline trust). These findings
may impact intervention plans for individuals who engage in human-autonomy
teaming and should consider the following: 1) we should not expect the same results
regarding individual propensities to trust, subjective response to automation
interaction, and overt behavioral responses from all individuals, 2) multivariate
methodologies focusing on grouping individuals can illuminate informative
clusters of individuals, and 3) interventions that use these clustering methodologies
will need to account for psychological dynamics and behavioral responses that vary
qualitatively and quantitatively between individuals. For example, Cluster 1
interventions will require the expectation that these individuals may overtrust the
automation, while also expressing strong outward changes in facial expressivity,
while Cluster 4 interventions should account for a bias against automation to begin
with and limited facial expressivity responses during an interaction with
automation.
Additionally, significant differences were found regarding subjective responses for
each group cluster and changes in facial expressivity. We will attempt to outline
and summarize these differences according to the four clusters previously
described.
Cluster 1: Tied with their low neuroticism, stress, and workload scores (i.e., no
difference from baseline), we expected this group to be novelty-seeking and thus
more willing to accept and trust the automation. When identifying trust calibration
metrics, we expect members of this group to use the automation and be willing to
hand off and take away control, but they may be prone to overtrust (as shown in
22their higher trust ratings during good automation reliability and less negative
response to bad automation comparatively). This group also exhibited the highest
levels of facial expressivity (e.g., specifically for expressions relating to happiness
and contempt), which may be expected from their high extraversion scores. This
shows some validation, or at least a plausible and consistent connection, between
the questionnaire responses and the measurement of behavioral response. More
specifically, inferences based on real-time measures can or should be calibrated to
have expected ranges based on baseline questionnaire responses (i.e., evidence of
high facial expressivity should not be solely dependent upon the task stimuli,
particularly for a subject with high extraversion scores). Additionally, as outlined
in Fig. 8, for the expressions relating to anger and fear, data for Cluster 1 are above
the 45° line, indicating that these expressions were stronger or more frequent during
instances of human driving than automated driving. Given proneness to reliance on
the automation and a willingness to accept and trust autonomy, this result suggests
trust for this cluster was miscalibrated in the direction of overtrusting the
automation.
Cluster 2: This group exhibited that highest EU in the sample, indicating a
potential for maladaptive emotional and anxious responses to uncertainty.
Therefore, we expected to see higher anxiety-based ratings in the facial data.
For trust calibration metrics, we expected to see a greater negative trust
response when the reliability of the automation was low. This was confirmed
from Cluster 2’s increase in subjective stress and workload and stronger
negative trust reaction to full automation with bad reliability. This group also had
the strongest expressive reactions to violations (e.g., specifically for emotions
relating to anger, contempt, fear, and surprise), which is indicative of their potential
for maladaptive anxiety responses to uncertainty. When compared with their
relatively low rate of violations, these factors suggest that this cluster
experienced miscalibrated trust in the form of undertrust.
Cluster 3: Reports of CU and conscientiousness were extremely low in Cluster 3;
however, high agreeableness was also reported, suggesting a high preference
for predictable, planned behavior but some willingness to give automation a
chance. Based on this clustering, we expected this group to exhibit more stress
and workload with bad automation and thus lower trust, but less stress and
workload with good automation and thus higher trust, which was somewhat
confirmed. Here, the patterns in trust-based response for Cluster 3 resulted in
higher trust and lower workload with good automation, but the results also showed
a trust degradation and increased workload when the pattern of behavior becomes
less predictable, as in the bad, full automation condition. This group also exhibited
relatively low expressive reactions to either authority toggles or violations, which
23in conjunction with their appropriately balanced evaluations of trust in the
automation with respect to the level of reliability and their overall lower violation
rate, suggest this group’s trust level was calibrated best relative to the other clusters.
Cluster 4: This group was the most polarized and reported the lowest DC and EU
scores, indicating that they do not seek novelty and would not respond
emotionally to uncertainty. However, they also reported the highest CU,
indicating that they prefer predictability and structure in uncertain conditions.
This coincided with this cluster's neuroticism scores, which were the highest in
the sample. In fact, the subjective responses for Cluster 4 showed an impact of
bad automation on trust degradation, which corresponds with the high CU and
neuroticism scores and general negative response to automation. Cluster 4 also
demonstrated the greatest changes in expressivity to toggles of driving authority
away from the driving automation, which comports with their proneness to stronger
negative trust-based reactions to bad automation and their relatively poor
performance.
Outcomes from this work have shown that expressive response is not uniformly
related to performance or even to interactions with the automation, even at granular,
time-resolved scales, across all subjects. These responses instead form more
consistent patterns when subjects are grouped based on their characteristic traits.
Overall, we believe the current work extends the state of the art by explicitly
evaluating facial expressions in response to level and degree of reliability of
automation during a leader–follower driving task. Although more work is needed,
we believe that the methods outlined here provide a way to systematically group,
evaluate, and eventually predict individual behaviors relating to affect-based trust
within human-autonomy teams.
246. References
Baltrušaitis T, Zadeh A, Lim YC, Morency L-P. OpenFace 2.0: facial behavior
analysis toolkit. IEEE International Conference on Automatic Face and
Gesture Recognition; 2018.
Bartlett MS, Littlewort G, Fasel I, Chenu J, Kanda T, Ishiguro H, Movellan JR.
Towards social robots: automatic evaluation of human-robot interaction by
face detection and expression classification. In Proc IEEE Int Conf Systems,
Man, and Cybernetics; 2004. p. 592–597.
Bates D, Mächler M, Bolker B, Walker S. Fitting linear mixed-effects models using
lme4. J Stat Soft. 2015;67:1–48.
Burke C, Sims DE, Lazzara EH, Salas E. Trust in leadership: a multi-level review
and integration. Leadership Quarterly. 2007;18:606–632.
doi:10.1016/j.leaqua.2007.09.006.
Desmond PA, Hancock PA. Active and passive fatigue states. In: Hancock PA,
Desmond PA, editors. Stress, workload, and fatigue. Mahwah (NJ): Lawrence
Erlbaum; 2001. p. 455–465.
Desmond PA, Hancock PA, Monette JL. Fatigue and automation-induced
impairments in simulated driving performance. TRR. 1998;1628:8–14.
Desmond PA, Matthews G. Individual differences in stress and fatigue in two field
studies of driving. Transp Res Part F. 2009;12:265–276.
Dong Y, Hu Z, Uchimura K, Murayama N. Driver inattention monitoring system
for intelligent vehicles: a review. IEEE Trans Intell Transp Syst. 2011;12:596–
614.
Drnec K, Metcalfe JS. Paradigm development for identifying and validating
indicators of trust in automation in the operational environment of human
automation integration. In: Schmorrow DD, Fidopiastis CM, editors.
Foundations of augmented cognition 2016, lecture notes in computer science.
2016;9744:157–167.
Ekman P, Friesen W. Facial action coding system: a technique for the measurement
of facial movement. Palo Alto (CA): Consulting Psychologists Press; 1978.
Freedy A, de Visser E, Weltman G, Coeyman N. Measurement of trust in human-
robot collaboration. Proceedings of the 2007 IEEE International Conference
on Collaborative Technologies and Systems. 2007; Orlando, FL.
25You can also read