The green, blue and grey water footprint of crops and derived crop products
←
→
Page content transcription
If your browser does not render page correctly, please read the page content below
Hydrol. Earth Syst. Sci., 15, 1577–1600, 2011
www.hydrol-earth-syst-sci.net/15/1577/2011/                                                          Hydrology and
doi:10.5194/hess-15-1577-2011                                                                         Earth System
© Author(s) 2011. CC Attribution 3.0 License.                                                             Sciences

The green, blue and grey water footprint of crops and derived crop
products
M. M. Mekonnen and A. Y. Hoekstra
Twente Water Centre, University of Twente, Enschede, The Netherlands
Received: 3 January 2011 – Published in Hydrol. Earth Syst. Sci. Discuss.: 20 January 2011
Revised: 31 March 2011 – Accepted: 18 May 2011 – Published: 25 May 2011

Abstract. This study quantifies the green, blue and grey wa-      as well: the global average water footprint of bio-ethanol
ter footprint of global crop production in a spatially-explicit   based on sugar beet amounts to 51 m3 GJ−1 , while this is
way for the period 1996–2005. The assessment improves             121 m3 GJ−1 for maize.
upon earlier research by taking a high-resolution approach,          The global water footprint related to crop production in
estimating the water footprint of 126 crops at a 5 by 5 arc       the period 1996–2005 was 7404 billion cubic meters per
minute grid. We have used a grid-based dynamic water bal-         year (78 % green, 12 % blue, 10 % grey). A large total wa-
ance model to calculate crop water use over time, with a          ter footprint was calculated for wheat (1087 Gm3 yr−1 ), rice
time step of one day. The model takes into account the daily      (992 Gm3 yr−1 ) and maize (770 Gm3 yr−1 ). Wheat and rice
soil water balance and climatic conditions for each grid cell.    have the largest blue water footprints, together accounting for
In addition, the water pollution associated with the use of       45% of the global blue water footprint. At country level, the
nitrogen fertilizer in crop production is estimated for each      total water footprint was largest for India (1047 Gm3 yr−1 ),
grid cell. The crop evapotranspiration of additional 20 mi-       China (967 Gm3 yr−1 ) and the USA (826 Gm3 yr−1 ). A rela-
nor crops is calculated with the CROPWAT model. In ad-            tively large total blue water footprint as a result of crop pro-
dition, we have calculated the water footprint of more than       duction is observed in the Indus river basin (117 Gm3 yr−1 )
two hundred derived crop products, including various flours,      and the Ganges river basin (108 Gm3 yr−1 ). The two basins
beverages, fibres and biofuels. We have used the water foot-      together account for 25% of the blue water footprint re-
print assessment framework as in the guideline of the Water       lated to global crop production. Globally, rain-fed agricul-
Footprint Network.                                                ture has a water footprint of 5173 Gm3 yr−1 (91% green,
   Considering the water footprints of primary crops, we          9 % grey); irrigated agriculture has a water footprint of
see that the global average water footprint per ton of crop       2230 Gm3 yr−1 (48 % green, 40 % blue, 12 % grey).
increases from sugar crops (roughly 200 m3 ton−1 ), veg-
etables (300 m3 ton−1 ), roots and tubers (400 m3 ton−1 ),
fruits (1000 m3 ton−1 ), cereals (1600 m3 ton−1 ), oil crops      1   Introduction
(2400 m3 ton−1 ) to pulses (4000 m3 ton−1 ). The water foot-
print varies, however, across different crops per crop cat-       Global freshwater withdrawal has increased nearly seven-
egory and per production region as well. Besides, if one          fold in the past century (Gleick, 2000). With a growing
considers the water footprint per kcal, the picture changes       population, coupled with changing diet preferences, water
as well. When considered per ton of product, commodities          withdrawals are expected to continue to increase in the com-
with relatively large water footprints are: coffee, tea, cocoa,   ing decades (Rosegrant and Ringler, 2000; Liu et al., 2008).
tobacco, spices, nuts, rubber and fibres. The analysis of wa-     With increasing withdrawals, also consumptive water use is
ter footprints of different biofuels shows that bio-ethanol has   likely to increase. Consumptive water use in a certain pe-
a lower water footprint (in m3 GJ−1 ) than biodiesel, which       riod in a certain river basin refers to water that after use
supports earlier analyses. The crop used matters significantly    is no longer available for other purposes, because it evap-
                                                                  orated (Perry, 2007). Currently, the agricultural sector ac-
                                                                  counts for about 85 % of global blue water consumption
                    Correspondence to: M. M. Mekonnen             (Shiklomanov, 2000).
                    (m.m.mekonnen@ctw.utwente.nl)

Published by Copernicus Publications on behalf of the European Geosciences Union.
1578                                    M. M. Mekonnen and A. Y. Hoekstra: The green, blue and grey water footprint of crops

   The aim of this study is to estimate the green, blue and        et al. (1990) and Shiklomanov (1993) estimated blue water
grey water footprint of crops and crop products in a spatially-    consumption at a continental level. Postel et al. (1996) made
explicit way. We quantify the green, blue and grey water           a global estimate of consumptive use of both blue and green
footprint of crop production by using a grid-based dynamic         water. Seckler et al. (1998) made a first global estimate of
water balance model that takes into account local climate and      consumptive use of blue water in agriculture at country level.
soil conditions and nitrogen fertilizer application rates and      Rockström et al. (1999) and Rockström and Gordon (2001)
calculates the crop water requirements, actual crop water use      made some first global estimates of green water consump-
and yields and finally the green, blue and grey water footprint    tion. Shiklomanov and Rodda (2003) estimated consumptive
at grid level. The model has been applied at a spatial resolu-     use of blue water at county level. Hoekstra and Hung (2002)
tion of 5 by 5 arc minute. The model’s conceptual framework        were the first to make a global estimate of the consumptive
is based on the CROPWAT approach (Allen et al., 1998).             water use for a number of crops per country, but they did not
   The concept of “water footprint” introduced by Hoek-            explicitly distinguish consumptive water use into a green and
stra (2003) and subsequently elaborated by Hoekstra and            blue component. Chapagain and Hoekstra (2004) and Hoek-
Chapagain (2008) provides a framework to analyse the link          stra and Chapagain (2007, 2008) improved this study in a
between human consumption and the appropriation of the             number of respects, but still did not explicitly distinguish be-
globe’s freshwater. The water footprint of a product (alter-       tween green and blue water consumption.
natively known as “virtual water content”) expressed in wa-           All the above studies are based on coarse spatial resolu-
ter volume per unit of product (usually m3 ton−1 ) is the sum      tions that treat the entire world, continents or countries as a
of the water footprints of the process steps taken to produce      whole. In recent years, there have been various attempts to
the product. The water footprint within a geographically           assess global water consumption in agriculture at high spa-
delineated area (e.g. a province, nation, catchment area or        tial resolution. The earlier estimates focus on the estima-
river basin) is equal to the sum of the water footprints of all    tion of blue water withdrawal (Gleick, 1993; Alcamo et al.,
processes taking place in that area (Hoekstra et al., 2011).       2007) and irrigation water requirements (Döll and Siebert,
The blue water footprint refers to the volume of surface and       2002). More recently, a few studies have separated global
groundwater consumed (evaporated) as a result of the pro-          water consumption for crop production into green and blue
duction of a good; the green water footprint refers to the rain-   water. Rost et al. (2008) made a global estimate of agri-
water consumed. The grey water footprint of a product refers       cultural green and blue water consumption with a spatial-
to the volume of freshwater that is required to assimilate the     resolution of 30 by 30 arc minute without showing the water
load of pollutants based on existing ambient water quality         use per crop, but applying 11 crop categories in the underly-
standards.                                                         ing model. Siebert and Döll (2008, 2010) have estimated the
   The water footprint is an indicator of direct and indirect      global green and blue water consumption for 24 crops and 2
appropriation of freshwater resources. The term “freshwa-          additional broader crop categories applying a grid-based ap-
ter appropriation” includes both consumptive water use (the        proach with a spatial-resolution of 5 by 5 arc minute. Liu
green and blue water footprint) and the water required to as-      et al. (2009) and Liu and Yang (2010) made a global esti-
similate pollution (the grey water footprint). The grey wa-        mate of green and blue water consumption for crop produc-
ter footprint, expressed as a dilution water requirement, has      tion with a spatial-resolution of 30 by 30 arc minute. Liu
been recognised earlier by for example Postel et al. (1996)        et al. (2009) distinguished 17 major crops, while Liu and
and Chapagain et al. (2006). Including the grey water foot-        Yang (2010) considered 20 crops and 2 additional broader
print is relatively new in water use studies, but justified when   crop categories. Hanasaki et al. (2010) present the global
considering the relevance of pollution as a driver of water        green and blue water consumption for all crops but assume
scarcity. As stressed in UNDP’s Human Development Re-              one dominant crop per grid cell at a 30 by 30 arc minute res-
port 2006, which was devoted to water, water consumption           olution. In a recent study, Fader et al. (2011) made a global
is not the only factor causing water scarcity; pollution plays     estimate of agricultural green and blue water consumption
an important role as well (UNDP, 2006). Pollution of fresh-        with a spatial-resolution of 30 by 30 arc minute, distinguish-
water resources does not only pose a threat to environmental       ing 11 crop functional types.
sustainability and public health but also increases the com-
petition for freshwater (Pimentel et al., 1997, 2004; UNEP
GEMS/Water Programme, 2008). Vörösmarty et al. (2010)            2   Method and data
further argue that water pollution together with other factors
pose a threat to global water security and river biodiversity.     The green, blue and grey water footprints of crop produc-
   There are various previous studies on global water use for      tion were estimated following the calculation framework of
different sectors of the economy, most of which focus on wa-       Hoekstra et al. (2011). The computations of crop evapotran-
ter withdrawals. Studies of global water consumption (evap-        spiration and yield, required for the estimation of the green
orative water use) are scarcer. There are no previous global       and blue water footprint in crop production, have been done
studies on the grey water footprint in agriculture. L’vovich       following the method and assumptions provided by Allen et

Hydrol. Earth Syst. Sci., 15, 1577–1600, 2011                                     www.hydrol-earth-syst-sci.net/15/1577/2011/

M. M. Mekonnen and A. Y. Hoekstra: The green, blue and grey water footprint of crops 1579
al. (1998) for the case of crop growth under non-optimal con- suffering water stress (dimensionless). Grid-based data on
ditions. The grid-based dynamic water balance model used total available water capacity of the soil (TAWC) at a 5 by 5
in this study computes a daily soil water balance and calcu- arc minute resolution were taken from ISRIC-WISE (Batjes,
lates crop water requirements, actual crop water use (both 2006). An average value of TAWC of the five soil layers was
green and blue) and actual yields. The model is applied at a used in the model.
global scale using a resolution of 5 by 5 arc minute (Mekon- In the case of rain-fed crop production, blue crop water
nen and Hoekstra, 2010). We estimated the water footprint use is zero and green crop water use (m3 ha−1 ) is calcu-
of 146 primary crops and more than two hundred derived lated by summing up the daily values of ETa (mm day−1 )
products. The grid-based water balance model was used to over the length of the growing period. In the case of irri-
estimate the crop water use for 126 primary crops; for the gated crop production, the green and blue water use is cal-
other 20 crops, which are grown in only few countries, the culated by performing two different soil water balance sce-
CROPWAT 8.0 model was used. narios as proposed in Hoekstra et al. (2011) and also ap-
The actual crop evapotranspiration (ETa , mm day−1 ) de- plied by FAO (2005), Siebert and Döll (2010) and Liu and
pends on climate parameters (which determine potential Yang (2010). The first soil water balance scenario is carried
evapotranspiration), crop characteristics and soil water avail- out based on the assumption that the soil does not receive any
ability (Allen et al., 1998): irrigation, but using crop parameters of irrigated crops (such
as rooting depth as under irrigation conditions). The second
ETa [t] = Kc [t] × Ks [t] × ETo [t] (1) soil water balance scenario is carried out with the assumption
that the amount of actual irrigation is sufficient to meet the
where Kc is the crop coefficient, Ks [t] a dimensionless tran-
irrigation requirement, applying the same crop parameters as
spiration reduction factor dependent on available soil water
in the first scenario. The green crop water use of irrigated
with a value between zero and one and ETo [t] the refer-
crops is assumed to be equal to the actual crop evapotranspi-
ence evapotranspiration (mm day−1 ). The crop coefficient
ration as was calculated in the first scenario. The blue crop
varies in time, as a function of the plant growth stage. Dur-
water use is then equal to the crop water use over the growing
ing the initial and mid-season stages, Kc is a constant and
period as simulated in the second scenario minus the green
equals Kc,ini and Kc,mid respectively. During the crop de-
crop water use as estimated in the first scenario.
velopment stage, Kc is assumed to linearly increase from
Crop growth and yield are affected by water stress. To
Kc,ini to Kc,mid . In the late season stage, Kc is assumed to
account for the effect of water stress, a linear relationship
decrease linearly from Kc,mid to Kc,end . Crop coefficients
between yield and crop evapotranspiration was proposed by
(Kc ’s) were obtained from Chapagain and Hoekstra (2004).
Doorenbos and Kassam (1979):
Crop planting dates and lengths of cropping seasons were ob- P
tained from FAO (2008d), Sacks et al. (2010), Portmann et Ya ETa [t]
1− = Ky 1 − P (3)
al. (2010) and USDA (1994). For some crops, values from Ym CWR[t]
Chapagain and Hoekstra (2004) were used. We have not con-
where Ky is a yield response factor (water stress coeffi-
sidered multi-cropping practices. Monthly long-term aver-
cient), Ya the actual harvested yield (kg ha−1 ), Ym the max-
age reference evapotranspiration data at 10 by 10 arc minute
imum yield (kg ha−1 ), ETa the actual crop evapotranspira-
resolution were obtained from FAO (2008c). The 10 by 10
tion in mm/period and CWR the crop water requirement in
arc minute data were converted to 5 by 5 arc minute resolu-
mm period−1 (which is equal to Kc ×ET0 ). Ky values for in-
tion by assigning the 10 by 10 minute data to each of the four
dividual periods and the complete growing period are given
5 by 5 minute grid cells. Following the CROPWAT approach,
in Doorenbos and Kassam (1979). The maximum yield val-
the monthly average data were converted to daily values by
ues for each crop were obtained by multiplying the corre-
curve fitting to the monthly average through polynomial in-
sponding national average yield values by a factor of 1.2
terpolation.
(Reynolds et al., 2000). The actual yields, which are calcu-
The value of Ks is calculated on a daily basis as a function
lated per grid cell, are averaged over the nation and compared
of the maximum and actual available soil moisture in the root
with the national average yield data (for the period 1996–
zone.
2005) obtained from FAO (2008a). The calculated yield val-
S[t] ues are scaled to fit the national average FAO yield data.
(1−p)×Smax [t] if S[t] < (1 − p) × Smax [t]
Ks [t] = (2) The green and blue water footprints of primary crops
1 Otherwise (m3 ton−1 ) are calculated by dividing the total volume of
green and blue water use (m3 yr−1 ), respectively, by the
where S[t] is the actual available soil moisture at time t (in quantity of the production (ton yr−1 ).
mm); Smax [t] the maximum available soil water in the root The grey water footprint is calculated by quantifying the
zone, i.e., the available soil water in the root zone when soil volume of water needed to assimilate the nutrients that reach
water content is at field capacity (mm); and p the fraction ground- or surface water. Nutrients leaching from agricul-
of Smax that a crop can extract from the root zone without tural fields are a main cause of non-point source pollution
www.hydrol-earth-syst-sci.net/15/1577/2011/ Hydrol. Earth Syst. Sci., 15, 1577–1600, 2011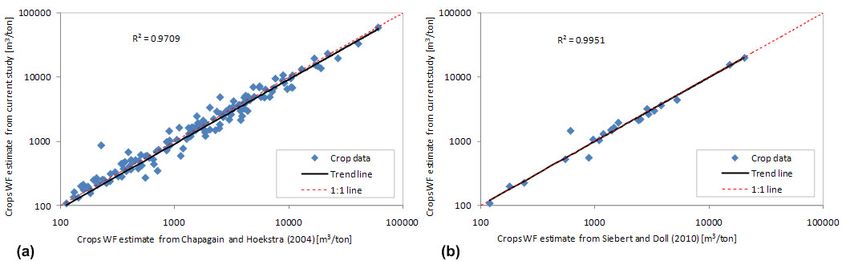
1580                                   M. M. Mekonnen and A. Y. Hoekstra: The green, blue and grey water footprint of crops

of surface and subsurface water bodies. In this study we          six 5 by 5 arc minute grid cells contained in the 30 by 30 arc
have quantified the grey water footprint related to nitro-        minute grid cell. Daily precipitation values were generated
gen use only. The grey component of the water footprint           from the monthly average values using the CRU-dGen daily
(m3 ton−1 ) is calculated by multiplying the fraction of ni-      weather generator model (Schuol and Abbaspour, 2007).
trogen that leaches or runs off by the nitrogen application          Crop growing areas on a 5 by 5 arc minute grid cell res-
rate (kg ha−1 ) and dividing this by the difference between       olution were obtained from Monfreda et al. (2008). For
the maximum acceptable concentration of nitrogen (kg m−3 )        countries missing grid data in Monfreda et al. (2008), the
and the natural concentration of nitrogen in the receiving wa-    MICRA2000 grid database as described in Portmann et
ter body (kg m−3 ) and by the actual crop yield (ton ha−1 ).      al. (2010) was used to fill the gap. The harvested crop ar-
Country-specific nitrogen fertilizer application rates by crop    eas as available in grid format were aggregated to a national
have been estimated based on Heffer (2009), FAO (2006,            level and scaled to fit national average crop harvest areas for
2009) and IFA (2009). Since grid-based fertilizer application     the period 1996–2005 obtained from FAO (2008a).
rates are not available, we have assumed that crops receive          Grid data on the irrigated fraction of harvested crop ar-
the same amount of nitrogen fertilizer per hectare in all grid    eas for 24 major crops were obtained from the MICRA2000
cells in a country. We have further assumed that on average       database (Portmann et al., 2010). For the other 102 crops
10 % of the applied nitrogen fertilizer is lost through leach-    considered in the current study, we used the data for “other
ing, following Chapagain et al. (2006). The recommended           perennial” and “other annual crops” as in the MICRA2000
maximum value of nitrate in surface and groundwater by the        database, depending on whether the crop is categorised un-
World Health Organization and the European Union is 50 mg         der “perennial” or “annual” crops.
nitrate (NO3 ) per litre and the maximum value recommended
by US-EPA is 10 mg per litre measured as nitrate-nitrogen
(NO3 -N). In this study we have used the standard of 10 mg        3     Results
per litre of nitrate-nitrogen (NO3 -N), following again Cha-
pagain et al. (2006). Because of lack of data, the natural        3.1    The global picture
nitrogen concentrations were assumed to be zero.
   The water footprints of crops as harvested have been used      The global water footprint of crop production in the pe-
as a basis to calculate the water footprints of derived crop      riod 1996–2005 was 7404 Gm3 yr−1 (78 % green, 12 % blue,
products based on product and value fractions and water foot-     and 10 % grey). Wheat takes the largest share in this to-
prints of processing steps following the method as in Hoek-       tal volume; it consumed 1087 Gm3 yr−1 (70 % green, 19 %
stra et al. (2011). For the calculation of the water footprints   blue, 11 % grey). The other crops with a large total water
of derived crop products we used product and value fraction.      footprint are rice (992 Gm3 yr−1 ) and maize (770 Gm3 yr−1 ).
Most of these fractions have been taken from FAO (2003) and       The contribution of the major crops to the global water foot-
Chapagain and Hoekstra (2004). The product fraction of a          print related to crop production is presented in Fig. 1. The
product is defined as the quantity of output product obtained     global average green water footprint related to crop pro-
per quantity of the primary input product. The value fraction     duction was 5771 Gm3 yr−1 , of which rain-fed crops use
of a product is the ratio of the market value of the product      4701 Gm3 yr−1 and irrigated crops use 1070 Gm3 yr−1 . For
to the aggregated market value of all the products obtained       most of the crops, the contribution of green water footprint
from the input product (Hoekstra et al., 2011). Products and      toward the total consumptive water footprint (green and blue)
by-products have both a product fraction and value fraction.      is more than 80 %. Among the major crops, the contri-
On the other hand, residues (e.g. bran of crops) have only a      bution of green water toward the total consumptive water
product fraction and we have assumed their value fraction to      footprint is lowest for date palm (43 %) and cotton (64 %).
be close to zero.                                                 The global average blue water footprint related to crop pro-
   The water footprint per unit of energy for ethanol and         duction was 899 Gm3 yr−1 . Wheat (204 Gm3 yr−1 ) and rice
biodiesel producing crops was calculated following the            (202 Gm3 yr−1 ) have large blue water footprint together ac-
method as applied in Gerbens-Leenes et al. (2009). Data on        counting for 45 % of the global blue water footprint. The
the dry mass of crops, the carbohydrate content of ethanol        grey water footprint related to the use of nitrogen fertilizer in
providing crops, the fat content of biodiesel providing crops     crops cultivation was 733 Gm3 yr−1 . Wheat (123 Gm3 yr−1 ),
and the higher heating value of ethanol and biodiesel were        maize (122 Gm3 yr−1 ) and rice (111 Gm3 yr−1 ) have large
taken from Gerbens-Leenes et al. (2008a, b) and summarized        grey water footprint together accounting for about 56 % of
in Table 1.                                                       the global grey water footprint.
   Monthly values for precipitation, number of wet days and          The green, blue, grey and total water footprints of crop
minimum and maximum temperature for the period 1996–              production per grid cell are shown in Fig. 2. Large wa-
2002 with a spatial resolution of 30 by 30 arc minute were        ter footprints per grid cell (>400 mm yr−1 ) are found in
obtained from CRU-TS-2.1 (Mitchell and Jones, 2005). The          the Ganges and Indus river basins (India, Pakistan and
30 by 30 arc minute data were assigned to each of the thirty-     Bangladesh), in eastern China and in the Mississippi river

Hydrol. Earth Syst. Sci., 15, 1577–1600, 2011                                     www.hydrol-earth-syst-sci.net/15/1577/2011/
M. M. Mekonnen and A. Y. Hoekstra: The green, blue and grey water footprint of crops 1581
Table 1. Characteristics of ten ethanol providing and seven biodiesel providing crops.
Fraction of Ethanol
Dry mass carbo- per unit Energy Bio-
Sugar and starch crops fraction hydrates in of carbo- yield∗ ethanol
(%) dry mass hydrate (GJ ton−1 ) yield∗∗
(g g−1 ) (g g−1 ) (l ton−1 )
Barley 85 % 0.76 0.53 10.2 434
Cassava 38 % 0.87 0.53 5.20 222
Maize 85 % 0.75 0.53 10.0 428
Potatoes 25 % 0.78 0.53 3.07 131
Rice, paddy 85 % 0.76 0.53 10.2 434
Rye 85 % 0.76 0.53 10.2 434
Sorghum 85 % 0.76 0.53 10.2 434
Sugar beet 21 % 0.82 0.51 2.61 111
Sugar cane 27 % 0.57 0.51 2.33 99
Wheat 85 % 0.76 0.53 10.17 434
Fraction
Dry mass of fat in Biodiesel Energy Biodiesel
Oil crops
fraction (%) dry mass per unit of yield∗ yield∗∗
(g g−1 ) fat (g g−1 ) (GJ ton−1 ) (l ton−1 )
Coconuts 50 % 0.03 1 0.57 17
Groundnuts, with shell 95 % 0.39 1 14.0 421
Oil palm fruit 85 % 0.22 1 7.05 213
Rapeseed 74 % 0.42 1 11.7 353
Seed cotton 85 % 0.23 1 7.37 222
Soybeans 92 % 0.18 1 6.24 188
Sunflower seed 85 % 0.22 1 7.05 213
* Based on a higher heating value of 29.7 kJ gram−1 for ethanol and 37.7 kJ gram−1 for biodiesel. ** Based on a density of 0.789 kg l−1 for ethanol and 0.88 kg l−1 for biodiesel
(Alptekin and Canakci, 2008).
Barley Sorghum Oil palm
Coconuts
Seed cotton 3% 2% 2% Millet
2%
3% 2% Natural rubber
Sugar cane 1%
Coffee, green
4%
2% Cassava
Soybeans
1%
5%
Groundnuts
1%
Fodder crops
9% Potatoes
1%
Beans, dry
1%
Other
28% Rapeseed
Maize 1%
10% Other crops
21%
Rice, paddy
13%
Wheat
15%
Fig. 1. Contribution of different crops to the total water footprint of crop production. Period: 1996–2005.
www.hydrol-earth-syst-sci.net/15/1577/2011/ Hydrol. Earth Syst. Sci., 15, 1577–1600, 2011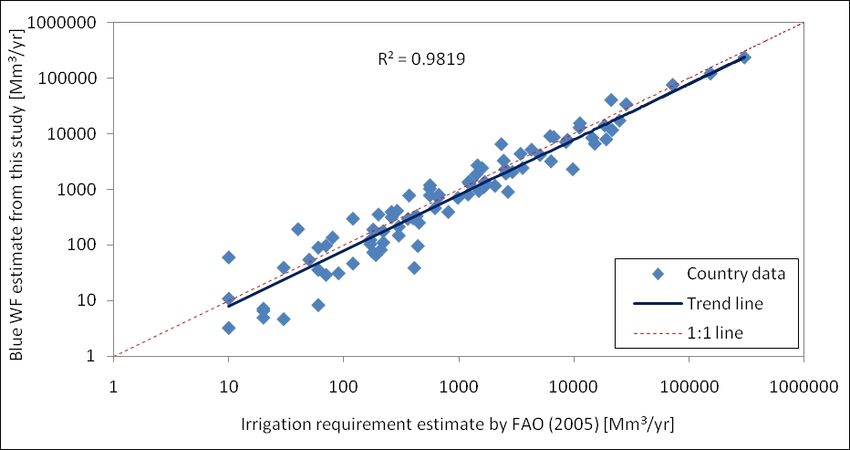
1582                                     M. M. Mekonnen and A. Y. Hoekstra: The green, blue and grey water footprint of crops

Fig. 2. The green, blue, grey and total water footprint of crop production estimated at a 5 by 5 arc minute resolution. The data are shown
in mm yr−1 and have been calculated as the aggregated water footprint per grid cell (in m3 yr−1 ) divided by the area of the grid cell.
Period: 1996–2005.

basin (USA). These locations are the same locations as where           footprint varies, however, across different crops per crop cat-
the harvested crop area takes a relative large share in the total      egory. Besides, if one considers the water footprint per kcal,
area (Monfreda et al., 2008).                                          the picture changes as well. Vegetables and fruits, which
   Globally, 86.5 % of the water consumed in crop produc-              have a relatively small water footprint per kg but a low caloric
tion is green water. Even in irrigated agriculture, green water        content, have a relatively large water footprint per kcal.
often has a very significant contribution to total water con-             Global average water footprints of selected primary crops
sumption. The share of the blue water footprint in total water         and their derived products are presented in Table 3. The re-
consumption (green plus blue water footprint) is shown in              sults allow us to compare the water footprints of different
Fig. 3. The share of the blue water footprint is largest in            products:
arid and semi-arid regions. Regions with a large blue water
proportion are located, for example, in the western part of               – The average water footprint for cereal crops is
the USA, in a relatively narrow strip of land along the west                1644 m3 ton−1 , but the footprint for wheat is relatively
coast of South America (Peru–Chile), in southern Europe,                    large (1827 m3 ton−1 ), while for maize it is relatively
North Africa, the Arabian peninsula, Central Asia, Pakistan                 small (1222 m3 ton−1 ). The average water footprint of
and northern India, northeast China and parts of Australia.                 rice is close to the average for all cereals together.

                                                                          – Sugar obtained from sugar beet has a smaller water foot-
3.2    The water footprint of primary crops and derived
                                                                            print than sugar from sugar cane. Besides, the blue com-
       crop products per ton
                                                                            ponent in the total water footprint of beet sugar (20 %)
                                                                            is smaller than for cane sugar (27 %).
The average water footprint per ton of primary crop dif-
fers significantly among crops and across production regions.             – For vegetable oils we find a large variation in water
Crops with a high yield or large fraction of crop biomass that              footprints: maize oil 2600 m3 ton−1 ; cotton-seed oil
is harvested generally have a smaller water footprint per ton               3800 m3 ton−1 ; soybean oil 4200 m3 ton−1 ; rapeseed oil
than crops with a low yield or small fraction of crop biomass               4300 m3 ton−1 ; palm oil 5000 m3 ton−1 ; sunflower oil
harvested. When considered per ton of product, commodi-                     6800 m3 ton−1 ; groundnut oil 7500 m3 ton−1 ; linseed
ties with relatively large water footprints are: coffee, tea, co-           oil 9400 m3 ton−1 ; olive oil 14500 m3 ton−1 ; castor oil
coa, tobacco, spices, nuts, rubber and fibres (Table 2). For                24700 m3 ton−1 .
food crops, the global average water footprint per ton of
crop increases from sugar crops (roughly 200 m3 ton−1 ), veg-             – For fruits we find a similar variation in water footprints:
etables (∼300 m3 ton−1 ), roots and tubers (∼400 m3 ton−1 ),                watermelon 235 m3 ton−1 ; pineapple 255 m3 ton−1 ;
fruits (∼1000 m3 ton−1 ), cereals (∼1600 m3 ton−1 ), oil                    papaya 460 m3 ton−1 ; orange 560 m3 ton−1 ; banana
crops (∼2400 m3 ton−1 ), pulses (∼4000 m3 ton−1 ), spices                   790 m3 ton−1 ; apple 820 m3 ton−1 ; peach 910 m3 ton−1 ;
(∼7000 m3 ton−1 ) to nuts (∼9000 m3 ton−1 ). The water                      pear 920 m3 ton−1 ; apricot 1300 m3 ton−1 ; plums 2200

Hydrol. Earth Syst. Sci., 15, 1577–1600, 2011                                           www.hydrol-earth-syst-sci.net/15/1577/2011/
M. M. Mekonnen and A. Y. Hoekstra: The green, blue and grey water footprint of crops 1583
Fig. 3. Contribution of the blue water footprint to the total consumptive (green and blue) water footprint of crop production. Period: 1996–
2005.
m3 ton−1 ; dates 2300 m3 ton−1 ; grapes 2400 m3 ton−1 ; water footprint of one product may be larger than the global
figs 3350 m3 ton−1 . average water footprint of another product, the comparison
may turn out quite differently for specific regions.
– For alcoholic beverages we find: a water footprint of
The water footprints of crops vary across countries and
300 m3 ton−1 for beer and 870 m3 ton−1 for wine.
regions as well. This is mainly due to differences in crop
– The water footprints of juices vary from tomato juice yields, as shown in Table 4 for the case of cereal crops. Rel-
(270 m3 ton−1 ), grapefruit juice (675 m3 ton−1 ), orange atively small water footprints per ton of cereal crops were
juice (1000 m3 ton−1 ) and apple juice (1100 m3 ton−1 ) calculated for Northern Europe (637 m3 ton−1 ) and Western
to pineapple juice (1300 m3 ton−1 ). Europe (654 m3 ton−1 ). On the other hand, with the excep-
tion of Southern Africa, the water footprints of cereal crops
– The water footprint of coffee (130 l cup−1 , based on use are quite large in most parts of Africa. While the average
of 7 gram of roasted coffee per cup) is much larger than crop water requirement in Europe was only 11 % lower to
the water footprint of tea (27 l cup−1 , based on use of 3 that observed in Africa, the average water footprint of ce-
gram of black tea per cup). real crops in Europe was about three times smaller than in
– The water footprint of cotton fibres is substantially Africa, which can mainly be explained by the higher aver-
larger than the water footprints of sisal and flax fibres, age yield in Europe (3.4 ton ha−1 ) compared to that observed
which are again larger than the water footprints of jute in Africa (1.3 ton ha−1 ). A similar observation can be made
and hemp fibres. for other regions as well: while crop water requirements in
America, on average, are higher than in Asia, due to a higher
One should be careful in drawing conclusions from the yield, the average water footprint of cereals in America is
above product comparisons. Although the global average smaller compared to the value calculated for Asia. Figure 4
www.hydrol-earth-syst-sci.net/15/1577/2011/ Hydrol. Earth Syst. Sci., 15, 1577–1600, 20111584 M. M. Mekonnen and A. Y. Hoekstra: The green, blue and grey water footprint of crops
Table 2. .Global average water footprint of 14 primary crop categories. Period: 1996–2005.
Water footprint
Caloric value∗ Water footprint
Primary crop category (m3 ton−1 )
(kcal kg−1 ) (l kcal−1 )
Green Blue Grey Total
Sugar crops 130 52 15 197 290 0.68
Fodder crops 207 27 20 253 – –
Vegetables 194 43 85 322 240 1.34
Roots and tubers 327 16 43 387 830 0.47
Fruits 727 147 93 967 460 2.10
Cereals 1232 228 184 1644 3200 0.51
Oil crops 2023 220 121 2364 2900 0.81
Tobacco 2021 205 700 2925 – –
Fibres, vegetal origin 3375 163 300 3837 – –
Pulses 3180 141 734 4055 3400 1.19
Spices 5872 744 432 7048 3000 2.35
Nuts 7016 1367 680 9063 2500 3.63
Rubber, gums, waxes 12 964 361 422 13 748 – –
Stimulants 13 731 252 460 14 443 880 16.4
∗ Source: FAO (2008a).
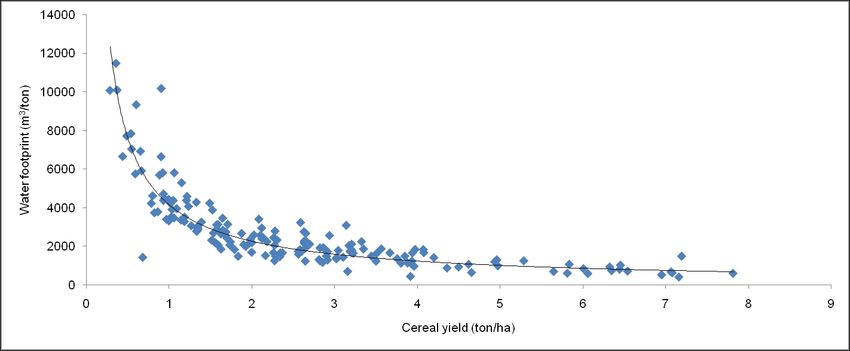
shows the relationship between cereal yield and water foot- print: 4750 m3 GJ−1 . Biodiesels from oil palm, rapeseed and
print, where the dots represent country averages. From the groundnuts are more efficient, with water footprints in the
figure we can observe a general trend between the water foot- range 150–200 m3 GJ−1 . The largest blue water footprint is
print and yield of cereals which follows a logarithmic func- observed for biodiesel from cotton: 177 m3 GJ−1 (32 % of
tion. This suggests that the water footprint of a crop, to a the total water footprint).
large extent, is influenced by agricultural management rather
than by the agro-climate under which the crop is grown and 3.4 The total water footprint of crop production at
that cannot be influenced by the farmer. This provides an op- national and sub-national level
portunity to improve water productivity, i.e., to produce more
food per unit of water consumption. According to Rock- At the country level, the largest total water footprints were
ström et al. (2003), this opportunity is particularly large in estimated for India, China, the USA, Brazil, Russia and In-
the range of low crop yields, due to the current large losses donesia. These six countries together account for about half
in non-productive green water evaporation. of the global total water footprint related to crop produc-
tion. The largest green water footprints are also found in
these six countries: India, China, the USA, Russia, Brazil
3.3 The water footprint of biofuels per GJ and per litre
and Indonesia. Data per country are shown in Table 6 for the
largest producers. At sub-national level (state or province
The water footprint of biofuel varies across both crops and
level), the largest green water footprints can be found in Ut-
countries. The variation is due to differences in crop yields
tar Pradesh (88 Gm3 yr−1 ), Maharashtra (86 Gm3 yr−1 ), Kar-
across countries and crops, differences in energy yields
nataka (65 Gm3 yr−1 ), Andhra Pradesh (61 Gm3 yr−1 ), and
across crops and differences in climate and agricultural prac-
Madhya Pradesh (60 Gm3 yr−1 ), all in India. The largest blue
tices across countries. Table 5 shows the global average
water footprints were calculated for India, China, the USA
water footprint of biofuel for a number of crops providing
and Pakistan. These four countries together account for 58 %
ethanol and some other crops providing biodiesel. Among
of the total blue water footprint related to crop production.
the crops providing ethanol, sorghum has the largest water
At sub-national level, the largest blue water footprints were
footprint, with 7000 l of water per litre of ethanol, which is
found in: Uttar Pradesh (59 Gm3 yr−1 ) and Madhya Pradesh
equivalent to 300 m3 GJ−1 . Bio-ethanol based on sugar beet
(24 Gm3 yr−1 ) in India; Punjab (50 Gm3 yr−1 ) in Pakistan;
has the smallest global average water footprint, with 1200 l
and California (20 Gm3 yr−1 ) in the USA. Large grey water
of water per litre of ethanol, equivalent to 50 m3 GJ−1 . In
footprints were estimated for China, the USA and India.
general, biodiesel has a larger water footprint per unit of en-
ergy obtained than bio-ethanol, a finding that is consistent
with Gerbens-Leenes et al. (2009). Among the crops stud-
ied here, biodiesel from coconuts has the largest water foot-
Hydrol. Earth Syst. Sci., 15, 1577–1600, 2011 www.hydrol-earth-syst-sci.net/15/1577/2011/M. M. Mekonnen and A. Y. Hoekstra: The green, blue and grey water footprint of crops 1585
Table 3. Global average water footprint of primary crops and derived crop products. Period: 1996–2005.
FAOSTAT Global average water
crop code Product description
footprint (m3 ton−1 )
Green Blue Grey Total
15 Wheat 1277 342 207 1827
Wheat flour 1292 347 210 1849
Wheat bread 1124 301 183 1608
Dry pasta 1292 347 210 1849
Wheat pellets 1423 382 231 2036
Wheat, starch 1004 269 163 1436
Wheat gluten 2928 785 476 4189
27 Rice, paddy 1146 341 187 1673
Rice, husked (brown) 1488 443 242 2172
Rice, broken 1710 509 278 2497
Rice flour 1800 535 293 2628
Rice groats and meal 1527 454 249 2230
44 Barley 1213 79 131 1423
Barley, rolled or flaked grains 1685 110 182 1977
Malt, not roasted 1662 108 180 1950
Malt, roasted 2078 135 225 2437
Beer made from malt 254 16 27 298
56 Maize (corn) 947 81 194 1222
Maize (corn) flour 971 83 199 1253
Maize (corn) groats and meal 837 72 171 1081
Maize (corn), hulled, pearled, sliced or kibbled 1018 87 209 1314
Maize (corn) starch 1295 111 265 1671
Maize (corn) oil 1996 171 409 2575
71 Rye 1419 25 99 1544
Rye flour 1774 32 124 1930
75 Oats 1479 181 128 1788
Oat groats and meal 2098 257 182 2536
Oats, rolled or flaked grains 1998 245 173 2416
79 Millet 4306 57 115 4478
83 Sorghum 2857 103 87 3048
89 Buckwheat 2769 144 229 3142
116 Potatoes 191 33 63 287
Tapioca of potatoes 955 165 317 1436
Potato flour and meal 955 165 317 1436
Potato flakes 694 120 230 1044
Potato starch 1005 173 333 1512
122 Sweet potatoes 324 5 53 383
125 Manioc (cassava) 550 0 13 564
Tapioca of cassava 2750 1 66 2818
Flour of cassava 1833 1 44 1878
Dried cassava 1571 1 38 1610
Manioc (cassava) starch 2200 1 53 2254
136 Taro (coco yam) 587 3 15 606
137 Yams 341 0 1 343
www.hydrol-earth-syst-sci.net/15/1577/2011/ Hydrol. Earth Syst. Sci., 15, 1577–1600, 20111586 M. M. Mekonnen and A. Y. Hoekstra: The green, blue and grey water footprint of crops
Table 3. Continued.
FAOSTAT Global average water
crop code Product description
footprint (m3 ton−1 )
Green Blue Grey Total
156 Sugar cane 139 57 13 210
Raw sugar, cane 1107 455 104 1666
Refined sugar 1184 487 111 1782
Fructose, chemically pure 1184 487 111 1782
Cane molasses 350 144 33 527
157 Sugar beet 82 26 25 132
Raw sugar, beet 535 167 162 865
176 Beans, dry 3945 125 983 5053
181 Broad beans, horse beans, dry 1317 205 496 2018
187 Peas, dry 1453 33 493 1979
191 Chick peas 2972 224 981 4177
195 Cow peas, dry 6841 10 55 6906
197 Pigeon peas 4739 72 683 5494
201 Lentils 4324 489 1060 5874
217 Cashew nuts 12 853 921 444 14 218
220 Chestnuts 2432 174 144 2750
221 Almonds, with shell 4632 1908 1507 8047
Almonds, shelled or peeled 9264 3816 3015 16 095
222 Walnuts, with shell 2805 1299 814 4918
Walnuts, shelled or peeled 5293 2451 1536 9280
223 Pistachios 3095 7602 666 11 363
224 Kola nuts 23 345 26 19 23 391
225 Hazelnuts, with shell 3813 1090 354 5258
Hazelnuts, shelled or peeled 7627 2180 709 10 515
226 Areca nuts 10 621 139 406 11 165
236 Soya beans 2037 70 37 2145
Soya sauce 582 20 11 613
Soya paste 543 19 10 572
Soya curd 2397 83 44 2523
Soy milk 3574 123 65 3763
Soya bean flour and meals 2397 83 44 2523
Soybean oil, refined 3980 137 73 4190
Soybean oilcake 1690 58 31 1779
242 Groundnuts in shell 2469 150 163 2782
Groundnuts shelled 3526 214 234 3974
Groundnut oil , refined 6681 405 442 7529
Groundnut oilcake 1317 80 87 1484
Hydrol. Earth Syst. Sci., 15, 1577–1600, 2011 www.hydrol-earth-syst-sci.net/15/1577/2011/M. M. Mekonnen and A. Y. Hoekstra: The green, blue and grey water footprint of crops 1587
Table 3. Continued.
FAOSTAT Global average water
crop code Product description
footprint (m3 ton−1 )
Green Blue Grey Total
249 Coconuts 2669 2 16 2687
Copra 2079 1 12 2093
Coconut (husked) 1247 1 7 1256
Coconut (copra) oil , refined 4461 3 27 4490
Coconut/copra oilcake 829 1 5 834
Coconut (coir) fibre, processed 2433 2 15 2449
254 Oil palm 1057 0 40 1098
Palm nuts and kernels 2762 1 105 2868
Palm oil, refined 4787 1 182 4971
Palm kernel/babassu oil, refined 5202 1 198 5401
Palm nut/kernel oilcake 802 0 31 833
260 Olives 2470 499 45 3015
Olive oil, virgin 11 826 2388 217 14 431
Olive oil, refined 12 067 2437 221 14 726
265 Castor oil seeds 8423 1175 298 9896
Castor oil 21 058 2938 744 24 740
267 Sunflower seeds 3017 148 201 3366
Sunflower seed oil, refined 6088 299 405 6792
Sunflower seed oilcake 1215 60 81 1356
270 Rapeseed 1703 231 336 2271
Rape oil, refined 3226 438 636 4301
Rape seed oilcake 837 114 165 1115
280 Safflower seeds 6000 938 283 7221
289 Sesame seed 8460 509 403 9371
Sesame oil 19 674 1183 936 21 793
292 Mustard seeds 2463 1 345 2809
296 Poppy seeds 1723 0 464 2188
299 Melon seed 5087 56 41 5184
328 Seed cotton 2282 1306 440 4029
Cotton seeds 755 432 146 1332
Cotton lint 5163 2955 996 9113
Cotton linters 1474 844 284 2602
Cotton-seed oil, refined 2242 1283 432 3957
Cotton seed oilcake 487 279 94 860
Cotton, not carded or combed 5163 2955 996 9113
Cotton yarn waste (including thread waste) 950 544 183 1677
Garneted stock of cotton 1426 816 275 2517
Cotton, carded or combed 5359 3067 1034 9460
Cotton fabric, finished textile 5384 3253 1344 9982
333 Linseed 4730 268 170 5168
Linseed oil, refined 8618 488 310 9415
Linseed oilcake 2816 160 101 3077
336 Hempseed 3257 12 417 3685
358 Cabbages and other brassicas 181 26 73 280
www.hydrol-earth-syst-sci.net/15/1577/2011/ Hydrol. Earth Syst. Sci., 15, 1577–1600, 20111588 M. M. Mekonnen and A. Y. Hoekstra: The green, blue and grey water footprint of crops
Table 3. Continued.
FAOSTAT Global average water
crop code Product description
footprint (m3 ton−1 )
Green Blue Grey Total
366 Artichokes 478 242 98 818
367 Asparagus 1524 119 507 2150
372 Lettuce 133 28 77 237
373 Spinach 118 14 160 292
388 Tomatoes 108 63 43 214
Tomato juice unfermented & not spirited 135 79 53 267
Tomato juice, concentrated 539 316 213 1069
Tomato paste 431 253 171 855
Tomato ketchup 270 158 107 534
Tomato puree 360 211 142 713
Peeled tomatoes 135 79 53 267
Tomato, dried 2157 1265 853 4276
393 Cauliflowers and broccoli 189 21 75 285
Brussels sprouts 189 21 75 285
394 Pumpkins, squash and gourds 228 24 84 336
397 Cucumbers and gherkins 206 42 105 353
399 Eggplants (aubergines) 234 33 95 362
401 Chillies and peppers, green 240 42 97 379
402 Onions (incl. shallots), green 176 44 51 272
403 Onions, dry 192 88 65 345
406 Garlic 337 81 170 589
Garlic powder 1297 313 655 2265
414 Beans, green 320 54 188 561
417 Peas, green 382 63 150 595
423 String beans 301 104 143 547
426 Carrots and turnips 106 28 61 195
430 Okra 474 36 65 576
446 Maize, green 455 157 88 700
461 Carobs 4557 334 703 5594
486 Bananas 660 97 33 790
489 Plantains 1570 27 6 1602
490 Oranges 401 110 49 560
Orange juice 729 199 90 1018
495 Tangerines, mandarins, clement 479 118 152 748
497 Lemons and limes 432 152 58 642
507 Grapefruit 367 85 54 506
Hydrol. Earth Syst. Sci., 15, 1577–1600, 2011 www.hydrol-earth-syst-sci.net/15/1577/2011/M. M. Mekonnen and A. Y. Hoekstra: The green, blue and grey water footprint of crops 1589
Table 3. Continued.
FAOSTAT Global average water
crop code Product description
footprint (m3 ton−1 )
Green Blue Grey Total
515 Apples, fresh 561 133 127 822
Apples, dried 4678 1111 1058 6847
Apple juice unfermented & not spirited 780 185 176 1141
521 Pears 645 94 183 922
526 Apricots 694 502 92 1287
530 Sour cherries 1098 213 99 1411
531 Cherries 961 531 112 1604
534 Peaches and nectarines 583 188 139 910
536 Plums and sloes 1570 188 422 2180
544 Strawberries 201 109 37 347
547 Raspberries 293 53 67 413
549 Gooseberries 487 8 31 526
550 Currants 457 19 23 499
552 Blueberries 341 334 170 845
554 Cranberries 91 108 77 276
560 Grapes 425 97 87 608
Grapes, dried 1700 386 347 2433
Grapefruit juice 490 114 71 675
Grape wines, sparkling 607 138 124 869
567 Watermelons 147 25 63 235
569 Figs 1527 1595 228 3350
571 Mangoes, mangosteens, guavas 1314 362 124 1800
572 Avocados 849 283 849 1981
574 Pineapples 215 9 31 255
Pineapple juice 1075 45 153 1273
577 Dates 930 1250 98 2277
591 Cashew apple 3638 34 121 3793
592 Kiwi fruit 307 168 38 514
600 Papayas 399 40 21 460
656 Coffee, green 15 249 116 532 15 897
Coffee, roasted 18 153 139 633 18 925
661 Cocoa beans 19 745 4 179 19 928
Cocoa paste 24 015 5 218 24 238
Cocoa butter, fat and oil 33 626 7 305 33 938
Cocoa powder 15 492 3 141 15 636
Chocolate 16 805 198 193 17 196
667 Green and black tea 7232 898 726 8856
www.hydrol-earth-syst-sci.net/15/1577/2011/ Hydrol. Earth Syst. Sci., 15, 1577–1600, 20111590 M. M. Mekonnen and A. Y. Hoekstra: The green, blue and grey water footprint of crops
Table 3. Continued.
FAOSTAT Global average water
crop code Product description
footprint (m3 ton−1 )
Green Blue Grey Total
677 Hop cones 2382 269 1414 4065
Hop extract 9528 1077 5654 16 259
687 Pepper of the genus Piper 6540 467 604 7611
689 Chillies and peppers, dry 5869 1125 371 7365
692 Vanilla beans 86 392 39 048 1065 12 6505
693 Cinnamon (canella) 14 853 41 632 15 526
698 Cloves 59 834 30 1341 61 205
702 Nutmeg, mace and cardamoms 30 683 2623 1014 34 319
711 Anise, badian, fennel, coriander 5369 1865 1046 8280
Coriander seeds 5369 1865 1046 8280
720 Ginger 1525 40 92 1657
748 Peppermint 206 63 19 288
773 Flax fibre and tow 2637 443 401 3481
Flax fibre, otherwise processed but not spun 2866 481 436 3783
Flax tow and waste 581 98 88 767
777 Hemp fibre and tow 1824 – 624 2447
True hemp fibre processed but not spun 2026 – 693 2719
780 Jute and other textile bast fibres 2356 33 217 2605
788 Ramie 3712 201 595 4507
789 Sisal 6112 708 222 7041
Sisal textile fibres processed but not spun 6791 787 246 7824
800 Agave fibres 6434 9 106 6549
809 Manila fibre (Abaca) 19 376 246 766 20 388
Abaca fibre, processed but not spun 21 529 273 851 22 654
826 Tobacco, unmanufactured 2021 205 700 2925
836 Natural rubber 12 964 361 422 13 748
3.5 The total water footprint of crop production at river ter footprint. Both basins are under severe water stress (Al-
basin level camo et al., 2007).
At the river basin level, large water footprints were calcu- 3.6 The water footprint in irrigated versus rain-fed
lated for the Mississippi, Ganges, Yangtze, Indus and Parana agriculture
river basins (Table 7). These five river basins together ac-
count for 23 % of the global water footprint related to crop For most of the crops, the global average consumptive water
production. The largest green water footprint was calculated footprint (blue plus green water footprint) per ton of crop was
for the Mississippi river basin (424 Gm3 yr−1 ). The largest lower for irrigated crops than for rain-fed crops (Table 8).
blue water footprints were found in the basins of the In- This is because, on average, irrigated yields are larger than
dus (117 Gm3 yr−1 ) and Ganges (108 Gm3 yr−1 ). These two rain-fed yields. For wheat, the water footprint per ton in ir-
river basins together account for 25 % of the global blue wa- rigated and rain-fed agriculture are very similar at the global
Hydrol. Earth Syst. Sci., 15, 1577–1600, 2011 www.hydrol-earth-syst-sci.net/15/1577/2011/M. M. Mekonnen and A. Y. Hoekstra: The green, blue and grey water footprint of crops 1591
Fig. 4. The relationship between average cereal yield and water footprint per ton of cereal. Period: 1996–2005. The dots represent average
country data.
Table 4. Crop water requirement, production, area, yield and water footprint per ton per region for cereal crops (1996–2005).
Crop water Total % Total %
requirement production irrigated area irrigated Yield (ton ha−1 ) Water footprint (m3 ton−1 )
Region
(mm period−1 ) (106 production (106 area
ton yr−1 ) ha yr−1 ) Rain-fed Irrigated average Green Blue Grey Total
Africa 527 122 23 94 7 1.08 4.25 1.30 3044 243 101 3388
Central Africa 448 5 2 6 1 0.84 1.72 0.84 4616 25 17 4658
Eastern Africa 561 30 13 24 7 1.20 2.21 1.27 3572 118 56 3746
Northern Africa 602 35 62 21 19 0.80 5.36 1.68 1897 672 242 2811
Southern Africa 614 13 13 5 8 2.21 3.68 2.32 1727 80 119 1926
Western Africa 465 39 3 38 1 1.02 2.82 1.03 3846 40 17 3903
Asia 546 1014 67 320 53 2.22 3.99 3.17 1166 379 228 1774
Central Asia 492 22 26 17 14 1.12 2.40 1.30 2272 289 13 2574
Eastern Asia 475 447 81 91 76 3.89 5.26 4.94 707 238 250 1195
Middle East 613 6 47 4 25 1.07 2.87 1.53 2123 543 325 2991
South-Eastern Asia 665 174 47 51 39 2.91 4.12 3.38 1578 180 154 1912
Southern Asia 549 326 67 139 54 1.67 2.93 2.35 1421 678 255 2354
Western Asia 576 40 28 19 22 1.96 2.61 2.11 1698 413 189 2300
America 578 535 19 125 13 3.97 6.39 4.28 1028 92 174 1294
Caribbean 555 2 50 1 32 1.51 3.17 2.04 2021 325 14 2359
Central America 483 33 34 13 27 2.39 3.31 2.64 1598 149 261 2008
Northern America 589 392 19 76 11 4.70 8.60 5.14 828 85 182 1094
South America 589 108 15 35 11 2.91 4.40 3.07 1558 96 123 1778
Europe 470 418 10 125 6 3.21 5.63 3.36 1054 41 119 1214
Eastern Europe 492 180 5 79 4 2.25 2.95 2.27 1645 38 113 1795
Northern Europe 284 47 2 9 2 5.16 5.73 5.17 522 1 114 637
Southern Europe 516 70 29 18 16 3.18 7.07 3.81 907 140 170 1217
Western Europe 421 121 9 18 6 6.62 8.99 6.77 528 14 111 654
Oceania 624 35 7 18 3 1.87 5.21 1.96 1787 66 116 1969
World 538 2117 41 679 30 2.63 4.26 3.11 1232 228 184 1644
scale. For soybean, sugarcane and rapeseed, the water foot- evapotranspiration that will approach or equal potential evap-
prints per ton were substantially smaller in rain-fed produc- otranspiration. Under rain-fed conditions, the actual evapo-
tion. The reason is that, although yields are higher under irri- transpiration over the growing period is generally lower than
gation for soybean and sugarcane, there is more water avail- the potential evapotranspiration. In the case of rapeseed, the
able to meet crop water requirements, leading to an actual global average rain-fed yield is larger than global average
www.hydrol-earth-syst-sci.net/15/1577/2011/ Hydrol. Earth Syst. Sci., 15, 1577–1600, 20111592 M. M. Mekonnen and A. Y. Hoekstra: The green, blue and grey water footprint of crops
Table 5. Global average water footprint of biofuel for ten crops providing ethanol and seven crops providing biodiesel. Period: 1996–2005.
Water footprint per Water footprint per
Crop unit of energy litre of biofuel
Green Blue Grey Green Blue Grey
Crops for ethanol m3 per GJ ethanol litres water per litre ethanol
Barley 119 8 13 2796 182 302
Cassava 106 0 3 2477 1 60
Maize 94 8 19 2212 190 453
Potatoes 62 11 21 1458 251 483
Rice, paddy 113 34 18 2640 785 430
Rye 140 2 10 3271 58 229
Sorghum 281 10 9 6585 237 201
Sugar beet 31 10 10 736 229 223
Sugar cane 60 25 6 1400 575 132
Wheat 126 34 20 2943 789 478
Crops for biodiesel m3 per GJ biodiesel litres water per litre biodiesel
Coconuts 4720 3 28 156585 97 935
Groundnuts 177 11 12 5863 356 388
Oil palm 150 0 6 4975 1 190
Rapeseed 145 20 29 4823 655 951
Seed cotton 310 177 60 10274 5879 1981
Soybeans 326 11 6 10825 374 198
Sunflower 428 21 28 14200 696 945
Table 6. The water footprint of crop production in selected coun- Table 7. The water footprint of crop production in selected river
tries (1996–2005). basins (1996–2005).
Water footprint of crop Water footprint of crop
Country production (Gm3 yr−1 ) River basin∗ production (Gm3 yr−1 )
Green Blue Grey Total Green Blue Grey Total
India 716.0 231.4 99.4 1047 Mississippi 424 40 70 534
China 623.9 118.9 223.8 967 Ganges 260 108 39 408
USA 612.0 95.9 118.2 826 Yangtze (Chang Jiang) 177 18 61 256
Brazil 303.7 8.9 16.0 329 Indus 102 117 34 253
Russia 304.8 10.4 11.6 327 Parana 237 3.2 9.4 250
Indonesia 285.5 11.5 20.9 318 Niger 186 1.7 0.5 188
Nigeria 190.6 1.1 0.6 192 Nile 131 29 6.9 167
Argentina 157.6 4.3 5.0 167 Huang He (Yellow River) 80 21 31 132
Canada 120.3 1.6 18.2 140 Nelson 108 1.5 18 128
Pakistan 40.6 74.3 21.8 137 Danube 106 1.8 11 119
Krishna 89 21 8.7 118
World 5771 899 733 7404
Volga 101 3.4 3.9 108
Ob 92 1.8 1.8 95
World 5771 899 733 7404
irrigated yield which results in a smaller water footprint un- ∗ River basins grid data from Global Runoff Data Centre (2007).
der rain-fed compared to irrigated crops. The reason for
this is that those countries with a high yield happen to be
countries with a large share of rain-fed harvested crop area. pletely rain-fed. On the other hand, in countries such as Al-
For example, a high crop yield is observed for rapeseed in geria, Pakistan and India, where the share of irrigated crop is
most parts of Western Europe, where rapeseed is almost com- high, the irrigated yield is quite low compared to the rain-fed
Hydrol. Earth Syst. Sci., 15, 1577–1600, 2011 www.hydrol-earth-syst-sci.net/15/1577/2011/M. M. Mekonnen and A. Y. Hoekstra: The green, blue and grey water footprint of crops 1593
yield in Western Europe. Globally, rain-fed agriculture has a ferences are observed in the larger countries such as the USA,
water footprint of 5173 Gm3 yr−1 (91 % green, 9 % grey); ir- Russia, China and Brazil. Chapagain and Hoekstra (2004)
rigated agriculture has a water footprint of 2230 Gm3 yr−1 have taken national average climatic data to calculate crop
(48 % green, 40 % blue, 12 % grey). evapotranspiration, which in particular for the large countries
mentioned above has led to a different estimate compared
to the current study. There are also differences between the
4 Discussion two studies in the planting and harvesting dates and thus the
length of growing period for the different crops considered.
In order to compare our estimates with previous studies, we The estimate of the total water footprint by Liu and
have selected those studies which estimated the water foot- Yang (2010) is 11 % lower than our estimate. The reason for
print in global crop production and made an explicit distinc- the difference probably lies in the number of crops explicitly
tion between green and blue water (Table 9). The study by considered in the two studies: in the current study we have
Chapagain and Hoekstra (2004) did not take a grid-based ap- considered 146 crops explicitly while Liu and Yang (2010)
proach and also did not make the green-blue distinction per have considered 20 crops and grouped the rest into 2 broad
crop and per country, unlike the current study and the stud- crop categories. In Fig. 5b, the total (green plus blue) wa-
ies by Rost et al. (2008), Liu and Yang (2010), Siebert and ter footprints by country as estimated in the current study are
Döll (2010) and Hanasaki et al. (2010). plotted against the results from Liu and Yang (2010). There
A comparison of our estimates with earlier studies shows is a close agreement between the two studies with an r 2 value
that the order of magnitude is similar in all studies. The es- of 0.96. The differences between the two studies can be par-
timate of the total water footprint related to crop production tially explained by differences in the method used to esti-
by Hanasaki et al. (2010) is 6 % higher than our estimate, mate reference evapotranspiration. The blue water footprint
while the estimate of Liu and Yang (2010) is 11 % lower. per country as computed in this study compares to the result
Our study is at the high side regarding the estimation of the from Liu and Yang (2010) as shown in Fig. 6a. The correla-
global green water footprint and at the low side regarding the tion is reasonably well, with an r 2 value of 0.78.
blue water footprint. Although there are major differences The computed total (green plus blue) water footprint is al-
in applied models and assumptions, the models agree on the most the same as the value found by Siebert and Döll (2010).
dominant role of green water in global crop production. The However, the green water footprint estimated by Siebert and
study by Rost et al. (2008) gives a higher green water foot- Döll (2010) is 4.6 % lower than in the current study, while
print than the other studies, but this can be explained by the their blue water footprint estimate is 31 % higher. At coun-
fact that evapotranspiration from croplands is estimated here try level, the blue water footprint estimates in the two stud-
over the whole year, instead of over the growing periods of ies correlate well, with an r 2 value of 0.99, but our es-
the crops. The estimate of the total water footprint related timates are consistently lower (Fig. 6b). For most crops
to crop production by Fader et al. (2011) is only 4 % higher there is a good agreement between the current estimate of
than our estimate. The differences in the outcomes of the var- the total blue water footprint and the one by Siebert and
ious studies can be due to a variety of causes, including: type Döll (2010). However, their total blue water footprint esti-
of model, spatial resolution, period considered and data re- mate for rice (307 Gm3 yr−1 ) is 52 % higher than our esti-
garding cultivated and irrigated areas, growing periods, crop mate (202 Gm3 yr−1 ). The reason for the difference could be
parameters, soil and climate. differences in the planting and harvesting dates and thus the
Chapagain and Hoekstra (2004) have estimated the global length of the growing period in the two studies.
water footprint of crop production distinguishing between The national blue water footprints estimated in the current
green and blue only at the global level, but not per country study were further compared with statistics on agricultural
and per crop. Our estimate of the total (green plus blue) wa- water withdrawals per country as available from AQUASTAT
ter footprint is 4 % higher than that of Chapagain and Hoek- (FAO, 2008b). Since water withdrawals are higher than ac-
stra (2004). The total water footprint per country estimated tual blue water consumption, we first estimated the latter by
in the current study compares reasonably well with the esti- multiplying the water withdrawal per country by the irriga-
mates by Chapagain and Hoekstra (2004), with an r 2 value tion efficiency. Overall irrigation efficiency data per country
of 0.96 (Fig. 5a). The trend line almost fits the 1:1 line. The were obtained from Rohwer et al. (2007), whereby irrigation
close agreement between the two studies and the slightly efficiency refers here to the fraction of water diverted from
higher estimate in the current study is surprising. Due to the water source that is available for beneficial crop evapo-
limited data availability at the time, Chapagain and Hoek- transpiration. The blue water footprint per country computed
stra (2004) estimated crop water consumption based on the in the current study generally compares well with the derived
assumption of no water stress, so that actual equals potential values based on AQUASTAT and Rohwer et al. (2007), with
evapotranspiration and their estimate is expected to be at the an r 2 value of 0.94 (Fig. 7a). Compared to the AQUAS-
high side. There could be a number of reasons for the lower TAT values, our estimates are slightly lower (6 %). A rea-
estimate in Chapagain and Hoekstra (2004). Some of the dif- son may be that water withdrawals in agriculture do not refer
www.hydrol-earth-syst-sci.net/15/1577/2011/ Hydrol. Earth Syst. Sci., 15, 1577–1600, 2011You can also read