The Future of Water Supply - Briefing Paper No 4/2004 - NSW Government
←
→
Page content transcription
If your browser does not render page correctly, please read the page content below
NSW PARLIAMENTARY LIBRARY
     RESEARCH SERVICE

 The Future of Water Supply

               by

          Stewart Smith

     Briefing Paper No 4/2004
ISSN 1325-4456 ISBN 0 7313 1757 2 April 2004 © 2004 Except to the extent of the uses permitted under the Copyright Act 1968, no part of this document may be reproduced or transmitted in any form or by any means including information storage and retrieval systems, without the prior written consent from the Librarian, New South Wales Parliamentary Library, other than by Members of the New South Wales Parliament in the course of their official duties.
The Future of Water Supply

              by

         Stewart Smith
NSW PARLIAMENTARY LIBRARY RESEARCH SERVICE David Clune (MA, PhD, Dip Lib), Manager.................................................. (02) 9230 2484 Gareth Griffith (BSc (Econ) (Hons), LLB (Hons), PhD), Senior Research Officer, Politics and Government / Law................................ (02) 9230 2356 Talina Drabsch (BA, LLB (Hons)), Research Officer, Law............................ (02) 9230 2768 Rowena Johns (BA (Hons), LLB), Research Officer, Law............................. (02) 9230 2003 Lenny Roth (BCom, LLB), Research Officer, Law........................................ (02) 9230 3085 Stewart Smith (BSc (Hons), MELGL), Research Officer, Environment .......... (02) 9230 2798 John Wilkinson (MA, PhD), Research Officer, Economics............................. (02) 9230 2006 Should Members or their staff require further information about this publication please contact the author. Information about Research Publications can be found on the Internet at: www.parliament.nsw.gov.au/WEB_FEED/PHWebContent.nsf/PHPages/LibraryPublications Advice on legislation or legal policy issues contained in this paper is provided for use in parliamentary debate and for related parliamentary purposes. This paper is not professional legal opinion.
CONTENTS

EXECUTIVE SUMMARY................................................................................................ 1
1.0          Introduction........................................................................................................ 1
2.0          History of Sydney's Water Supply System........................................................... 1
2.1          The Sydney Water Supply Institutional Framework.............................................. 2
3.0          The Use of Water in Sydney............................................................................... 4
3.1          Demand Management ......................................................................................... 9
4.0          Responding to Drought ..................................................................................... 12
5.0          Water Supply in Rural and Regional Areas ........................................................ 16
6.0          Water Pricing.................................................................................................... 17
7.0          The Future of Water Supply.............................................................................. 20
8.0          Conclusion........................................................................................................ 23
The Future of Water Supply

EXECUTIVE SUMMARY

Australia, being one of the driest countries on earth, will not be able to escape the pressures of an
increasing population and a finite supply of water. Already, Sydney is using 106 percent of the
annual sustainable yield of its water supplies. This paper looks at the use of water in Sydney, and
the response by water authorities to managing demand. A brief review of water use throughout
the State is also presented.

The Sydney Catchment Authority and Sydney Water are the two authorities responsible for the
supply of potable water to the Sydney, Illawarra and Blue Mountain areas. The Catchment
Authority provides bulk water to Sydney Water, which then retails it to approximately 1.3 million
accounts and a population of 4.15 million.

In the Sydney Water service area, the residential sector is the biggest user of water, comprising 61
per cent of total demand. Most of this demand comes from single dwellings, which use an
average 825 litres per day, compared to units and apartments which use around 495 litres per
day. In regard to residential water use, outdoor water usage is the area of highest consumption
(27.3 per cent), followed closely by showers (24.3 per cent).

The safe yield of Sydney’s drinking water storages is 600,000 ML/year. The yield is defined as
the amount of water that can be withdrawn from a reservoir on an on-going basis with an
acceptably small risk of reducing the reservoir storage to zero. Demand has fluctuated around
600,000 ML/year since 1980, despite population increasing by around 700,000 during this time.
Sydney’s water consumption has been above the safe yield for the last three years and for six of
the last ten years.

Daily per capita water use has fallen from 506 litres in 1991 to 416 litres in 2002/03. Demand
management targets for water conservation purposes were first included in Sydney Water’s 1995
Operating Licence. The current licence has two demand management targets (based on 1990/91
levels). The first is a 2005 target of a 28% reduction in per capita water consumption – 364 litres
per capita per day. The second is a 2011 target of a 35% drop in per capita water consumption
to 329 litres per day. Sydney Water does not expect the 2005 target to be met.

A review of demand management programs is presented. The most successful demand
management programs (in terms of water saved) have been: water recycling at sewerage treatment
plants; leakage reduction programs; and the residential retrofit program.

Traditionally, water in urban areas has been supplied through a centralised water reticulation and
waste water system. One of the more topical issues in regard to water supply and sewerage
infrastructure is that of sustainability and moves towards localised and individual systems. These
sustainable approaches and solutions range from simple items, such as rainwater tanks and the
better integration of current reticulation systems, to fully independent on-site water systems.
Sustainable approaches aim to integrate all elements of urban water services, reducing water use
and                  reusing                 water               wherever                 possible.
The Future of Water Supply                                    1

1.0       INTRODUCTION

It is predicted that by 2025, nearly three billion people worldwide will face an acute scarcity of
clean, fresh water, and billions more will experience shortages and soaring costs for water.1
Australia, being one of the driest countries on earth, will not be able to escape the pressures of an
increasing population and a finite supply of water. Already, Sydney is using 106 percent of the
annual sustainable yield of its water supplies. This paper looks at the use of water in Sydney, and
the response by water authorities to managing demand. A brief review of water use across the
State is presented and the future of urban water supplies is explored.

2.0       HISTORY OF SYDNEY'S WATER SUPPLY SYSTEM

A brief chronological history of Sydney’s water supply system is as follows:

      •   Sydney’s original water supply came from the Tank Stream, which emptied into Circular
          Quay. However, it soon became an open sewer and was abandoned in 1826;
      •   Convict labour developed Busby’s Bore, a four kilometre tunnel from the Lachlan
          Swamps (now Centennial Park) and ending in the southeastern corner of Hyde Park;
      •   By 1852 drought and an increasing population created the need for a more permanent
          water supply. A third water source, the Botany Swamps Scheme, began operating in
          1859, but within 20 years the supply of fresh water was depleted;
      •   Completed in 1888, the Upper Nepean Scheme diverted water from the Cataract,
          Cordeaux, Avon and Nepean Rivers to Prospect Reservoir via 64 kilometres of tunnels,
          canals and aqueducts known collectively as the Upper Canal.
      •   The drought of 1901-1902 brought Sydney close to a complete water famine. After two
          Royal Commissions into Sydney’s water supply, it was agreed to build a dam on the
          Cataract River. The successive building of Cataract, Cordeaux, Avon and Nepean dams
          between 1907 and 1935 greatly improved the Upper Nepean Scheme’s capacity;
      •   In the Blue Mountains, construction of the six dams that serve the area commenced in
          1905 and concluded with the building of Greaves Creek Dam in 1942;
      •   A scheme to supply water from the Woronora River to Sutherland and Cronulla in
          Sydney’s south began with the construction of Woronora Dam in 1927 and was
          completed in 1941;
      •   An increasing demand for water, combined with a record drought from 1934 to 1942,
          forced the development of Warragamba Dam. Construction began in 1948 and was
          completed in 1960;
      •   In the late 1960s, the then Water Board was concerned that Warragamba Dam might
          prove inadequate to meet Sydney’s water needs by the mid 1970s. Construction of the
          Shoalhaven Scheme, including the Tallowa Dam on the Shoalhaven River began in 1971
          and was completed in 1977. 2

1
          Cribb, J. “Water Banks to beat scarcity.” In The Australian Local Government Environment
          Yearbook , 2004, at 76.

2
          Adapted from: Sydney Catchment Authority, History of Sydney’s Water Supply Scheme, See
          website URL: http://www.sca.nsw.gov.au/dams/history.html, Accessed March 2004.
2 NSW Parliamentary Library Research Service
2.1 The Sydney Water Supply Institutional Framework
The Sydney Catchment Authority and Sydney Water are the two authorities responsible for the
supply of potable water to the Sydney, Illawarra and Blue Mountain areas. The State
Government established the Sydney Catchment Authority in response to the Sydney Water
Inquiry, which investigated a water contamination incident in 1998. The Inquiry recommended
that the proposed ‘Catchment Commission’ be independent of Sydney Water and control the
relevant infrastructure including dams, reservoirs and associated land.3 With the passage of the
Sydney Water Catchment Management Act 1998, the Authority became operational on 2 July
1999.
The role of the Authority, as outlined in the Act, is:
(a) to manage and protect the catchment areas and catchment infrastructure works; (b) to
be a supplier of bulk water, and
(c) to regulate certain activities within or affecting the outer catchment area as well as the
inner catchment area.
The Authority’s main functions are to:
• manage and protect the catchment areas, and the dams, storages and piplelines;
• supply bulk water to Sydney Water, other water supply authorities and direct customers;
• protect and enhance water quality;
• carry out research on catchments generally and on the health of its own catchments in
particular; and
• help educate the community about water management and catchment protection.
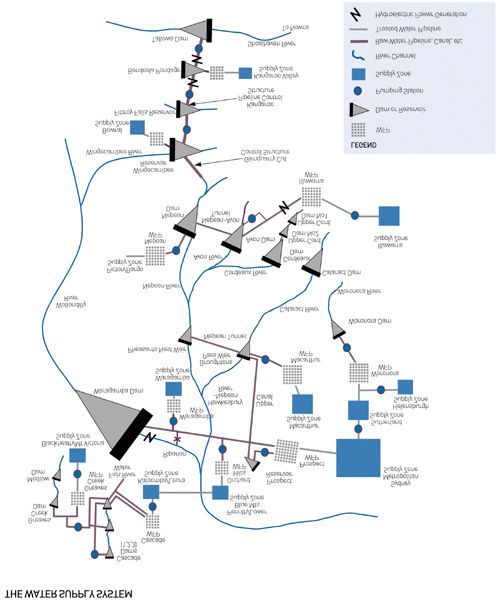
The water supply system comprises six main components, and how they work and are connected
to supply water is shown in Figure one. Bulk water is supplied from the Authority’s system of 18
major dams and two diversion weirs, through a network of pipes and canals to 11 water filtration
plants. The six components are:
• The Prospect Reservoir System;
• The Upper Nepean Dams and Upper Canal System;
• The Woronora Dam System;
• The Warragamba Dam and Warragamba Pipeline System;
• The Shoalhaven System; and
• The Blue Mountains System.
3
See: Sydney Water Inquiry, Third Report, Assessment of the contamination events and
future directions for the management of the catchment. October 1998, Commissioner Peter
McClellan QC.The Future of Water Supply 3 Figure One: The Sydney Catchment Authority Water Supply System Source: Sydney Catchment Authority, Water Supply Diagram. See their website: http://www.sca.nsw.gov.au/dams/schematic.html, Accessed March 2004.
4                           NSW Parliamentary Library Research Service

Generally the Sydney Catchment Authority supply system can be operated so that the water
filtration plants can be supplied with water from several different sources. However, exceptions
include:
     • Raw water from Nepean Reservoir is the only supply source for the Nepean Water
          Filtration Plant, which supplies the towns of Picton, Oakdale, Thirlmere, Buxton and
          Green Hills;
     • Parts of the Blue Mountains system cannot be supplied from the main part of the
          Authority’s system.

Transfers from the Shoalhaven system into Wingecarribee Reservoir are important during periods
of drought to augment supplies to Sydney, the Illawarra and Wingecarribee supply systems.
Current operating rules dictate that pumping from the Shoalhaven system into Wingecarribee
Reservoir begins when the total Sydney Catchment Authority system storage level falls to 60%.4

In 1995 the Sydney Water Board was corporatised to form Sydney Water, a state-owned
corporation under the State Owned Corporations Act 1989. Sydney Water purchases bulk
water from the Sydney Catchment Authority, and retails it to people living in the Sydney, Blue
Mountains and Illawarra areas. Currently Sydney Water provides an average of 1,700 million
litres of water per day to approximately 1.6 million accounts and a population of around 4.15
million.

3.0     THE USE OF WATER IN SYDNEY

The water demand breakdown for 2002/03 in Figure 2 below shows that the residential sector is
the biggest user of water (61% of total demand). Most of this demand comes from single
dwellings, which use an average of 825 litres per day, compared to units and apartments which
use around 495 litres per day. The top 20% of residential users account for 40% of total
residential demand, with a significant proportion of this higher use in discretionary garden
watering.5

Water consumed by the residential sector can be divided into two main categories – discretionary
and non-discretionary. Non-discretionary water use refers to the use of water for basic needs.
Most of the water used for health and hygiene, including cooking, bathing, cleaning and drinking,
as well as toilet water, is in this category. Non-discretionary water use is generally assumed to be
fairly constant and is not significantly influenced by external factors such as the weather.
Discretionary water is less important in terms of meeting basic needs, and includes water use such
as water gardens and lawns, swimming pools and washing cars. Discretionary use may fluctuate
depending upon a range of factors including weather, income and restrictions on use. It is also
thought that price increases may be more likely to reduce some discretionary water consumption.6

4
        Independent Pricing and Regulatory Tribunal, Review of the Performance Criteria in Sydney
        Catchment Authority’s Operating Licence, Final Report, Prepared for IPART by SKM, July
        2003 at 8.

5
        Sydney Water, ESD Indicators and Environment Plan Report, Sydney Water Annual Report
        2003, at 10.

6
        Independent Pricing and Regulatory Tribunal of New South Wales, Investigation into Price
        Structures to Reduce the Demand for Water in the Sydney Basin. Issues Paper, 2003, at 6.
The Future of Water Supply 5
Figure 2: Total Demand Breakdown of Sydney Water Supplies, 2002/03.
Industrial 10%
Commercial 8%
Govt & other 7% Residential single
dwelling 46%
Real losses 11%
Appararent losses
3%
Residential multi
unit 15%
Source: Sydney Water, ESD Indicators and Environment Plan Report, Sydney Water Annual Report
2003, at 10. Apparent losses include unauthorized consumption and metering inaccuracies.
An analysis of residential water usage by Sydney Water indicates that outdoor water use is the
area of highest consumption, closely followed by showers. A breakdown of residential water use
is shown in figure 3 below.
Figure 3: Breakdown of Residential Water Use – Sydney Water Corporation
Indoor use
16.3% Toilet 15%
Washing
machine 17% Shower 24.3%
Outdoor use
27.3%
Source: Independent Pricing and Regulatory Tribunal of New South Wales, Investigation into Price
Structures to Reduce the Demand for Water in the Sydney Basin. Issues Paper, 2003, at 6.
Average residential consumption is 245 kL per annum, with those in houses consuming an average
of 285kL per annum and residents in units / flats consuming an average of 179 kL per annum.
Over 60% of residential customers use less than 250 kL per annum. 7 Daily per capita water use
7
Independent Pricing and Regulatory Tribunal of New South Wales, Investigation into Price
Structures to Reduce the Demand for Water in the Sydney Basin. Issues Paper, 2003, at 6.6 NSW Parliamentary Library Research Service
has fallen from 506 litres in 1991 to 416 litres in 2002/03. Sydney Water notes that this reduction
is due to a combination of factors including: reduced industrial demand; the introduction of user-
pays pricing; changes in the housing mix; the introduction of dual flush toilets; and other demand
management initiatives.
Demand management targets for water conservation purposes were first included in Sydney
Water’s 1995 Operating Licence. The current licence has two demand management targets
(based on 1990/91 levels). The first is a 2005 target of a 28% reduction in per capita water
consumption – 364 litres per capita per day. The second is a 2011 target of a 35% drop in per
capita water consumption to 329 litres per day. Sydney Water does not expect the 2005 target to
be met, and notes that the single largest factor affecting their ability to meed demand management
targets over the last 12 months has been the effect of drought and above average temperatures. It
notes that climate corrected water demand has shown a decreasing trend since 2002, and that
climate corrected average daily demand was ten litres less than that actually observed. Daily
water demand per person, both observed and climate corrected, since 1991 is shown in figure 4
below.
Figure 4: Daily water demand per person (12-month rolling average, litres per day),
June 1991 to June 2003
Source: Sydney Water, ESD Indicators and Environment Plan Report 2003, at 11.
The safe yield of Sydney’s drinking water storages is 600,000 ML/year. The yield is defined as
the amount of water that can be withdrawn from a reservoir on an on-going basis with an
acceptably small risk of reducing the reservoir storage to zero. Figure five shows that demand has
fluctuated around 600,000 ML/year since 1980, despite population increasing around 700,000
during this time. Sydney’s water consumption has been above the safe yield for the last three
years and for six of the last ten years. Sydney Water notes that whilst it is possible to exceed the
yield in the short to medium term, it will ultimately result in an increase in water shortages and the
need for earlier and more stringent imposition of water restrictions.8
8
Sydney Water, ESD Indicators and Environment Plan Report, Sydney Water Annual Report
2003, at 12.The Future of Water Supply 7
Figure 5: Total system releases figures since 1950 compared to population growth
Source: Sydney Water, ESD Indicators and Environment Plan Report 2003, at 11.
As noted, Sydney’s population of 4.2 million people used 635,000 ML of water in 2002/03.
Sydney’s population is expected to increase to 4.5 million people by 2011 and almost 4.9 million
by 2021, with more than 300,000 new dwellings likely to be needed to cope with this population
growth. Sydney Water notes that with this increase in population, combined with a potential
downward revision of yield to allow for environmental flows in the Hawkesbury Nepean River,
will create a shortfall between supply capacity of around 540,000 ML/year and anticipated
demand of 680,000 ML/year, of more than 140,000 ML/year.9
Also of considerable importance is the potential impact of climate change due to the enhanced
greenhouse effect. For the Australian region it is anticipated that by 2030 there will be:
• A warming of 0.4 to 2.00C;
• A 10 to 50 per cent increase in days over 350C;
• Increased potential evaporation;
• Up to 15 per cent less rainfall year round in the south east of Australia;
• More years with serious rainfall deficiencies;
• Up to 15 per cent more summer rainfall on the east coast.
When projected annual changes in rainfall are combined with increases in potential evaporation, a
pattern of decreasing water availability emerges for Australia. In years of serious rainfall
deficiency, available water will evaporate more rapidly, leading to more severe droughts. Another
implication of an increase in temperature and decrease in rainfall is an increase in urban water
use.10
9
Sydney Water, Water Conservation and Recycling Implementation Report 2002 – 2003, at 2.
10
Pearman,G. et al, “Climate Change and its Projected Effects on Water Resources.” In Water
– The Australian Dilemma, The Australian Academy of Technological Sciences and
Engineering, Academy Symposium, November 2003. Pearman is the Chief Scientist, CSIRO
Atmospheric Research.8 NSW Parliamentary Library Research Service
With these water resource constraints looming, in March 2003 the NSW Government released its
urban water policy Changing the Way We Think About Water. The policy reaffirmed the
Government’s commitment not to build any new dams, and requires Sydney Water to:
• Continue to invest in demand management, and provide programs to low income
households free of charge;
• Work with local councils and industry groups to make water smart buildings compulsory
for new developments;
• Provide opportunities to recycle treated wastewater where it is environmentally and
economically viable;
• Examine the feasibility of improving demand management by implementing a water
efficiency trading scheme.
In an attempt to harness an ‘all of government’, as well as community and industry involvement in
water conservation, the Government has also established three committees to consider aspects of
demand management. These are:
• Hawkesbury-Nepean River Management Forum;
• Water Chief Executive Officers Taskforce;
• Water Expert Panel.
The Hawkesbury-Nepean River Management Forum is reviewing the environmental flow
requirements needed to maintain river health. The Forum released a progress report in May 2003
which noted that the environmental flow options selected for further investigation could reduce the
yield for consumptive purposes within a range of some 546 GL/year to 456 GL/year. The forum
also noted that security of supply problems in relation to water supplies for the cities of
Wollongong and Nowra and possibly the suburbs in the Sutherland Shire.11
The Water Chief Executive Officers Taskforce (Water CEOs), chaired by the Environment
Protection Authority (now Department of Environment and Conservation), has the objective to
develop and recommend a Sustainable Water Strategy for Sydney. Draft recommendations of the
Strategy include:
• Mandate minimum water efficiency performance standards for appliances;
• Mandate appliance rating and labelling;
• Mandate minimum levels of water efficiency in new residential developments;
• Implement permanent low level outdoor water use conditions;
• Obtain a 15% reduction in Government agencies’ water use;
• Review water pricing and tariff structures to send stronger conservation price signals to
consumers and business;
• Implement mandatory planning controls requiring water fit for purpose approaches in new
developments (eg rainwater tanks or recycled water where available);
• Increase business water reuse and recycling;
• Develop incentives for farmers to improve agricultural irrigation efficiency;
• Supply recycled water to irrigators along the Hawkesbury Nepean River to replace
11
Hawkesbury-Nepean River Management Forum, Progress Report on Stage 3 of the Work
Plan, May 2003, at 21.The Future of Water Supply 9
current river extraction;
• Introduction of a market based adjustment mechanism. 12
Already some of these recommendations have been implemented or public debate about their
merits promoted. For instance, mandatory minimum levels of water efficiency in new residential
developments was announced in September 200313. The Premier has mentioned several times
that Sydney residents may have to ‘get used’ to having permanent low level outdoor water use
conditions. In addition, the Government referred an investigation into price structures to reduce
the demand for water in the Sydney Basin to the Independent Pricing and Regulatory Tribunal
(IPART), due to report by 31 July 2004.
The Water Expert Panel is expected to build on the Water CEOs Taskforce strategy and develop
a water balance strategy, due to be presented to the Premier in December 2003.
3.1 Demand Management
Sydney Water has several demand management programs currently in place, covering residential;
business; water recycling and water leakage. These are discussed below.
Residential
• Residential indoor retrofit programs: - the ‘Every Drop Counts’ retrofit program began in
January 2000 and offers householders the opportunity to have a plumber visit their house
to install water efficient devices. Some 204,595 households have received the service,
representing one in seven households. An evaluation of the program shows an average
reduction in water use of 20,900 litres per household per annum. The program has:
reduced water use by 4,276 ML/year; reduced household utility bills by $30 - $100 per
year; and water savings have been shown to be sustained four years after retrofit;
• Outdoor water conservation program – ‘Go Slow on the H2O’, this program has been
delivered in spring each year since 2000, and is an educational program to promote water
efficient gardening and other outdoor water use practices. Discount vouchers for water
efficient products and promotional material was distributed to one million households with
gardens throughout the Sydney Water operating area;
• Rainwater tank rebate program – research has shown that rain captured on roofs in
rainwater tanks can reduce the demand on reticulated water supplies by between 20 and
50 percent, depending on the end uses of the stored water, tank size, roof catchment area
and rainfall patterns. The rebate program aims to: assess whether a rebate incentive can
stimulate an increase in tank installations; and to encourage tank purchasers to install
larger size tanks and to connect them to either their toilets or washing machines. In
October 2002 it was estimated that 45,000 properties in Sydney had rainwater tanks.
The tank rebate program began in October 2002 and was originally due to expire on
September 20 2003, but has been extended to June 2005. As at December 2003
Sydney Water had approved 2,407 rainwater tank rebates.14 However, the uptake rate
12
Sydney Water, Water Conservation and Recycling Implementation Report 2002 – 2003, at 4.
13
“Premier Carr announces targets to slash water and energy use in new homes.” Media
Release, Hon Bob Carr Premier of NSW, 18 September 2003. From July 2004, all new
homes are required to achieve a 40 per cent reduction in water consumption.
14
“Rainwater Tank Demand Surges as Sydney Embraces Water Conservation.” Media
Release, Sydney Water, 9 December 2003.10 NSW Parliamentary Library Research Service
of customers connecting their rainwater tank to their toilets and washing machines is only
about 4 per cent.
• Water efficient washing machine rebate program – this ran from June 5 2003 to 31 July
2003, and provided a $100 rebate to newly purchased 4A or 5A rated water-efficient
washing machines. The aim of the program was to stimulate a permanent increase in
consumer take-up of water efficient washing machines. From November 2002 to July
2003 the number of 4A and 5A accredited machines on the market increased from 11
machines to 88. By 8 August 2003 Sydney Water had received 5,862 applications for
the $100 rebate;
• Public housing retrofit program – prior to the introduction of user pays tariff pricing in the
early 1990s, public housing water consumption was consistent with average residential
consumption. Since this time, public housing consumption has remained constant, while
average private house consumption has reduced in response to the price signals.
Currently the Department of Housing pay the full cost of public housing tenant’s water
accounts. Sydney Water and the Department of Housing are developing an agreement to
retrofit up to 25,000 Department of Housing properties over the next six years. The
agreement, still being negotiated, would see Sydney Water provide up to 12,500 retrofits
to Department owned residential properties. The Department will then use the financial
savings they make as a result of reduced water consumption to finance future retrofits by
Sydney Water contractors;
• Residential landscape assessment program – this program, still being developed, aims to
provide a garden tune-up and advisory service that targets Sydney’s highest outdoor
water consumers.
Business
The ‘Every Drop Counts’ Business program targets customers in the manufacturing, commercial,
hospitality, education and government sectors. The program targets potential participants from the
highest water using business sectors and individual high water users within these sectors. The
program consists of the following elements: co-operative partnerships; identification of
management barriers; identification of technical projects; employee awareness; and corporate
citizenship. 144 customers have formally joined the ‘Every Drop Counts’ Business program,
which accounts for nearly 25% of the total business sector water consumption. 15
Water Recycling
In 1999 Sydney Water developed a Water Recycling Strategy, and based on this work, gazetted
a Water Recycling Projection for 2000 – 2005 in May 2000. The projection indicated that the
volume of water recycled from the sewerage system would increase by between 4 and 67
ML/day by 30 June 2005. A review of the strategy in 2003 noted that unless required as part of
a sewerage treatment plant upgrade, water recycling schemes have been considered a viable
public investment if full cost recovery could be achieved through a commercial agreement with
recycled water customers. However, the fact that recycled water must often be priced to
compete with potable water has limited the scale of the recycled water market that Sydney Water
could viably service, and restricted the potential contribution of recycled water as a sustainable
water source. A Recycled Water Program is due to be developed during 2003/04, which will
indicate what recycled products will be provided to which markets and the schedule for delivering
15
Sydney Water, Water Conservation and Recycling Implementation Report 2002 – 2003, at
16.The Future of Water Supply 11
to those markets over the next ten years.16
Since 1995, recycled water use has increased from 17 ML/day to 36 ML/day. Increased levels
of water recycling during the previous 12 months has been due to: commissioning of stage 2 of the
Rouse Hill Development Area, which added a further 7,000 houses to the recycled water supply
system; the Gerringong-Gerrroa irrigation recycled water scheme commissioned in August 2002;
increased recycled water use at Sydney Water’s sewerage treatment plants; and greater irrigation
demands for recycled water due to drought conditions. The volume of water recycled will
increase by 20 ML/day in 2004, once the BHP industrial recycled water scheme is commissioned.
The increase in water recycling has reduced potable water use by an estimated 2,451 ML/year.17
Despite these achievements, Sydney still lags behind other capital cities in recycling sewage water.
For instance, Adelaide and Brisbane lead the way in recycling sewage, (11 and 6 per cent
respectively), while Sydney recycles about 2.3 per cent. Of the large mainland cities, only
Melbourne (2.0 per cent) has a lower recycling rate than Sydney. 18
Leakage Reduction
Sydney Water notes that water leakage is a worldwide problem, with reticulated water leakage
rates varying from 4% of demand in very well maintained systems, to 60% of demand, which
occurs primarily in third world countries. Sydney Water currently has a leakage rate of 10.7% of
demand, or 188 ML/day. 19 Reviews of various Australian water supply systems show a wide
variation in leakage rates, varying from 7% to 35% of average annual demand, with an average of
18%.20 As a comparison, Melbourne has a leakage rate of 8%21, and Adelaide 7%.22
The Sydney Water leakage reduction program includes: active leak detection; pressure
management; speed of repairs; and asset management. Sydney Water estimates that a sustainable
reduction in leakage of 60 ML/day can be achieved through leak detection and repair. In late
16
Sydney Water, Water Conservation and Recycling Implementation Report 2002 – 2003, at
23.
17
Sydney Water, Water Conservation and Recycling Implementation Report 2002 – 2003, at
24.
18
“NSW tops the national ladder for wasting water.” in The Sydney Morning Herald, 30 March
2004. The article quotes figures from Dr John Radcliffe, Australian Academy of Technological
Sciences and Engineering.
19
Sydney Water, Water Conservation and Recycling Implementation Report 2002 – 2003, at
26.
20
Queensland Department of Natural Resources, Improving Water Use Efficiency in
Queensland’s Urban Communities, 2000, at 93. See:
http://www.nrm.qld.gov.au/compliance/wic/pdf/reports/urban_wateruse/07_leakage_red.pdf,
accessed February 2004.
21
Victorian Government, Planning for the future of our water resources. Discussion Starter,
June 2001, at 14. See http://www.watersmart.vic.gov.au/downloads/Discussion_Starter.pdf,
accessed February 2004.
22
SA Water, SA Water Loss Fact Sheet, see SA Water website,
http://www.sawater.com.au/our_water_system/index.html, Accessed February 2004.12 NSW Parliamentary Library Research Service
2003, with the introduction of water restrictions, the Corporation received adverse publicity about
the leakage rate of its reticulation system. On 29 January 2004 the Corporation announced a 35
percent increase in funding to its program to upgrade and replace leaky water mains across its
operating area. Sydney Water stated:
The $10 million additional funding for the Mains Replacement Program brings to $38
million the amount being spent this financial year to replace mains in Sydney Water’s
21,000 kilometre network of pipes. The increase would bring the total investment in leak
detection and water main repairs and replacement to $74 million this financial year. This
decision to reallocate funds to the mains renewal program by Sydney Water’s Board will
allow for an additional 19 kilometres of new mains to be laid.
Sydney Water’s Active Leak Reduction program, has seen Sydney Water inspect more
than 40 percent of the water delivery network between 1999 and June 2003.
This year, nearly $3 million has been allocated which will allow for 7,000 kilometres of
mains to be inspected. At this rate, the entire water network will be checked every three
years.23
The most successful demand management programs (in terms of water saved) have been: water
recycling at sewerage treatment plants; leakage reduction programs; and the residential retrofit
program. Estimates of the cost of the programs and water saved are shown in table 1 below.
Table 1: Sydney Water’s expenditure on demand management and savings achieved.
Program 98/99 99/00 00/01 01/02 02/03 Total Estimated
($m) ($m) ($m) ($m) ($m) outlay savings
($m) (GL)
Residential 0.05 4.23 10.95 6.52 7.80 29.55 7.25
Business 1.15 1.0 0.46 1.80 4.41 1.88
Leakage 0.30 1.00 2.37 1.90 5.57 10.22
reduction
Recycled 0.23 0.23 14.57
water
Other 0.45 1.41 1.99 0.80 4.65
Total 0.05 6.13 14.36 11.34 12.53 44.41 33.93
Source: Independent Pricing and Regulatory Tribunal of New South Wales, Investigation into Price
Structures to Reduce the Demand for Water in the Sydney Basin. Issues Paper, 2003, at 9.
4.0 RESPONDING TO DROUGHT
Sydney Water notes that its drought management plans are based on a five phase response
strategy, where mandatory water restrictions come into force when total storage levels fall to 55%
of capacity. Table 2 below shows these drought phases and the corresponding water restrictions.
23
Sydney Water, “35 percent funding boost to reduce leaking water mains.” Media Release, 29
January 2004.The Future of Water Supply 13
Table 2: Drought and Sydney Water Water Restrictions
Drought Restrictions Total Storage Demand Targeted
Phase Level (%) Reduction Level Demand
Reductions
1 None > 65
2 Voluntary Restrictions 65
Level 1 Mandatory 55 Level I 7%
Restrictions
Level 2 Mandatory 45 Level II 12%
Restrictions
3 40 Level III 20%
Level 3 Mandatory 35 Level IV 30%
Restrictions
4 Level 4 Mandatory 25 Level V 50%
Restrictions
5 Recovery
Source: Sydney Water, Water Conservation and Recycling Implementation Report 2002 – 2003, at 77.
An outline of the restrictions is as follows:
• Voluntary restrictions: - apply to residential customers and involve: no use of sprinklers
or watering systems between 8:00am and 8:00pm; no hosing of hard surfaces at any time.
• Level 1 Mandatory Restrictions: - apply to all Sydney Water customers (residential,
business and government) and involve: no use of sprinklers at any time (excludes drip
irrigation); no hosing of hard surfaces and vehicles at any time; exemptions may apply to
some business, government and recycled water use.
• Level 2 Mandatory Restrictions: apply to all Sydney Water customers and involve: no
use of sprinklers at any time; no hosing of hard surfaces and vehicles at any time; hand
held hoses for garden watering only 2 days each week. Exemptions available for
businesses, government and recycled water use will be reviewed based on savings
achieved in Level 1.
On 11 September 2003 Sydney Water announced that Level 1 mandatory water restrictions
would be introduced on 1 October 2003. It noted that the last time mandatory water restrictions
were implemented was in November 1994, and remained in place until October 1996. Fines of
$220 apply to those caught not heeding the restrictions.
Currently level 3 and 4 restrictions have not been defined. Sydney Water notes that it is difficult
to define these restrictions before a review of the demand reductions achieved from level 2
restrictions. However, as an indication of what these restrictions may involve, Goulbourn City
Council (now Greater Argyle Council) implemented level four water restrictions on 1 March
2003. Their restrictions were:14 NSW Parliamentary Library Research Service
Residential
• All hoses to be disconnected;
• Lawns – town water banned;
• Gardens – town water banned;
• Hosing driveways, pavements, walls and roofs – town water banned;
• Car washing – town water banned.
Business:
• Pools & spas - (Ancillary to business, motel)- town water topping up & filling banned;
• Public gardens (excluding Belmore Park)- town water banned;
• Landscaping to building & properties - town water banned;
• Fountains - town water banned;
• Nurseries, market & commercial gardens - Sprinklers/hand watering limited to one hour
per day;
• Active playing surfaces - sprinklers/hand watering limited to one hour per day;
• Brick cleaning, carpet cleaning, pest control, painting preparation - high pressure cleaners
permitted - must demonstrate 50% recycling capability;
• Paved public areas - washing for health & safety reasons - bucket only;
• Vehicles - washing for health & safety reasons - bucket only;
• Car washing and detailing - Must submit a water management plan;
• Car yards - one wash per week;
• Earthworks - town water banned - recycled water available;
• Building / Construction / Maintenance - Hoses banned - bucket only24
Sydney Water and the Sydney Catchment Authority have formed a joint Drought Management
Committee, which advises the Minister for Sydney Water on mandatory restrictions.
Investigations by the Committee suggest that even a 20% demand reduction will be difficult to
achieve. It is also noted that the emphasis on restrictions is primarily on outdoor discretionary
water use. The introduction of permanent outdoor water usage conditions, alternative supplies for
garden watering and other outdoor demand management initiatives will harden outdoor water
demand. This means that it will be more difficult to reduce demand in times of drought and may
require more stringent restrictions to be invoked to achieve required demand reductions or the
introduction of additional contingency supplies during drought.25
A Drought Expert Panel has also been formed with representatives from Sydney Water, the
Sydney Catchment Authority, and the Department of Infrastructure, Planning and Natural
Resources. The Panel was established to identify and assess alternative water supply options that
can be progressively implemented as the current drought enters the ‘Emergency Phase’. The
Panel has identified over 30 alternative supply options and ranked these according to cost,
timeliness, feasibility, implementation risk and long term fit. The three main options that are likely
to supply the quantities of water needed to maintain supply are:
24
Goulburn City Council, “Level Four Water Restrictions.” Media Release, 3 March 2003. See
http://www.goulburn.nsw.gov.au/news/1046644586_12065.html, accessed February 2004.
25
Sydney Water, Water Conservation and Recycling Implementation Report 2002 – 2003, at
79.The Future of Water Supply 15
• Use of available water in the ‘dead storages’ (the zone which lies below the available
outlets of the dams). There is approximately 241,000 ML in the dead storages in
Warragamba, Nepean and Avon dams. While the water quality is expected to be poor, it
represents an additional 10% storage;
• Accessing groundwater;
• Desalinisation – this presents the only long term large volume alternative source of water.
However, there are significant environmental and financial constraints relating to the
operating costs of the plant, the energy used and the brine discharge.26
4.1 Augmenting Sydney’s Water Supplies
With the onset of drought and water restrictions, public debate on permanently augmenting
Sydney’s water supply invariably arises. The most controversial way of doing this is to build a
new dam on the upper Shoalhaven River, at a location called Welcome Reef. An environmental
impact statement was released to this effect in March 1980, and for over 30 years successive
State Governments have been buying land in the area with the intention of building the dam. Water
from the dam would be sent downstream to Tallowa Dam, which was built in the 1970s. From
there, it would be pumped up the escarpment into metropolitan dams as does water from Tallowa
Dam presently. The full capacity of the proposed dam is 2680 gigalitres – 600 billion litres more
than stored in Warragamba Dam.
However, recent modelling for the Independent Expert Panel, chaired by Mr Bob Wilson, has
indicated that the Welcome Reef Dam is not the panacea for Sydney’s water supply that many are
claiming. For instance, the surface area of the proposed dam would be more than 15,000
hectares, much greater than Lake Burragorang, resulting in significant evaporation. Assuming
there is no evaporation at Welcome Reef and no water is allowed to travel down the Shoalhaven
River while it is filling, it would take about a decade for the dam to fill. Bob Wilson was reported
as saying: “It’s not a wise place for a dam because it hasn’t got a high rainfall. It would ruin some
lovely landscapes and it would ruin the gorge country from Welcome Reef down to the existing
Tallowa Dam. It will devastate the Shoalhaven River valley. The tourist and fishing industries rely
on that river, as does the city of Nowra.”27
Already, water quality in the lower Shoalhaven River, downstream from Tallowa Dam, is poor,
with less than 25 per cent of samples meeting the criteria for aquatic ecosystems. A report by the
NSW Department of Land and Water Conservation noted:
Construction of the proposed Welcome Reef Dam on the upper Shoalhaven River would
severely affect the frequency of spills from Tallowa, the quantity of downstream flows
and the ecological health of the Lower Shoalhaven River.28
26
Sydney Water, Water Conservation and Recycling Implementation Report 2002 – 2003, at
81.
27
“Filling dam would dry up river for a decade, says expert.” in The Sydney Morning Herald, 15
November 2003.
28
NSW Department of Land and Water Conservation, Stressed Rivers Assessment Report,
Region: South Coast, Catchment Shoalhaven. August 1999 at 39.16 NSW Parliamentary Library Research Service
As noted, it is current Government policy not to build the Welcome Reef dam, and in fact with the
passage of the National Parks And Wildlife Amendment (Transfer Of Special Areas) Act
2001, new natures reserves have been declared on land originally bought for the dam.
5.0 WATER SUPPLY IN RURAL AND REGIONAL AREAS
In NSW in 2001/02 there were 129 water utilities, comprising:
• 3 metropolitan utilities (Hawkesbury Council, Hunter and Sydney Water Corporations);
and
• 126 non-metropolitan Local Water Utilities (LWUs).
Of the 126 non-metropolitan Local Water Utilities, 107 were responsible for both water supply
and sewerage, eight for water supply only and 11 for sewerage only. The total annual water
consumption for the LWUs was 337,000 ML, with total water and sewerage turnover of $736M
and current replacement value of assets was $9,800M. The utilities served 1.73 million people.29
In January 2004 the Government announced that water levels in rural and regional dams were at
38 per cent of capacity. Two communities, Carters Opal Fields near Walgett and Bribbaree near
Young are having water carted to meet their residents’ basic needs, and 42 towns across the
State have water restrictions in place. Storage levels by region are presented below:
• Murray Valley – dam levels are at 52.9 per cent of capacity;
• Lower Darling Valley – dam levels at Menindee Lakes are at 2 per cent;
• Murrumbidgee Valley – dam levels are at 49.2 per cent;
• Lachlan Valley – dams are at 15.8 per cent;
• Macquarie Valley – dam levels are at 30.2 per cent;
• Namoi Valley – dam levels are at 14 per cent;
• Gwydir Valley – dam levels are at 12 per cent;
• Border Rivers – dam levels are at 26.8 per cent
• Bega River – Brogo dam is near full;
• Casino area – Toonumbar Dam is at 31 per cent (compared to about 18 per cent 12
months ago).30
In July 2003, in announcing the release of a water supply and sewerage performance monitoring
report by local water utilities, a media release by Minister Sartor noted that in the 11 years to
2001/02, country households have slashed their average water consumption by 90,000 litres per
year, from 330,000 litres to 240,000 litres.31 However, closer examination reveals that annual
average residential water consumption fell to 220,000 litres in 1996/97, and has since climbed up
to 240,000 litres in 2001/02, a consumption level not experienced since 1994/95. Figure six
below shows annual average consumption in the local water utilities since 1991.
29
New South Wales Government, Ministry of Energy and Utilities, 2001/02 NSW Water Supply
and Sewerage, Performance Monitoring Report, 2003.
30
Hon Bob Carr MP, Premier of NSW, “Rural Water Supplies Plunge to 38 per cent.” News
Release, 9 January 2004.
31
Hon Frank Sartor, Minister for Energy and Utilities, “Country NSW heeds call to save water:
Minister.” Media Release, 31 July 2003.The Future of Water Supply 17
Figure 6: Annual Average Water Consumption (k/L per property) for 126 non-
metropolitan Local Water Utilities
350
300
250
kL/property
200
150
100
50
0
91
92
93
/95
/96
/97
/98
/99
/01
/02
00
19
19
19
/20
94
95
96
97
98
00
01
19
19
19
19
19
20
20
99
19
Source: New South Wales Government, Ministry of Energy and Utilities, 2001/02 NSW Water Supply
and Sewerage, Performance Monitoring Report, 2003, at xxxviii.
Reuse of recycled water was carried out by 41 per cent of local water utilities, mostly for
agriculture. In total, for all treatment works, about 13 per cent of effluent was recycled, whilst 17
utilities recycled over 50 per cent of their effluent.32
6.0 WATER PRICING
In December 2003 the Independent Pricing and Regulatory Tribunal (IPART) released an Issues
Paper into water pricing to reduce the demand for water in the Sydney area. The Tribunal noted
that it was only in 1992 that water pricing comprised a mixture of components including: property
based charges; pre-paid water allowances; fixed charges and usage charges. In 1993 the
Government Pricing Tribunal (the predecessor to IPART) conducted an inquiry into the pricing of
water. Key recommendations that have been implemented since that inquiry include:
•Two-part tariffs, incorporating a fixed component and a component that varies with
usage;
• Cost reflective pricing – linking prices paid by customers to the cost of service delivery;
• The removal of cross-subsidies between different customer classes and types of services;
• Removal of property value based charges in favour of user based charges for all services;
and
• Removal of all pre-paid water allowances.33
IPART then canvassed two key economic principles that impinge on water pricing. The first is
efficiency and marginal costs. This economic theory suggests that the efficient price for a given
32
New South Wales Government, Ministry of Energy and Utilities, 2001/02 NSW Water Supply
and Sewerage, Performance Monitoring Report, 2003, at xvi.
33
Independent Pricing and Regulatory Tribunal of New South Wales, Investigation into Price
Structures to Reduce the Demand for Water in the Sydney Basin. Issues Paper, 2003, at 7.18 NSW Parliamentary Library Research Service
product equals its marginal costs – which is the cost of producing an additional unit of that
product. For water, the theory assumes that people will consume more and more water until the
price of additional water outweighs the benefits. In its calculations, the Tribunal uses long run
marginal costs, which also reflects the costs of capital investments that will be needed to augment
supply, as well as incorporating environmental, social and political factors. IPART noted the
difficulty in calculating the long run marginal costs of water supply due to the number of variables
involved. However, of greater importance, it noted debate about whether customers respond to
average or marginal prices. In terms of average prices, this approach assumes that customers look
at the total of their periodic bills and decide whether to use more or less water on the basis of this
one (average) price signal, rather than breaking their bill down into components and considering
the marginal price effects. Preliminary modelling by IPART suggests that if customers respond to
marginal prices, then the impact of alternative price structures on water consumption may be
substantial. If customers respond to average price structures, changes in demand are likely to be
relatively subdued.34
The second economic principle canvassed by IPART was that of price elasticity of demand. This
measures the percentage change in quantity demanded (eg, quantity of water used) which is
brought about by a change in price. Where a small change is price results in a large change in
quantity demanded, demand is said to be elastic. Where a small increase in price has little to no
demand, demand is said to be inelastic. After reviewing Australian and international research into
the price elasticity of demand for water, for their economic modelling IPART has assumed that for
residential customers in response to a 1.0 per cent increase in the average price of water: low
water consumers will reduce their water consumption by between 0.01 and 0.05 per cent;
medium water users will reduce their consumption by approximately 0.2 per cent and high water
users by 0.3 per cent.
IPART then outlined three possible water pricing scenarios, but notes that the prices quoted are
unlikely to be applicable when the Tribunal next sets prices in 2005. The scenarios were:
• Scenario 1: a higher usage charge offset by a removal of the fixed access charge, so that
customer water bills are more directly linked to the amount of water used;
• Scenario 2: an ‘inclining block tariff’, where customers initially pay a low (tier 1) usage
charge, but then pay a higher (tier 2) usage charge after a usage quantity of 400 kilolitres
per annum is reached;
• Scenario 3: the same structure as scenario 2, but the tier 2 charge applies after
consumption of 300 kL/pa.
Table 3 summarises the analysis of the three scenarios.
34
Independent Pricing and Regulatory Tribunal of New South Wales, Investigation into Price
Structures to Reduce the Demand for Water in the Sydney Basin. Issues Paper, 2003, at
22.The Future of Water Supply 19
Table 3: Summary of the three IPART scenarios
Scenario Fixed Tier 1 Tier 2 Step Effect on total water
access usage usage quantity consumption
charge charge charge Average Marginal
price price
response response
Current $76.55 0.98 n.a n.a n.a n.a
prices
Scenario 1 $0.00 $1.30/kL n.a n.a -9.65 -24.35
– (-100%) (+33%) GL/pa GL/pa
Increased
usage
pricing
Scenario 2 $57.41 $0.98/kL $1.75/kL 400 kL -9.84 -25.24
– Inclining (-25%) GL/pa GL/pa
block
tariff
Scenario 3 $57.41 $0.98/kL $1.45/kL 300 kL -8.85 -24.93
– Inclining (-25%) GL/pa GL/pa
block
tariff
Source: Independent Pricing and Regulatory Tribunal of New South Wales, Investigation into Price
Structures to Reduce the Demand for Water in the Sydney Basin. Issues Paper, 2003, at 19.
Total water consumption includes the effect on both residential and non-residential customers.
Whilst all three scenarios may result in broadly similar savings in water consumption, the price
impacts on customers differ significantly. Scenario 1, with removal of the fixed charge, results in
significant savings to customers with low levels of water consumption and comparatively more
modest increases in price for high volume water users. Scenario 2, an inclining block tariff with a
400 kL/pa step point, results in modest bill reductions for the majority of consumers, including
many with above average consumption, but significant increases for very high volume water users.
Scenario 3, an inclining block tariff with a 300 kL/pa step point, also results in bill reductions for
the majority of customers but increased bills would affect a greater proportion of customers than
scenario 2.35
The Tribunal was also required to consider the use of a wholesale step price for the bulk water
purchased by Sydney Water from the Sydney Catchment Authority. Under this price structure,
Sydney Water would pay:
• A tier 1 price for the first block of its water consumption up to the step quantity which
would be set at the sustainable yield of the catchment;
• A higher price – the tier 2 price, for consumption above the step quantity.
35
Independent Pricing and Regulatory Tribunal of New South Wales, Investigation into Price
Structures to Reduce the Demand for Water in the Sydney Basin. Issues Paper, 2003, at
20.20 NSW Parliamentary Library Research Service
The tier 2 price could effectively act as a ‘penalty’ price if it is set at a level which precludes
Sydney Water earning a commercial return on the retail sale of water purchased above the step
price. In effect, the use of a tier 2 price opens up a market for demand management and supply
augmentation where these can deliver water or water savings below the tier 2 price. IPART noted
that increasing the financial incentive for Sydney Water to engage in water conservation
acknowledges that it has a unique position in the market for estimating the costs and likely
effectiveness of water conservation strategies. Some key areas identified where Sydney Water is
likely to have an advantage for water conservation include:
• Targeting and reducing water delivery leakage;
• Reducing water usage in sewerage treatment processes;
• Conducting customer education and water use reduction targeting; and
• Implementing water restrictions.
The flexibility created by the introduction of a tier 2 wholesale step price allows the Tribunal at
future price determinations to increase or decrease the incentive placed on Sydney Water, based
on an assessment of its performance at achieving demand management and sourcing alternative
water supply such as recycled water.36
7.0 THE FUTURE OF WATER SUPPLY
In 1994 Sydney Water, (then the Water Board) funded four environment groups to critically
review aspects of the organisation’s water and wastewater management. The result, The Sydney
Water Project, recommended what were, at the time, some far reaching actions for Sydney
Water. Today, some ten years later, many of the recommendations are now accepted as
‘commonplace’. Recommendations of what actions Sydney Water should pursue over the next
decade (ie from 1994) from the Project included:
• No inter-basin transfers to augment supply;
• Cessation of planning for new water supply dams or augmentation of existing dams;
• Sewer mining and other re-use schemes to provide alternative supplies;
• Water efficiency and other conservation measures for domestic and commercial
customers;
• Dual reticulation and onsite stormwater retention for new developments;
• Water audits and retrofitting for existing buildings;
• Reducing the volume of sewage flows;
• Greater capture of biosolids;
• Moves to localised (decentralised) systems and individual systems;
• Prototypes of preferred systems in greenfield and urban renewal projects that promote
the recycling of water and community self-sufficiency in water supply.37
As noted, many of the above recommendations have been implemented by Sydney Water, and
the Government has stated its policy that no new dams will be built. However, inter-basin
36
Independent Pricing and Regulatory Tribunal of New South Wales, Investigation into Price
Structures to Reduce the Demand for Water in the Sydney Basin. Issues Paper, 2003, at
42.
37
Sydney Water Project, A New Course for Sydney Water. The Final Report of the Sydney
Water Project, 1994, at 100.You can also read