White Paper on International Economy and Trade 2020 Outline - July 2020 Trade Policy Bureau Ministry of Economy, Trade and Industry
←
→
Page content transcription
If your browser does not render page correctly, please read the page content below
White Paper on International
 Economy and Trade 2020
         [Outline]

              July 2020
          Trade Policy Bureau
Ministry of Economy, Trade and Industry

                                          1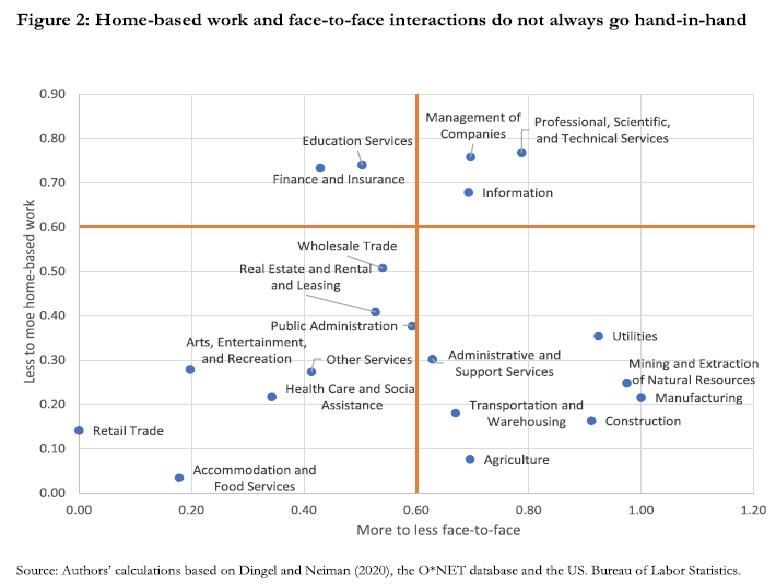
White Paper on International Economy and Trade: 2020
The world is facing the worst economic crisis since the Great Depression. COVID-19
has limited our face-to-face interactions, creating new challenges for the global
economy and international society.
To overcome this ongoing crisis, we should achieve a resilient economic and social
system to flexibly respond to shocks and ensure sustainable development.
1. The Coronavirus Pandemic Triggers a Global Economic Crisis 3. Globalization Past, Present and Future
The Great Lockdown recession is the Quarterly World GDP (IMF) Globalization has fostered exchange of, goods, Virtual
worst since the Great Depression. people, money, and ideas, developing the world immigration
Nature of COVID-19 crisis: limit on economy. would expand the
face-to-face interactions →”supply Globalization lowered the cost of moving goods, range of jobs
shock” + ”demand shock → moving ideas, and moving people (face-to-face).
employment/ income shock” Both telepresence and telerobotics allow workers
International collective actions are to perform tasks inside another nation without
needed to deal with the current global Source: IMFBlog 6/24, IMF WEO June 2020, and IMF staff calculations. actually being there.
crisis on infection and economy. Online communication has spread more rapidly
due to COVID-19 crisis.
2. What Coronavirus Reveals About the Structures of Our World
The supply chain disruption can be Global supply chain disruption 4.The Way Forward
seen in efficient production system EU→World US
We aim to achieve a resilient economic and social system to
Interrupted movement Quarantine measures for immigration
(inventory, cross-border of medical products prevented a free movement of experts
deal with crises flexibly and to ensure sustainable
EU
production sharing), flexible
Restrictions for China→Japan Whole world
Immigrants caused Supply disruption in Reduction in
parts of automobile and electronics
development.
labor shortage Passenger flights
logistics (land, maritime, air), and
also led to reduction
in air cargo
We aim to enhance global governance to prevent divisive
South East Asia→Japan
human mobility within/across
EU Supply disruption in parts of
It took more time automobile and electronics
for border crossing
borders. forces and to bring unifying forces for international
Geographic concentration of
China
Delays in land transportation,
Reduction in container ships
China
After new year holidays, mobility
restrictions for migrant workers
cooperation, to make the emergency measures temporary,
and to deal with true global challenges.
from China brought about labor shortage
production of vital supplies.
We aim to have resilient supply chains to prepare for and to
Source: Global Trade Alert, Japan External Trade Organization “Region/Analysis Report”,
Shortage of medical products and Cabinet Office “Economy Watcher Survey”, Sixfold、Baldwin ”Supply chain contagion waves:
Thinking ahead on manufacturing ‘contagion and reinfection’ from the COVID concussion”
emergency measures. deal with the next crisis.
Limit on face-to-face interactions We aim to turn this crisis into an opportunity to promote
show the value of digital digitalization and evolution of communication.
technology. 2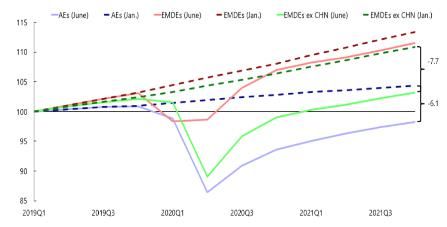
1. The Coronavirus Pandemic Triggers
a Global Economic Crisis
3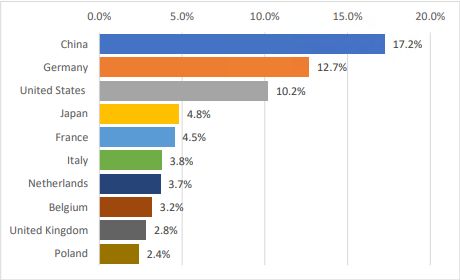
1-1.The Great Lockdown: the worst recession since
the Great Depression
The world experiences the worst economic crisis in a century (IMF names this crisis as
“the great lockdown”).
Supply chain disruption and business shutdown trigger outright supply shocks. There
are also adverse aggregate demand shocks to face-to-face service industries and
durable goods.
Quarterly World GDP Business activities and
disruption of supply chain
【Suspension of production】
Production halted due to lockdown. (manufacturing industry)
【 Disruption of the supply chain】
The parts plant has been ordered to stop production. As a result, parts
were not available and our company was unable to continue our own
production. (manufacturing industry)
Covid-19 and consumption
(YoY %、real)
(Japanese household, April 2020)
Notes: 2019 Q1=100 Source: IMFBlog 6/24, IMF WEO June 2020, and IMF staff calculations. Consumables for health use
Pasta
Assumption: For economies where infections are declining, Gaming device
Instant noodle
-persistent social distancing into the second half of 2020 Shochu-based beverage, cocktail
-greater scarring from the larger-than-anticipated hit to activity during the Microwave
lockdown in the first and second quarters Internet connection
gasoline
-a negative impact on productivity as surviving businesses enhance workplace Pants for Ladies
safety and hygiene standards Meals
For economies still struggling to control infection rates, Taxi
Business suit
-the need to continue lockdowns and social distancing will take an additional Train fare
toll on activity Air fare
In the event of a second outbreak, the resulting containment measures lead to a Package tour
Amusement Park
decrease in world output of about 4.9 percent in 2021, whereas in a faster
recovery from the lockdown measures implemented in the first half of 2020, -100 -50 0 50 100 150
Source: Japanese Statistics Bureau ”Family Income and Expenditure Survey”
global output improves by about one-half percent in 2020, relative to the baseline. Note: Japanese Consumption of April 2020, Year on Year % 41ー2.Economic shocks of coronavirus
The nature of the coronavirus economic crisis: The coronavirus pandemic has limited
face-to-face communication, causing both supply and demand shocks, resulting in
employment and income shock.
Traditional economic policy tools could be ineffective in combating the consequences of
the coronavirus.
Supply shock
Employment/ income shock
・Border closure/ ・Supply chain disruption
Lockdown ・F2F service suspension Decrease in income/
Massive unemployment
Demand shock
・Decrease in demand in F2F service
・Decrease in demand in durable goods
Unprecedented economic crisis affecting all regions and countries
Types of economic crisis
Type Consequences Demand shock Key to
or Supply shock Recovery
Natural Destruction of the Supply shock Reconstruction ・E.g. Great East Japan Earthquake
infrastructure /
disaster production facilities
Financial crisis Destruction of financial Demand shock Stabilizing financial
system system ・ E.g. Global Financial Crisis
Pandemic Avoiding human
interaction
Both supply and demand
shocks
Containing the virus
51ー3(1).Current situation of COVID economic crisis
China's economy shrank 6.8% in the first quarter, the first contraction on record. The
European Union's GDP saw its sharpest decline in the last 14 years. In some countries,
economies shrank by a record 20%.
Emerging economies face a looming economic crisis from the coronavirus.
COVID-19 economic crisis is expanding as an unprecedented crisis affecting all regions
and countries.
China GDP Growth Rate Europe GDP Growth Rate Emerging countries
(%)
(%)
(%)
GDP Growth Rate
10.0
Final 8 (Mexico)
consumption 5
Net Capital 6
formation 0 UK
5.0 4
Net export -8.5
-5 Germany 2
-8.6
0.0 0
-10 EU
-13.6 -2
-15 Spain -4.9
-5.0 -6.8 -4
-19.4
-20
Italy -6
-10.0
-19.6
-25 -8
Q1 Q2 Q3 Q4 Q1 Q2 Q3 Q4 Q1 France
Q1 Q2 Q3 Q4 Q1 Q2 Q3 Q4 Q1 Q1 Q2 Q3 Q4 Q1 Q2 Q3 Q4 Q1
-19.7
2018 2019 2020 2018 2019 2020 2018 2019 2020
Source: NBS,CEIC database Source: Eurostat
Note: Year-over-Year comparison Note: seasonal adjusted, Quarter-over- Source: INEGI, CEIC Database
Quarter annualized rate Note: seasonal adjusted, Quarter-over-
Quarter annualized rate 61ー3(2).Supply shock and its spillovers
As the global economy has become more integrated across transnational borders,
global supply chains have formed. Japan's imports from China fell sharply, as the
coronavirus ground factory production in China to a halt, resulting in production
disruption in Japan. The spread of COVID-19 has disrupted supply chains globally.
Lockdowns bar operations from doing businesses apart from those delivering essential
services, and voluntary restraint leads to voluntary suspension of nonessential services
(e.g. entertainment industry).
Japanese imports US industrial production Japanese industrial activities
from China (entertainment)
(YoY) (2012=100) (2015=100)
60% 115 140
Feb 109.3 Golf
40% Mar 104.3 120
110
100
20%
105 80 Entertainment
0%
Apr MoM 60
100 -11.2%
-20%
Automobile -72% Gym
40 -48.1%
Airplane -24%
-40%
95
Amusement and
20 Theme park
Feb. 2020 -47%
-60% Apr 92.6 -93.6%
0
90
2000
2001
2002
2003
2004
2005
2006
2007
2008
2009
2010
2011
2012
2013
2014
2015
2016
2017
2018
2019
2020
2019/10
2019/11
2019/12
2019/7
2019/8
2019/9
2020/1
2020/2
2020/3
Source: Ministry of Finance
Trade Statistics of Japan Source: FRB, CEIC Database Source:Indices of Tertiary Industry Activity 71ー3(3). Demand shock and its spillovers
To confine the infection, travel restrictions and other measures are introduced.
Demand for face-to-face services (e.g. tourism industry) has sharply declined.
Demand for durable goods is also disappearing. As a result, exports and production
have fallen sharply. Weak demand creates weak supply, and vice versa.
International tourist arrivals Japanese auto exports
(YoY) (YoY, %)
20%
0% 20
September 11 attacks
(2001) 0
-20%
SARS
-40% (2003) 70% -20
Global Financial Crisis decrease
(2008) -40
-60%
Apr. 2020
-80% -60
2018/1
2018/4
2018/7
2019/1
2019/4
2019/7
2020/1
2020/4
2018/10
2019/10
1996
1997
1998
1999
2000
2001
2002
2003
2004
2005
2006
2007
2008
2009
2010
2011
2012
2013
2014
2015
2016
2017
2018
2019
2020
Source: Mr. Zurab Pololikashvili, Secretary-General of United Nations Source: Ministry of Finance, Trade Statistics of Japan
World Tourism Organization
81ー3(4).Employment/ income shock
Face-to-face service industry has been hit hard by COVID-19. The US has suffered job
losses unprecedented since the Great Depression.
Households and corporations accumulate precautionary savings due to uncertainties,
unemployment, and sluggish income. Such excess savings further depress
consumption and investment leading to a vicious cycle of demand and supply shocks.
US unemployment rate Eurozone household savings rate
(%)
30
Great Depression
Apr. 2020 20
(%)
25 (1930s)
14.7
25.6
20 18
Global Financial Crisis
(2008) 16
15
10.0 Spring 2020 outlook
10 14
May, 2020
5 13.3 12
Autumn 2019 outlook
0
10
2016 2017 2018 2019 2020 2021
Source: FRED Economic Data, National Bureau of Economic Research Source: European Commission
91ー3(5).Commodity and financial market turmoil
Oil prices have plunged into negative territory due to the glut created by the COVID-19
global economic shutdown. Since May, oil prices have shown signs of recovery with the
economic reopening, and its market stability is crucial to ensure energy security for
both oil-producing and oil-consuming nations.
Stock markets plunge on coronavirus fears. As the disease has been somewhat
confined, economies have started to reopen and the governments and central banks
implement stimulus on an unprecedented scale, financial market stabilize.
Crude oil prices Stock prices
(dollars / barrel) ( Jan 1, 2020 = 100 )
80 110
North Sea
60 Brent
futures 100 Shanghai
40
Nikkei225
20
WTI 90 Doe Jones
futures
MSCI
0 80
Emerging
-20 markets
70 Euro Stoxx 50
-40
-60 60
2020/1 2020/2 2020/3 2020/4 2020/5 2020/6 2020/1/1 2020/2/1 2020/3/1 2020/4/1 2020/5/1
2020/1 2020/2 2020/3 2020/4 2020/5 2020/6
(Year and month)
(資料) Refinitivより作成。 (Year and month)
Source : Refinitiv Source : Refinitiv
101ー4.The need for international cooperation
The past pandemics did have a deadly second wave and a third wave. COVID-19
threatens to have devastating consequences in developing nations. If those nations fail
to contain the virus, the world cannot overcome the coronavirus. The economic crisis
will also last longer.
This global nature of the pandemic means the coronavirus crisis cannot end without
international cooperation.
Three different waves during Spanish Three tracks to a coronavirus vaccine
influenza in the U.S. (Ian Bremmer)
US/Europe (Tsunami)
The lockdowns aren't close to as
complete or effective. It will take
The second wave a longer time before the economy Developing world (missile)
can restart. there will be a much broader
(around fall of 1918)
path of trajectories, owning to
The first wave ・disparity in access to medical
(around March of 1918) institutions
The third wave ・economic stagnation by
lockdowns
(around January
of 1919)
China(Mountain)
The harshest possible lockdown made
a quick control of infection. The
economic activities quickly restarted.
Source : Centers for Disease Control and Prevention
(https://www.cdc.gov/flu/pandemic-resources/1918-commemoration/three-waves.htm)
Source : Ian Bremmer, Eurasia group
112. What Coronavirus Reveals About
the Structures of Our World
122-1.Supply chain disruption
The supply chain disruption can be seen in efficient production system (inventory,
cross-border production sharing), flexible logistics (land, maritime, air), and human
mobility within/across borders.
The disruption of supply chain
EU
Export restrictions on
medical products U.S.
Travel restrictions on engineers,
EU business persons, and experts.
Entry restrictions
China to Japan
for seasonal workers Auto parts and
electronics parts shortage. Global
Air cargo capacity
declines as number
of flights decrease
EU
Delays at
border crossings South East Asia to Japan
Auto parts and
China electronics parts shortage.
Lockdown causes delays in
road transports. China
Decreases in shipments Labor shortages
as migrant workers remain
their hometowns after
the Lunar New Year holiday
Source : Global Trade Alert, JETRO “Regional information and analysis”, Cabinet Office “Economy watchers survey”,
Sixfold, Baldwin ”Supply chain contagion waves: Thinking ahead on manufacturing ‘contagion and reinfection’ from the COVID concussion”.
132-2.Industry characteristics and COVID crisis
The COVID-19 crisis have brought uneven shocks to each industry.
Coronavirus outbreak disrupted the supply of components. Vehicle production was
suspended as automobiles have many parts and its industry relies on a complex
production system. Modularity has enabled the IT industry to continue production.
As demand for medical supplies exploded, many countries imposed export restrictions
on medical supplies.
Automotive IT Products Medical supplies Food
Many parts. Many processes from
Few Parts, Many operations cannot be
Factories Modular manufacturing is assembly to processing.
Few manufacturing processes mechanized.
adopted in Electric vehicles. Easy to be modularized.
Air transportation (high value- Air transportation (high value-
added), maritime added), maritime
Mainly by maritime
Logistics Mainly by air transportation transportation (general transportation (general-purpose
transportation
purpose), Land transportation products), and land
(general)) transportation (general)
Inventory Low inventory Low-Much inventory Low-Much inventory Much inventory
Diversification through
Assembly is labor-intensive.
Local Production and Local
High value-added General purpose products are
Supply chain Consumption Food is produced in good
components are concentrated mainly made in areas with low
before corona crisis Labor intensive parts tend climate and in good soil.
in locations where there are labor costs.
to be geographically
many highly skilled workers.
concentrated.
If the supply of some parts
Although the spread of the Demand for medical supplies Some countries have
is disrupted, the entire
infection has made it difficult surged in many countries. implemented export restrictions.
production process will
The effects of corona to procure parts and Export restrictions were There are delays in cross-
stagnate.
crisis assembly work for a period of imposed in many countries, border logistics, and in some
Also, operations were
time, many companies have leading to global supply areas there is a shortage of
suspended due to sluggish
continued to operate. shortages. workers for agricultural work.
demand
142-3.Production system: cross-border linkage
Japanese, South Korean and European automakers have suspended production amid
an increase in parts imports from China.
Although the amount of parts imports is not large, automobile industry has complex
production system and supply is concentrated, vehicle production was suspended.
Auto Parts Trade with China Share of wire harness exports
billion US dollar billion US dollar
5 10
4 8
%
40
3 Korea→China Japan→China
6
2 35
4
1
0
China→Korea 2 30
China→Japan
0 25
2001
2002
2003
2004
2005
2006
2007
2008
2009
2010
2011
2012
2013
2014
2015
2016
2017
2018
2019
20 Mexico
billion US dollar billion US dollar 15
15 2.5
US China Vietnam
2 10
10 Germany→China Romania
1.5 5
5 1 China→Mexico Philippines
China→Germany 0 Germany
0.5 2001
2002
2003
2004
2005
2006
2007
2008
2009
2010
2011
2012
2013
2014
2015
2016
2017
2018
2019
0 0 Mexico→China
2001
2002
2003
2004
2005
2006
2007
2008
2009
2010
2011
2012
2013
2014
2015
2016
2017
2018
2019
2001
2002
2003
2004
2005
2006
2007
2008
2009
2010
2011
2012
2013
2014
2015
2016
2017
2018
2019
Source:International Trade Centre
Source:International Trade Centre
Note:Wire harness is listed as HS code 854430.
Note:Auto Parts is listed as HS code 8708. 152-4. Logistics and human mobility
Tighter entry rules (e.g. quarantine, border closure) have raised international trade
costs and have reduced trade activity.
Restrictions on human mobility have negatively impacted global shipping. Global
logistics were disrupted by a decline in air cargo capacity as the number of flights
decrease. Also, there have been shortages of customs officials and border control
personnel.
Restrictions on human mobility also affected production. In Europe, where free
movement across borders is allowed generally, cross-border commuters face border
closure.
Responses on Human Shortages in Ports around the World The number of seasonal farmers needed
(Shortage of personnel in port management is reported in about 20% of ports) in major EU countries,
EU employees commuting across borders
100% Number of seasonal farmers needed
90% in major EU countries (thousand) Number of workers commuting across borders
80% 0 100 200 300 400
(Thousand)
70% 0 50 100 150
60% Germany
Poland→Germany
50%
40% France→Luxembu
Italy
30% rg
20% Germany→Luxem
10% France burg
0%
Dock workers Technical- harbar master Port Authority Slovakia→Austria
nautical services services
Spain
Normal presence moderate shortages shortages France→Belgium
Source:IAPH,WPSP
Note: W16,2020. It covers 90 ports around the world. Source:Eurostat 162-5.Concentrating production of vital supplies
As the international division of labor progresses, some supplies show geographical
concentration of production.
Many countries increase imports from China. Production concentration in Electric
Machineries, Electronic parts has intensified, while auto parts show a diverse
production base.
China’s share of each Import concentration index
country’s imports (HHI Index of importing countries)
Electric Machineries, Electronic parts Auto parts
30%
3,000 5,000
25% Japan
Japan 2,500 Vietnam Korea 4,000
Korea United
20% United 2,000 China
States
States 3,000 Thailand
Taiwan
15% 1,500 United
World China States
2,000
10% 1,000 World Spain
Germany Germany Japan Korea
1,000 World
5% 500
Germany
0% 0 0
2001
2003
2005
2007
2009
2011
2013
2015
2017
2019
2005
2001
2003
2007
2009
2011
2013
2015
2017
2019
2001
2003
2005
2007
2009
2011
2013
2015
2017
2019
Note:HHI index is used to measure concentration of suppliers to import. Higher index shows higher concentration. If CountryA imports from Country B that accounts for 50%
of total import of Country A, from Country C(30%),Country D(20%), HHI index of Country A is calculated as follows:502+302+202=3,800. If Country A imports from
only one country, the index is 1002=10,000 as the maximum. If country A is near from a major production country, HHI index of the country may be large.
Source: International Trade Centre 172ー6.Japanese manufacturing affiliates in China
The ratios of overseas production in transportation equipment and information
technology industries are high among manufacturing. Their revenues from China are
also huge. The number of Japanese intermediate suppliers in China is increasing and
they deepen Japanese-Chinese production linkage.
The ratio of local procurement is high for transportation equipment sector. The ratio of
procurement from Japanese parent company is high for sector of information and
communication electronics equipment.
The overseas production ratio The ratio of Japanese suppliers of Transportation equipment
and China’s share intermediate goods in China Automobile is “integral products”, which requires
coordination of various related companies for quality
China’s share in overseas production (%)
control such as strict safety control. Parts-suppliers
(companies) (%) are likely to locate near the assembly plant, partly
50 Transportation Information and because of transportation cost of heavy
Electrical Information and
600 100 components.
equipment communication
machinery communication electronics The local procurement ratio is high. Japanese
electronics equipment
40 Food equipment affiliates, located in Chins, procure over 75% from
89.3% suppliers in China.
400 90
30 83.4%
Information and communication electronics
200 80 equipment
20
General The ratio of international procurement is higher,
machinery Average because it has different industrial features;
characterized as “modular products”, low
10 0 70 transportation cost due to lightness of their
Transportation 2008 2017 2008 2017 components.
Chemicals equipment Suppliers of intermediate goods (A) Japanese affiliates in China procure over one third of
0 Final assemblers (B) total amount from their parent companies in Japan.
0 10 20 30 40 50 60 Ratio (A)/(A+B) (right axis) Another just under 15% comes from the third
countries. The local procurement stays around
Overseas production ratio (%) 40%. Japanese companies, in upstream position,
Source : : METI, “Basic Survey on Overseas Business Activities are easy to be influenced, when production
Source : METI, “Basic Survey on Overseas Business Activities”.
Note : The question is whether your main products is intermediate activities are disrupted in China.
Note : The scale of circle reflects the sales value of Japanese affiliates
in China.
goods or final ones. This question started for performance of 2008. 182ー7. Regional integration
Regional integration helps establish regional production networks. The shares of intra-
regional trade has been steady across the globe.
The nature of industrial trade patterns influences intra/inter regional trade patterns. In
the electrical industry, the share of Chinese imports has increased globally. Regional
integration maintains more intra-regional auto production networks.
Share of intra/inter-regional Share of intra/inter-regional trade Share of intra/inter-regional trade
trade (total) (Electrical machinery and electronic parts) (Auto parts)
100% 100% 100%
90% within Asia 90% 90% within Asia
60% 61%
80% (excluding
80% 80% (excluding within Asia
China 47%) within Asia China 57%) 59%
70% 70% within Asia 70%
87% (excluding
within Asia 78%
60% 60% (excluding 60% China 46%)
64% (excluding within
within China 54%) within
50% (excluding 50% China 57%) 50% NAFTA
EU within NAFTA
China 45%) 62%
40% 62% EU 40% within within 40% within within 58%
59% within EU EU EU EU
within
30% NAFTA 30% 55% 50% 30% 88% 84%
NAFTA
35% within within
20% 33% 20% 20%
NAFTA NAFTA
10% 10% 30% 23% 10%
0% 0% 0%
2005 2019 2005 2019 2005 2019 2005 2019 2005 2019 2005 2019 2005 2019 2005 2019 2005 2019
EU NAFTA Asia EU NAFTA Asia EU NAFTA Asia
EU NAFTA China Asia(except China) Others EU NAFTA China Asia(except China) Others EU NAFTA China Asia(except China) Others
Source: Created from International Trade Centre, World Input-Output Table.
Note: USMCA, a new trade agreement replacing NAFTA, went into effect in July 2020.
192ー8. Role of logistics in supply chain
Design of resilient supply chains requires stable logistics and alternative logistics
options
Maritime, air, and land transportations play different roles, and they complement each
other. It’s important to use effective transportations based on the type of goods.
Maritime transportation Air transportation Land transportation
In terms of trade volume, sea transportation In terms of trade amount of money, air transportation Land transportation and warehouses account
accounts for 99.7% of Japan's international trade accounts for 40% of Japan's international trade. for nearly 80% of Japan's overall logistics
costs
Overseas trade (weight basis, 2017) Transportation costs for agriculture, forestry,
Overseas trade (money basis, 2017)
industry and manufacturing (2014)
Air Warehouses Postal mail
Impact of each logistics
route Air transportation
Air transportation 14.9 % 2.9 %
transportation Land
Maritime 3.4 %
0.3 % 40% Maritime
transportation transportation
transportation Water transportation
99.7 % 63.7 %
60% 15.2 %
Source: Created from the Ministry of Land, Source: Created from the World Input-Output table.
Infrastructure and Transport. Source: ICAO
Suitable for transporting lightweight, high value- In domestic logistics, truck transportation,
Suitable for the mass transportation
Characteristics of each added products. The just-in-time production which is responsible for the "last mile,"
of heavy goods such as mineral
logistics route system has been upgraded by the short accounts for more than 90% of the total
fuels, iron ore, and foodstuffs.
transport time. by weight.
In the case of transportation between long For heavy goods and mass It is essential to connect before and after
Limitation of
distances, maritime transportation with a lengthy transportation, it is difficult to sea and air transportation. In international
substitutability of replace sea transportation with air
transit time is not suitable as an emergency trade, it is impossible to replace sea and
each logistics route transportation.
alternative means of transportation. air transportation with land transport.
Influence of measures to Decline in the number Blockade of some roads
Blockade of some
prevent the spread of new of operation of and railway tracks
ports
coronavirus infection passenger aircraft 202-9. Cross-border movement of people, trade and investment
The movement of people across borders stimulates trade and investment. This
relationship is particularly strong for emerging and developing economies.
COVID-19 decreases human mobility, and trade costs have increased. As a result,
trade and investment have stagnated significantly.
Trade costs
International travelers, trade (left panel) and World average = 100
Between 1995 and 2015, trade
foreign direct investment (right panel) 110 costs between the U.S. and China
100 fell significantly by about 30
90
80 percent above the global average.
45% 20% 70
70% 20% 60
50
18% 40% 40
60% 30
16% 35% 20
15% 10
50% 0
14% 30%
1995
1997
1999
2001
2003
2005
2007
2009
2011
2013
2015
40% 12% 25%
10% 10% U.S. ↔ Canada U.S. ↔ China U.S. ↔ Germany
20%
30% 8% Source: ESCAP-World Bank Trade Cost Database 。
15%
20% 6%
10% 5% Border crossing delays for truck
4%
10% 5%
2%
delay time (hours)
0% 0% 0% 0% 4
1980
1983
1986
1989
1992
1995
1998
2001
2004
2007
2010
2013
2016
2019
1990
1993
1996
1999
2002
2005
2008
2011
2014
2017
3 Transportation
time increased
World trade/World GDP(LHS) 2 due to
World foreign direct investment outward checkpoints,
1 etc.
stock/ World GDP (LHS)
International tourism number of International tourism number of
0
arrivals/World population(RHS) arrivals/World population(RHS) 3/3 3/6 3/10 3/13 3/17 3/20 3/24 3/27
Source: IMF WEO, UNWTO, World Bank -1
Source: World Bank, UNCTAD
Source: Created by Sixfold, Baldwin 212-10.Human concentration and the spread of virus
The movement of people across borders concentrates people to cities. The exchange of
diverse knowledge has led to an increase in innovation and increase in productivity.
Service industry, which requires F2F interactions, increases dominance in urban areas.
The new coronavirus infections has spread in urban areas with high population density.
Face-to-face communication costs are rising since the crisis.
New Coronavirus Infection Rates and
World population
Population Density by State in the U.S.
(100 million
people)
Infection rate (confirmed cases as of April 20th
100 /state population,%)
1.4
都市部
Urban area
80 1.2 New York
地方部
Rural area New Jersey
1
60
0.8
40 Massachusetts
0.6 Connecticut
20 0.4 Rhode Island
0 0.2
1950
1955
1960
1965
1970
1975
1980
1985
1990
1995
2000
2005
2010
2015
2020
California
0
0 200 400 600 800 1000 1200 1400
Population density (state population per square mile)
Source: UN Source: 1keydata, github 222ー11. Emergency measures
Demand for personal protective equipment has exploded, and shortages of medical
supplies have become serious in various regions. As a result, many authorities have
adopted emergency measures.
To ensure stable supply, it is important to prepare for crises and cooperate with other
countries in emergencies. Export restrictions may put themselves at risk as
complicated supply chains have been established (“paradox of export restriction”).
The Number of countries and separate customs territory Exporters of personal protective equipment
introducing export prohibitions and restrictions as a
result of COVID-19, by categories of products
China, Germany and US
account for about half of
the total export
Source: WTO https://www.wto.org/english/news_e/news20_e/rese_03apr20_e.pdf
Source: WTO https://www.wto.org/english/tratop_e/covid19_e/export_prohibitions_report_e.pdf
Note: Average from 2017 to 2019
Note: As of 22 April, 2020
232−12.Digitalization and COVID-19 crisis
During the COVID-19 Crisis, the digitization of the economy and society accelerated
rapidly, with the spread of e-commerce and online communications.
Social distancing and the rise of online communication remind us of the importance of
digitalization.
Online retail sales growth Daily Active Users of Facebook
(YoY) (QoQ)
(%) (million people) (%)
250 1,800 5
DAUs(左軸)
DAU (left)
200 Others 1,700 4
% compared to the
前期比(右軸)
150 Asia Pacific previous term (right)
1,600 3
North
100
America 1,500 2
50
Europe 1,400 1
0
-50 1,300 0
1/5 2/5 3/5 4/5 5/5
Source: Emarsys initiative, GoodData
Note: Online sales of brands that primarily sell in stores through apps, etc. Source: Facebook
242−13.The growing presence of mega IT firms
The rapid spread of digital technologies is transforming many economic and social
activities (e.g. the expansion of digital trade, cross-border e-commerce, internet of
things). The amount of global data traffic is growing faster than the size of the
economy.
The progress of digitalization changes the industrial structure from “value chain model”
to “layer model.” Along with this business model change, the network effect
contributes to the growing presence of mega IT firms.
Data traffic expands beyond economic scale Market capitalization, sales and net income
(Internet Traffic/Global GDP) share of the U.S. mega IT firms
20%
(Monthly Traffic Volume [EB]/World GDP [trillions of dollars])
1.5 Market capitalization
時価総額
Asia 15%
Pacific Sales
売上
1 10% 純利益
Net income
North
America 5%
0.5
0%
Europe
0
Others
Source: Refinitiv
Note: Amazon, Alphabet, Facebook, Apple, Microsoft
Source: Cicso, IMF Market capitalization, revenue and net income shares of the five
Microsoft companies in the S&P500 as a whole 252−14.Capital outflow and supply chain
Capital outflows from emerging and developing economies, which rely on commodity,
tourism industry, and dollar funding. This is one symptom of the dollar-concentration
risk.
Emerging Asian economies are expanding their dollar credit. As the supply chain is a
payment chain in reverse, if this payment risk materializes, supply chain disruption
might happen.
Cumulative nonresident portfolio flows to Dollar credit in the emerging Ratio of output to value added
emerging markets(percent of GDP, based on Asian countries in the emerging markets
daily observations) (100 million dollars)
(%) 1,400 India 0 2 4 6
1,200 Malaysia
マレーシア
0.10 Vietnam
China’s Devaluation(2015) 1,000 ベトナム
China 中国
Declining in Emerging markets(2018) 800
0.00 600
South南アフリカ
Africa
Brazil ブラジル
400 India インド
-0.10 Taper tantrum(2013) 200 Thailand タイ
0 Russia ロシア
Global financial Turkey トルコ
-0.20 2000
2001
2002
2003
2004
2005
2006
2007
2008
2009
2010
2011
2012
2013
2014
2015
2016
2017
2018
2019
crisis(2008) Philippines
フィリピン
Bruneiブルネイ
-0.30 (100 million dollars) Argentina
COVID-19 500 アルゼンチン
Cambodia
カンボジア
Crisis(2020) Malaysia
-0.40 400
Source OECD
300 The larger this value is, the greater the
-0.50 production activity used for intermediate
200 inputs, and the wider the supply chain.
t
t + 90
t + 30
t + 60
100
0
2000
2001
2002
2003
2004
2005
2006
2007
2008
2009
2010
2011
2012
2013
2014
2015
2016
2017
2018
2019
Source: IMF Global Financial Stability Report
Note: Cumulative basis. Non-resident securities investment.
Source: BIS 263. Globalization:
Past, Present and Future
273ー1.Globalization and world development
Globalization promotes and increases interactions between different regions and
populations around the globe, fostering exchange of goods, people, money, and ideas,
making it a major driving force for the development of the world economy.
Furthermore, due to the ICT revolution in recent years, factories were crossing
borders, bringing the knowhow of advanced economies’ firms to emerging economies,
accelerating global growth.
World GDP after 1800s The number of immigrants Foreign Direct Investment
(stock) (stock)
(trillion (trillion
dollars) (100 million people) dollars) Others
その他
120 3 Asia(expect China)
アジア(中国を除く)
35
China
中国
100 2.5 30 Europe
欧州
U.S.
米国
80 2 25
World
世界
1.5 20
60
1 15
40 10
0.5
20 0 5
1990 1995 2000 2005 2010 2015 2019 0
0
高所得国
2012
1990
1992
1994
1996
1998
2000
2002
2004
2006
2008
2010
2014
2016
2018
High-income countries
1800 1900 2000 (year)
Middle-income countries
中所得国
Source: Our World in Data
Low-income countries
低所得国
Note: The units are international dollars
as of 2011. Source: UN Source: UNCTAD 283ー2(1).Globalization’s first unbundling
Globalization can be thought of as a progressive reversal of the forcible bundling. Three
costs of distance mattered: the cost of moving goods, moving ideas, and moving
people.
In the first unbundling (from 1820 to 1990), the Industrial Revolution fostered and was
fostered by transportation technology, lowering the cost of moving goods and
separating of production and consumption.
The first unbundling Features Transportation costs
(Separation of production and The first unbundling was all about in the U.S.
consumption) allowing nations to better exploit their (Cent)
comparative advantages.
3.5
Country A Raw materials and final products were
traded between countries. 3.0
While shipping got cheaper, the costs of 2.5
moving ideas and people fell much less.
2.0
This unbalanced reduction of separation
costs triggered a chain of causes and 1.5
effects that eventually produced 1.0
(1820~) enormous income differences between
0.5
today’s developed and developing
Country A Country B
nations. 0.0
1865
1873
1881
1889
1897
1905
1913
1921
1929
1937
1945
1953
Roles of nations Source: Fred, Federal Reserve Bank
of St. Louis
Promoting free trade and achieving a Note: This data is derived from
Source: Richard Baldwin and Fukunari Kimura. welfare state, building global governance. revenue per ton-mile railroad in the
United State
(e.g.)GATT system
293ー2(2).Globalization’s second unbundling
In the second unbundling (from 1990 to 2015), the information and communication
technology (ICT) revolution lowered the cost of moving ideas. ICT made offshoring
feasible, which promoted the development of the global supply chain.
The second unbundling Communications Costs
(International separation Features in the U.S
Rich-nation firms sent their marketing, (1990=100)
of factories) managerial, and technical know-how
along with the production stages that 110
HQ in had been moved offshore.
Country A As a result, the wage gap between 100
today’s developed and developing
nations has shrunk. 90
The international trade of intermediate
goods developed, which promoted the 80
expansion of the global supply chain.
70
Roles of nations 60
Facilitating trade and investment 50
environments, including rule-making in
1990
1993
1996
1999
2002
2005
2008
2011
2014
2017
bilateral and regional frameworks
Factory Factory Factory (e.g. )EPAs
Source: Fred, Federal Reserve Bank of
in Country B in Country C in Country D St. Louis
(parts) (assembly) (painting) Note: This data is derived from the US
PCE price index of communication
Source: Richard Baldwin and Fukunari Kimura.
303ー2(3). Globalization’s third unbundling
In the third unbundling (from 2015), face-to-face cost is plunging thanks to both
telepresence and telerobotics. They allow workers from one nation to perform tasks
inside another nation without actually being there. Such virtual immigration would
expand the range of jobs that are directly subject to international competition.
The world experiences COVID-19 crisis during the transition to the third unbundling.
Online communication has been accelerating and accelerated by the new globalization.
Features Online communication tool
The third unbundling Many menial and professional tasks in
(Teams and Zoom)
(Likely to allow labor services to be developed nations could be performed
(million people ) (million people )
physically unbundled from laborers.) remotely by workers and professionals
sitting in developing nations. It would 50 350
also allow developed-nation 300
professionals to apply their talents on a 40
much wider basis. 250
For example, Japanese engineers could 30 200
repair Japanese-made capital Microsoft Teams
equipment in South Africa by (Daily active users, left)
20 150
controlling sophisticated robots from
Tokyo. 100
10 Zoom
(Daily meeting 50
participants, right)
Roles of nations 0 0
2018/10
2018/12
2019/10
2019/12
2018/4
2018/6
2018/8
2019/2
2019/4
2019/6
2019/8
2020/2
2020/4
Strengthening human capital,
Securing person, and developing
infrastructures and rules required to
Source: Richard Baldwin and Fukunari Kimura. promote digitalization.
Source: Microsoft, Zoom video communications
313ー3.Globalization for Japan
Japan has played an important role in the development of the second unbundling in East
Asia. Japanese companies have extended international production networks and forming
industrial agglomerations. Japanese GVC participation has shifted from forward to backward
where companies provide high-value-added products with high technological capabilities in
Japan.
Japan achieved rapid economic growth as a “trade nation” after the war. While it becomes
the world largest creditor along with building supply chain network, Japan has transformed
itself from “trade nation” to “investment nation.” Its current account balance is now
determined by investment income rather than trade surplus.
GVC participation rate in Japan (trillion yen)
Breakdown of Japan's current account
60% 40
50% 30
current account balance
40% 20
30% 10 primary income
balance
20%
0
10% trade balance
-10 invisible trade balance
0% service balance
current transfer balance
-20 secondary income balance
1994
1990
1992
1996
1998
2000
2002
2004
2006
2008
2010
2012
2014
2016
2018
1974
1989
2004
1965
1968
1971
1977
1980
1983
1986
1992
1995
1998
2001
2007
2010
2013
2016
2019
Backward Participation(importing foreign inputs to produce the goods and services they
export) Source: Bank of Japan, "balance of payments"; Policy Research Institute, Ministry of Finance, "Financial Statistics
Monthly“
Forward Participation(exporting domestically produced inputs to partners in charge of Note: The primary income balance shows interest and dividends arising from external financial claims and debts.The
secondary income balance shows the balance of the provision of assets without compensation between migrants
downstream production stages) and non-migrants.In the 1980s, there was a change in the current account balance. Before that, the balance was
Source: OECD TIVA divided into the trade balance, the non-trade balance, and the current transfer balance. The non-trade balance
Note: The GVC participation rate indicates the percentage of exports in the global value corresponds to the current service balance, the primary income balance, and the current transfer balance
chain on a value added basis, and the higher the ratio, the more it contributes to the corresponds to the current secondary income balance.
formation of the global value chain. 323ー4.Third unbundling in the world
The third unbundling is driving a new industrial revolution. Infrastructure such as 5G
and AI, is important for this transformation. In the world, nations take measures to
develop the environment, and to establish digital related rules, such as the GDPR of
Europe.
In the wake of the COVID-19 pandemic, the Chinese government announced that it
would accelerate the construction of new infrastructure.
Examples of global AI strategies Three areas of
China's new infrastructure construction
European Commission:
“AI White Paper” (February 2020) U.S.:
・Europe should become a global Revised “National Strategic Plan for Research
leader in AI systems that can be and Development of Artificial Intelligence” 1.Information infrastructure
used and applied safely. (June 2019)
・Achieving "reliability" and (e.g.)5G, IoT, satellite Internet, AI,
・Prioritizing long-term investments in AI
"superiority" for safe AI research to maintain U.S. leadership. cloud computing, blockchain.
development that respects the ・Developing an effective method to realize
values and rights of citizens. collaboration between humans and AI.
・Ensuring system safety and security.
・Expanding public-private partnerships in AI.
China: 3.Innovation infrastructure
“Next Generation Artificial Intelligence 2.Unified infrastructure
Development Project" (July 2017) (e.g.) Critical science and
・By 2030, China will be the world's best in theory, (e.g.) Intelligent transport technology infrastructure,
technology and application. system infrastructure, science and education
・The size of the core AI industry and related infrastructure, industrial
smart energy
industries was expanded to 1 trillion yuan and 10
infrastructure, etc. technology innovation
trillion yuan, respectively.
・Key development areas include AI, software,
infrastructure, etc.
hardware, intelligent robots, autonomous driving,
virtual reality (VR), augmented reality (AR), smart
devices, and IoT core components. Source: April 20, 2020: National Development and Reform Commission
Source: JETRO, The Foundation for MultiMedia Communications Written based on Wu Hao, Chief of Innovative Digital Department 333ー5.Japan's challenges toward the third unbundling
Nevertheless companies in Japan have a high level of ICT utilization capabilities in
general, investments on and utilization of intangible assets, including digital ones are
insufficient.
Recognizing the importance of improving the regulatory environment, Japan leads
international rule-making on digital economy in order to materialize “Data-Free Flow
with Trust (DFFT)” and efforts toward realizing “Governance Innovation” that promotes
innovation and achieves social value.
It is important to turn the COVID crisis into an opportunity to promote digitalization
Investments on tangible and intangible assets Concept of Data Free Flow with Trust
(ratio to GDP) (DFFT)
U.S. Japan
(%) (%) 有形資産投資
investment in tangible assets Data Free Flow with Trust(DFFT)
40 有形資産投資
investment in tangible assets 40
無形資産投資
investment in intangible assets
無形資産投資
investment in intangible assets
Data security
30 30 Data free flow and safety
20 20
E-commerce rule-making at Multilateral regulatory
10 10 the WTO cooperation
・Negotiations are under way ・The framework for mutual
0 among 84 member countries at transfer of personal data
0 the Joint Statement Initiative on between Japan and the EU
1995
1997
1999
2001
2003
2005
2007
2009
2011
2013
2015
2017
electronic commerce at the has come into force, in
1995
1997
1999
2001
2003
2005
2007
2009
2011
2013
2015
2017
WTO. January 2019.
・Promotion of CBPR (APEC)
Source: based on INTAN-Invest, SPINTAN, JIP Database 2015, Penn World Table 9.1, etc.,
with reference to the Japan Center for Economic Research. 343ー6.Combating the coronavirus with innovative tech
and social implementation
The coronavirus outbreak has forced the society to adopt innovative technology such
as contact tracing apps and online meetings to continue business activities while
keeping social distance.
As governments and companies introduce the apps in response to the Coronavirus, the
balance between public health and privacy has become an issue around the world.
New innovations (examples) Examples of initiatives in each country
The South Korean
Use digital data such as location and government published Taiwan government
Tracking and payment to identify contact with infected apps to monitor the manages sales of masks
by utilizing ID numbers
management persons. China and South Korea are trying
behavior of infected
of health insurance
people. Anonymized
of the to track close contacts, and UK and attributes and travel Source: wall street journal
cards.
infected Singapore are also use tracking technology. histories are disclosed.
China's Megvii has Unmanned transporters
developed an AI deliver medicine and food to
Automated diagnosis using AI, health
system that can quarantined patients and
check, serving in contaminated areas identify people with drones go on patrol,
Unmanned using robots and drones, monitoring and hyperthermia from a measure body temperature,
operation disinfection, etc. now widely used in
crowd of 15 people per Source: Toyo keizai
and disinfect rooms in China
second within 5m.
China for safe and efficient control of
infectious diseases. PingAn GoodDoctor, a Alibaba provides
medical app, conducted comprehensive telework
1.1 billion remote support software to
Telemedicine, education, telework, etc. 10 million companies free of
Remote Some hospitals are introducing 5G and
treatments during
COVID. Insurance charge. The number of users
communication VR. covers. They also have a has reached 200 million
24 hour service. members. Baidu and others
follow.
Source:NHK
354. The Way Forward
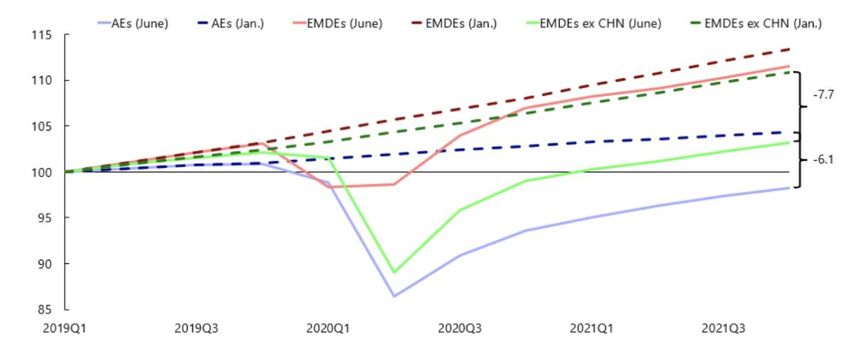
364ー1.Globalization trend
Globalization promotes cross-border human mobility, capital flow, trade and data flow,
which is the engine of economic growth and development.
The COVID crisis happens amid the third unbundling and digitalization. This COVID
crisis encourages remote communications, and rethink of global supply chain.
With/after this crisis, cross-border data flow will be accelerated.
Recent trends and projections
Trade, investment, human mobility (2015=100) (2015=100)
(2000=100%) 500 140 Baseline scenario
500% GDP
450 -3% Longer outbreak in
450% Acceleration? 120 2020 plus new
FDI 400
(stock) -6% outbreak in 2021
400%
350 100 -13% Optimistic
350% Trade
scenario
300
300% Original 80
250% GDP 250 forecast -32% Pessimistic
200 60 scenario
200% Data traffic FDI
150% 150 (flow)
40
100% Trade volume
100
50% Migrant stock 20
50
0%
0 0
2000
2001
2002
2003
2004
2005
2006
2007
2008
2009
2010
2011
2012
2013
2014
2015
2016
2017
2018
2019
2020
Source:UNCTAD, UN, WTO, IMF Source:Cisco, 2019, IMF, WTO, UNCTAD
Note:In the IMF projections of GDP, “Baseline scenario” assumes that the spread of the infection is stamped out in
the second quarter of 2020 (first quarter in China). “Longer outbreak in 2020 plus new outbreak in 2021”
assumes that the continuation of the spread of the infection during 2020 as well as a second wave of spread in 2021.
374−2.The way forward: lessons from the COVID crisis
Based on the lessons of the COVID crisis, we should identify the risks of the global
system and how the system will evolve with/after the COVID-19.
We have to achieve an ideal global economic and social system while overcoming the
current crisis.
Lessons learned from the COVID crisis
1.Global challenges and 2.Efficiency and Risk 3.Infection and Economy
divisive forces
・ Pandemic cannot be contained ・Geographical concentration ・ Limit on face-to-face
without international cooperation. of production interactions
・ Emergency measures and distrust ・Risk of supply disruption ・ Acceleration of digitalization
of global agreements and institutions
The way forward
2. Supply chain 3. Evolution of human
1.Upgrade globalization
resilience communication
We should achieve a resilient economic and social system
to deal with crises flexibly and to ensure sustainable development
384ー3.Upgrade globalization
Pandemic calls for international cooperation to overcome the current crisis, to make
the emergency measures temporary, and to deal with true global challenges.
Divisive forces are rampant, even before the pandemic, undermining cooperation.
Global leaders
Divisiveare trying to bring unifying forces.
forces Unifying forces
Unifying forces
Divisive forces ◎ Ministerial Statement G20 Trade and Investment (3/30)
The Ministers agree that emergency measures designated to tackle COVID-19, if
■ Increasing trade restrictions deemed necessary,
① must be targeted, proportionate, transparent, and temporary,
・ US-China trade friction. ② do not create unnecessary barriers to trade or disruption to global supply chains,
・ Unilateral measures. ③ are consistent with WTO rules.
The Ministers emphasize ④our commitment to notify the WTO of any trade related
・ Export restrictions on PPE etc. measures taken.
◎ Japan-ASEAN Economic Ministers’ Joint Statement on
Initiatives on Economic Resilience(4/22)
■ Risks of market fragmentation ASEAN and Japan express their commitment to make utmost efforts to prevent
• Increased national security regulations. stagnation of economic activities by ensuring the smooth flow of goods and to
strengthen cooperation on building resilient supply chains. ASEAN and Japan are
preparing the "ASEAN-Japan Economic Resilience Action Plan".
■ International organizations, regional ◎ Statement on COVID-19 and the Multilateral Trading System
by Ministers Responsible for the WTO (5/5)
integration
① We stress that trade restrictive emergency measures aimed at protecting health, if
・ WTO reform (incl. Appellate Body). deemed necessary, shall be targeted, proportionate, transparent and temporary, not
create unnecessary barriers to trade or disruption to global supplychains, and be
・ United States withdrawal from the Paris consistent with WTO rules.
Agreement, cutting WHO fund. ② We support the full resumption of all WTO activities as soon as feasible.
・ Doubt over European project: BREXIT etc. ③ We will also support continued efforts to reform the WTO so that it is
as effective as possible. 394ー4.Toward the sustainable development goals(SDGs)
To deal with current/future global crises and risk, such as pandemics and
environmental issues, and to contribute to sustainable development, increasing social
investment is urgent.
All actors, including states, companies, NGOs, and individuals, should work together to
actively invest to achieve the Sustainable Development Goals (SDGs).
The trend of green bond issuance Proportion of sustainable investing
300 (billion USdollar) (%) relative to total assets
257.5 70
Australia/New Zealand
250
60
200 Canada
170.9 50
160.8
Europe
150
40
87.2 United States
100 30
50 36.6 41.8 20
11 Japan
0.8 0.4 0.9 3.9 1.2 3.1
10
0
2007
2008
2009
2010
2011
2012
2013
2014
2015
2016
2017
2018
2019
0
2014 2016 2018
Source:The Green Bond Issuance Promotion Platform、Climate Bonds Initiative Source: 2018 Global Sustainable investment review
Note:Green bonds are bonds issued by private companies, international organizations, national Note:In 2014,data for Japan was combined with the rest of Asia,so this information is not
and local governments to raise funds for environmental projects, such as combating global available.
warming, pollution prevention and control, biodiversity conservation, and sustainable water ESG investments take into account not only financial information, but also environmental,
resources management, with limited use. social and governance initiatives. Given that the SDGs are a universal goal, investors
should consider the following in evaluating each company's ESG Efforts to address the
SDGs can be a criterion for judgment. 404−5.Resilient supply chain: Comprehend supply chain
For resilient supply chains, it is necessary to balance efficiency and risk of supply chain
disruption. The first step is to fully comprehend the supply chain and its network.
Production network has been evolving based on comparative advantages and the type
of goods. While the presence of China is growing in general, Japan plays an important
role in an ICT goods production network.
All goods and services ICT goods
2000 Greece Portugal
2000
Malta Spain Netherlands
Switzerland Malta Ireland
Norway Cyprus Brazil Estonia
Italy Latvia ラ Sweden Italy Cyprus
Netherlands Ireland Luxembourg Brazil
France Austria
Luxembourg Mexico
Finland Belgium France Canada
Sweden UK UK
China Denmark Mexico
Belgium
Germany Turkey Spain
Switzerland US Canada
Pakistan Poland
Kore US
Norway Germany Philippines Kyrgyzstan
Austria Russia Kazakhstan
Japan Chin Sri Lanka
Hong Kong Czech
Denmark Bulgaria Lithuania Taiwan India
Hungary Hong Kong Malaysia
Poland Sri Lanka Indonesia Australia Slovenia Bangladesh Japan India
Finland Latvia Mongolia Pakistan Vietnam Australia
Nepal Portugal
Thailand Malaysia Mongolia
Kyrgyzstan Vietnam Bhutan Romania Russia
Fiji Nepal Taiwan
Estonia Czech Croatia Singapore Korea Bhutan
Philippines Brunei Slovakia Kazakhstan
Hungary Romania Slovakia Cambodia
Maldives Turkey
Laos Thailand Singapore
Bangladesh Croatia Bulgaria Laos
Greece Indonesia
2017
Lithuania Cambodia
2017 Portugal
Malta
France UK
Hong Kong
Philippine Ireland
Malta
Switzerland Laos Fiji
Brunei Maldives Fiji
Italy Cyprus ル Pakistan
Lithuania Spain Norway Austria Italy Pakistan
Netherlands Laos UK Sri Lanka
Latvia Kyrgyzstan Mongolia ル Fiji Czech
Kazakhstan Sweden Mongolia Mexico
Poland Hong Kyrgyzstan
Switzerland
France Kong Maldives Ireland Canada
Russia Brazil Spain Cambodia
Canada
Belgium Poland
Germany Brazil
Norway China Romania Netherlands
Sweden Malaysia US
ル Japan Germany Brunei
Denmark China US
Finland Austria Estonia ル Russia
Australia Mexico Hungary
Kazakhstan
Denmark Slovenia Belgium Slovakia Taiwan Luxembourg
Croatia ル
Vietnam Philippines
Czech Korea Finland Indonesia
Greece ル
Indonesia Sri Lanka Cyprus Korea
Hungary Brunei Portugal Singapore
Singapore
Bulgaria Latvia Australia
Romania Thailand India Bulgaria
Slovakia
Taiwan
Slovenia
Lithuania
Vietnam
Japa Bangladesh
ル Greece
Luxembourg Croatia
Maldives India Malaysia
Nepal Turkey Nepal
Source: Li et al. (2019) Turkey
Bhutan Thailand
41
Cambodia Bangladesh BhutanYou can also read