CONSUMPTION IN BELGIUM - 10-year evolution (2010-2019) in the community, nursing homes and hospitals
←
→
Page content transcription
If your browser does not render page correctly, please read the page content below
HEALTHC A R E -A SSO C IA T ED INFEC TI O NS AND
                                     ANTIMICR OB I AL RESISTAN C E

    ANTI M I CROBI AL
CONSUM PTI ON I N BELGI UM

   10-year evolution (2010-2019) in
   the community, nursing homes
            and hospitals

                 –

                                                                1
W HO
                     WE
                     ARE
                          –

SCIENSANO can count on more than 700 staff members
who commit themselves, day after day, to achieving our
motto: Healthy all life long. As our name suggests,
science and health are central to our mission.
Sciensano’s strength and uniqueness lie within the
holistic and multidisciplinary approach to health. More
particularly we focus on the close and indissoluble
interconnection between human and animal health and
their environment (the “One health” concept). By
combining different research perspectives within this
framework, Sciensano contributes in a unique way to
everybody’s health.
For this, Sciensano builds on the more than 100 years of
scientific expertise of the former Veterinary and
Agrochemical      Research      Centre     (CODA-CERVA)
and the ex-Scientific Institute of Public Health
(WIV-ISP).

                                                           2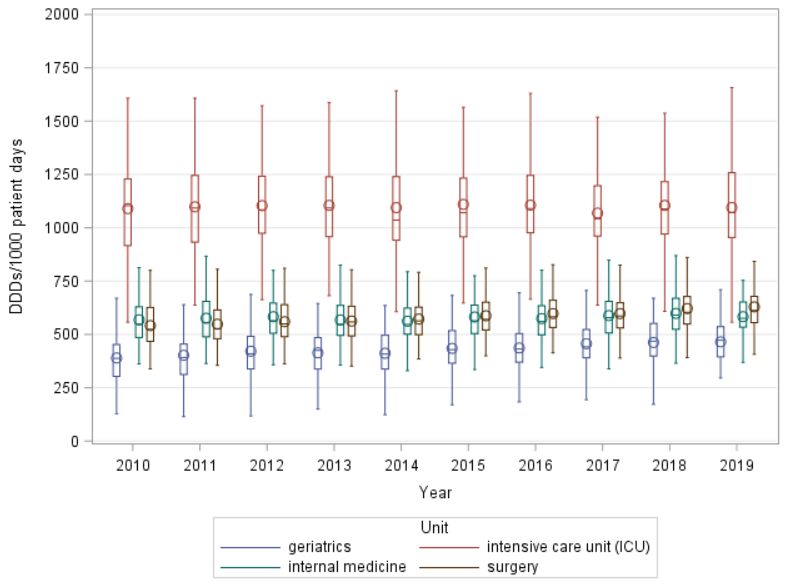
Sciensano
Epidemiology and public health – Healthcare-associated
infections and antimicrobial resistance
March 2021 • Brussels • Belgium
Internal reference number: D/2021/14.440/10
–
VANDAEL E.1
LATOUR K.1
CATRY B.1,2
In collaboration w ith
Versporten A.3,4, Goossens H.4, Coenen S.3,4, Magerman K.3,5
1. Sciensano, Healthcare-associated infections and antimicrobial resistance, Brussels
2. Faculty of Medicine – Université libre de Bruxelles (ULB)
3. Belgian Antibiotic Policy Coordination Commission (BAPCOC), Brussels
4. Univ ersity of Antwerp, Laboratory of Medical Microbiology, Vaccine & Infectious Disease Institute (VAXINFECTIO), Antwerp
5. Jessa hospital, Hasselt
Eline Vandael • T+32 2 642 50 26 • eline.vandael@sciensano.be
With the financial support of Partners
Please cite as: Vandael E., Latour K., Catry B. Antimicrobial consumption in Belgium: 10-year evolution
(2010-2019) in community, nursing homes and hospitals . Brussels, Belgium: Sciensano; 2021. p.89
Report Number: D/2021/14.440/10. Available from: http://w w w.nsih.be/surv_gm/dow nload_en.asp.
3CONTENT
● ABBREVIATIONS 7
● EXECUTIV E SUMMARY 8
● SAM ENVATTING 11
● RESUM E 15
● BACKGROUND 19
● MET HODS 20
Data collections 20
Data definitions and analysis 23
● RESULT S 25
Community/Primary care (including nursing homes) 25
Nursing homes 33
Hospitals 35
Impact of shortages of antimicrobial agents on consumption 63
● DISCUSSION 72
Main results 72
Current situation in the veterinary sector 74
Strengths and weaknesses 75
Future perspectives 76
● ACKNOWL EDGEM ENT S 77
● REFERENCES 78
Appendix 1 : Methods and results of a validation study of BeH-SAC 83
4List o f Tab le s
Table 1: Overview of the data sources used in this national report (p.22)
Table 2: Evolution (2010-2019) of antibiotic consumption in the community (nursing homes included) per antibiotic subclass
(ESAC-Net 2019, Belgium) (p.27)
Table 3: Evolution (2010-2019) of the consumption of other antimicrobial products in the community (nursing homes included)
per subclass (ESAC-Net 2019, Belgium) (p.30)
Table 4: Summary table of the main results on antimicrobial consumption of HALT 1/2/3 in Belgian nursing homes and HALT
3 in EU/EEA long-term care facilities (p.33)
Table 5: Evolution (2010-2019) of antibiotic consumption in the hospitals (all sorts combined) per antibiotic subclass,
expressed in DDDs/1000 inhabitants/day (ESAC-Net 2019, Belgium) (p.37)
Table 6: Evolution (2010-2019) of antibiotic consumption in the hospitals per sort of hospital (acute/categorical/psychiatric )
and antibiotic subclass, expressed in DDDs/1000 patient days and DDDs/1000 admissions (BeH-SAC, Belgium) (p.40)
Table 7: Evolution (2010-2019) of the consumption of other antimicrobial products in hospitals (all sorts combined) per
subclass, expressed in DDDs/1000 inhabitants/day (ESAC-Net 2019, Belgium) (p.44)
Table 8: Summary table of the main results on antimicrobial consumption of the ECDC- and Global-PPS in Belgian acute
hospitals and ECDC- PPS 2 in EU/EEA acute hospitals (p.45)
Table 9: Summary table of the main results on antimicrobial consumption of the HALT-PSY study in Belgian psychiatric
hospitals and psychiatric w ards in acute hospitals (p.46)
Table 10: Evolution (2010-2019) of the median consumption of broad-spectrum antibiotics in Belgian acute hospitals ,
expressed in DDDs/1000 patient days (BeH-SAC) (p.57)
Table 11: Evolution (2010-2019) of the total antibiotic consumption, percentage broad-spectrum antibiotic use and ratio
antibiotic use in the Access/Watch group (WHO) in non-pediatric and non-psychiatric inpatient w ards in acute hospitals (BeH-
SAC, Belgium) (p.61)
Table 12: Overview of shortages of antimicrobial agents in Belgium in the last five years (January 2015-January 2020) and
changes in consumption data (p.64)
Table 13: Summary of the main results on antimicrobial consumption per sector (community versus hospitals, Belgium) (p.73)
Table 14: Overview of the strengths and w eaknesses of the databases used in this report (p.75)
5List o f F ig u r e s
Figure 1: Stacked bar plot w ith the evolution (2010-2019) of antibiotic consumption in the community (nursing homes included)
per antibiotic subclass (ESAC-Net 2019, Belgium) (p.28)
Figure 2: Evolution (2010-2019) of total antibiotic consumption (J01) in the community in Belgium, the Netherlands, France,
Germany and the mean in the EU/EEA countries (ESAC-Net 2019) (p.29)
Figure 3: Evolution (2010-2019) of total antimycotic consumption (J02) in the community in Belgium, the Netherlands, France
and Germany (ESAC-Net 2019) (p.31)
Figure 4: Stacked bar plot w ith the evolution (2010-2019) of antibiotic consumption in the hospitals
(acute/categorical/psychiatric) per antibiotic subclass (ESAC-Net 2019, Belgium) (p.39)
Figure 5: Evolution (2010-2019) of total antibiotic consumption (J01) in hospitals, expressed in DDDs/1000 inhabitants/day
(DID), in Belgium, the Netherlands, France, Germany, Sw eden, Denmark and the mean in the EU/EEA countries (ESAC- Net
2019) (p.42)
Figure 6: Evolution (2010-2019) of total antibiotic consumption (J01) in acute or general hospitals, ex pressed in DDDs/1000
patient days (left) and DDDs/1000 admissions (right), in Belgium, the Netherlands, France, Sw eden and Denmark (BeH-SA C
and national reports) (p.43)
Figure 7: Boxplots of the evolution (2010-2019) of total antibiotic consumption (J01) in Belgian acute hospitals, expressed in
DDDs/1000 patient-days, all hospitals (left) and per type of hospital (right) (BeH-SAC) (p.49)
Figure 8: Boxplots of the evolution (2010-2019) of total antibiotic consumption (J01) in Belgian acute hospitals, expressed in
DDDs/1000 admissions, all hospitals (left) and per type of hospital (right) (BeH-SAC) (p.51)
Figure 9: Boxplots of the evolution (2010-2019) of total antibiotic consumption (J01) in Belgian acute hospitals, expressed in
DDAs/1000 patient-days, all hospitals (left) and per type of hospital (right) (BeH-SAC) (p.50)
Figure 10: Boxplots of the evolution (2010-2019) of total antibiotic consumption (J01) in Belgian acute hospitals, expressed in
DDAs/1000 admissions, all hospitals (left) and per type of hospital (right) (BeH-SAC) (p.52)
Figure 11: Violin plots of the evolution (2010-2019) of total antibiotic consumption (J01) in Belgian acute hospitals, expressed
in DDDs/1000 patient days, all hospitals (A) and per type of hospital (B: primary, C: secondary, D: tertiary) (BeH-SAC) (p.53)
Figure 12: Top 10 of most used antibiotic (J01) and antimycotic (J02) products in Belgian acute hospitals in 2019, expressed
in DDDs/1000 patient days (BeH-SAC) (p.54)
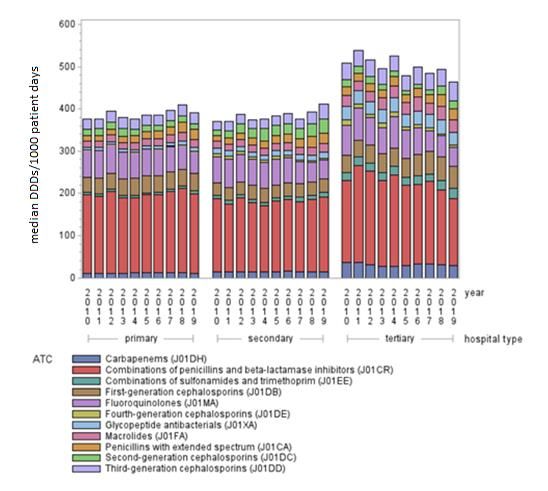
Figure 13: Stacked bar plot w ith the evolution (2010-2019) of antibiotic consumption in Belgian acute hospitals, per type of
hospital and per antibiotic subclass (BeH-SAC) (p.55)
Figure 14: Boxplots w ith the evolution (2010-2019) of the percentage broad-spectrum antibiotic use of the total antibiotic use
in Belgian acute hospitals, per type of hospital (BeH-SAC) (p.56)
Figure 15: Boxplots w ith the evolution (2010-2019) of the percentage intravenous (IV) use of the total antibiotic use in Belgian
acute hospitals, per type of hospital (BeH-SAC) (p.58)
Figure 16: Boxplots w ith the evolution (2010-2019) of the total antibiotic (J01) use in Belgian acute hospitals, per type of w ard
(intensive care unit, surgery, internal medicine, geriatrics) (BeH-SAC) (p.59)
Figure 17: Boxplots of the evolution (2010-2019) of total antimycotic consumption (J02) in Belgian acute hospitals, expressed
in DDDs/1000 patient days, per type of hospital (BeH-SAC) (p.60)
Figure 18: Use of the reports of BeH-SAC on Healthstat by Belgian hospitals (p.62)
6ABBREVIATIONS
ABUH = Antibiotic Use in Hospitals
AMR = Antimicrobial resistance
ATC = Anatomical Therapeutic Chemical Classification
BAPCOC = Belgian Antibiotic Policy Coordination Commission
BeH-SAC = Belgian Hospitals – Surveillance of Antimicrobial Consumption
BelVet-SAC = Belgian Veterinary Surveillance of Antibacterial Consumption
CI = confidence intervals
DDA = daily dose administrated
DDD = Defined Daily Dose
DID = DDDs/1000 inhabitants/days
EU/EEA = European Union/European Economic Area countries
ECDC = European Center for Disease Prevention and Control, Stockholm, SE
EFSA = European Food Safety Authority
EMA = European Medicines Agency
ESAC-Net = European Surveillance of Antimicrobial Consumption Network
FAMHP = Federal agency for medicines and health product (FAGG-AFMPS)
FTE = full-time equivalent
Global/ECDC-PPS = Point Prevalence Studies of antimicrobial consumption, resistance and
healthcare-associated infections in acute hospitals
H database (NIHDI) = data delivered by insurance companies on the number of patient days
HALT = Point prevalence survey of Healthcare-associated infections and Antimicrobial use in Long-
Term care facilities (HALT-PSY: in psychiatric institutions)
ICU = intensive care unit
IM = intramuscular
IV = intravenous
IQR = interquartile range
MDRO = multidrug resistant organisms
NAP = National AMR action plan
NIHDI = National Institute for Health and Disability Insurance (RIZIV-INAMI)
OPAT = Outpatient parenteral antimicrobial therapy
PH database (NIHDI) = data delivered by insurance companies on the consumption of
pharmaceutical products in hospitals
PID = packages/1000 inhabitants/days
PO = per os (oral)
SC = subcutaneous
SHA database (NIHDI) = data delivered by insurance companies for each anonymized stay in
hospitals
WHO = World Health Organization
7EXECUTIVE SUMMARY
-
Antimicrobial consumption is monitored in Belgium following national and international protocols through
longitudinal or cross-sectional studies. Longitudinal studies rely on existing administrative data with few details
that are continuously collected, whereas cross-sectional studies collect details on the applied preventive or
curative regimen at a given point in time (point prevalence study).
The objective of this national report is to present an overview of the trends in antimicrobial consumption in the last
decade (2010-2019) for the different human settings (community, nursing homes, hospitals), based on the results
of following surveillances and studies:
- European Surveillance of Antimicrobial Consumption Network (ESAC-Net)
- Belgian Hospitals – Surveillance of Antimicrobial Consumption (BeH-SAC)
- Point prevalence survey of healthcare-associated infections and antimicrobial use in long-term care facilities
(HALT) and in psychiatric institutions (HALT-PSY)
- Global (https://www.global-pps.com/) and European (ECDC-PPS) Point Prevalence Studies of antimicrobial
consumption, resistance and healthcare-associated infections in acute hospitals
ESAC-Net BeH-SAC HALT / ECDC-PPS Global-PPS
HALT-PSY
Data source Reimbursement Reimbursement Data collected locally Data collected Data collected
data data locally locally
Type of study Surveillance Surveillance Point prevalence Point prevalence Point prevalence
study study study
Setting Community Acute, HALT: long-term care Acute hospitals Acute hospitals
(including nursing categorical and facilities (mainly (inpatient w ards) (inpatient w ards)
homes) and psychiatric nursing homes),
hospitals hospitals (data HALT-PSY:
(aggregated data) per hospital) psychiatric hospitals
and psychiatric w ards
in acute hospitals
Main indicator Defined daily DDDs/1000 Prevalence (%) of Prevalence (%) of Prevalence (%)
doses patient days, residents w ith at least patients w ith at of patients w ith
(DDDs)/1000 DDDs/1000 one antimicrobial least one at least one
antimicrobial antimicrobial
inhabitants/day admissions prescription on the
prescription on the prescription on
(DID) day of the PPS day of the PPS the day of the
PPS
Start year in 1997 2003 2010 2011 2015
Belgium
Included years 2010-2019 2010-2019 HALT: 2010, 2013, Surveys in 2011 Surveys in 2015,
in the present 2016; HALT-PSY: and 2017 2017, 2019
report 2017
Antimicrobial agents are classified using the Anatomical Therapeutic Chemical (ATC) classification of the World
Health Organization (WHO) Collaborating Centre for Drugs Statistics and Methodology. The following ATC codes
were included as antimicrobial agents: A07AA (intestinal anti-infectives), D01BA (antifungals for systemic use),
J01 (antibacterials for systemic use), J02 (antimycotics for systemic use), J04A (drugs for treatment of
tuberculosis), J05 (antivirals), P01AB (nitroimidazole-derived antiprotozoals). Consumed units/packages per drug
were translated in defined daily doses (DDDs) based on the DDD classification of WHO (version December 2020).
Administration routes included are oral (PO), intravenous (IV), intramuscular (IM), subcutaneous (SC), inhalation
and rectal. Other topical use (e.g. transdermal via ointments) were excluded in the present report. Trends analysis
of the total consumption over 10 years (2010-2019) were performed using linear regression. P-valuesagents as outlined in national (Belgian Antibiotic Policy Coordination Commission (BAPCOC)) and international
action plans and recommendations. The main results per sector are summarized below.
Com m unity (including nursing hom es) Hospitals
Overall (reim bursed) antibiotic consum ption: Overall (reim bursed) antibiotic consum ption:
2010-2019: significant decrease in DIDa (-14%) All hospitals
23.1 DID in 2010 to 19.8 DID in 2019 (20.6 DID in 2010-2019: significant decrease in DID (-13%)
2019 if non-reimbursed consumption of 1.76 DID in 2010 to 1.54 DID in 2019
fluoroquinolones (estimation) is taken into account) Comparison w ith neighboring countries:
Comparison w ith neighboring countries: - EU/EEA mean in 2019: 1.77 DID (2010-2019: +0%)
- EU/EEA mean in 2019: 18.0 DID (2010-2019: -5%) - The Netherlands in 2019: 0.80 DID (2010-2019: -14%)
- The Netherlands in 2019: 8.7 DID (2010-2019: - France in 2019: 1.74 DID (2010-2019: -4%)
-13%) Acute hospitals (inpatients wards $)
- France in 2019: 23.3 DID (2010-2019: +0.4%) 2010-2019: significant increase in DDDs/1000 patient days
(+3%), 442.8 in 2010 to 457.8 in 2019
2010-2018: significant decrease in DDDs/1000 admissions
(-6%), 3486 in 2010 to 3276 in 2018
Top 5 m ost used products in 2019: Top 5 m ost use d products in 2019:
amoxicillin, amoxicillin + clavulanic acid, nitrofurantoin, Acute hospitals (non-psychiatric inpatient wards)
azithromycin, cefuroxime amoxicillin + clavulanic acid, cefazolin, piperacillin + tazobactam,
flucloxacillin, ciprofloxacin
Ratio am oxicillin/am oxicillin + clavulanic acid: Ratio am oxicillin/am oxicillin + clavulanic acid:
From 0.85 (46/54) in 2010 to 1.04 (51/49) in 2019 All hospitals
From 0.08 (7/93) in 2010 to 0.14 (12/88) in 2019
Indicator broad-spectrum antibiotic use b: Indicator broad-spectrum antibiotic use c:
2.38 in 2010 to 1.94 in 2019 Acute hospitals (non-pediatric, non-psychiatric inpatient wards)
(% of all antibiotics: 54.3% in 2010 to 48.1% in 2019) 32.1% in 2010 to 31.3% in 2019 (not significant)
Overall antim ycotic and antifungal consum ption: Overall antim ycotic and antifungal consum ption:
2010-2019: significant decrease in DID (-9%) All hospitals
3.3 DID in 2010 to 3.0 DID in 2019 2010-2019: significant decrease in DID (-28%)
Among the highest consumers of antimycotics and 0.13 DID in 2010 to 0.09 DID in 2019
antifungals in EU/EAA countries (2019: EU/EEA mean Comparison w ith neighboring countries in 2019: EU/EEA mean
1.0 DID, the Netherlands 1.3 DID, France 1.3 DID) 0.12 DID, France 0.21 DID
Observed prevalence of residents w ith at least one Observed prevalence of patients w ith at least one
antim icrobial prescription on one day: antim icrobial prescription on one day:
Nursing homes Acute hospitals (inpatients wards)
4.3% in 2010, 5.1% in 2013, 5.6% in 2016 28.9% in 2011, 27.4% in 2015, 27.0% in 2017, 27.8% in 2019
Psychiatric hospitals
3.8% in 2017
Quality indicators BAPCOC policy plan 2014-2019 (1)
From 800 prescriptions/1000 inhabitants/year in 2014 Choice of the antibiotic in line w ith the local guidelines in ≥90%
to 600 in 2020 and 400 in 2025 of the cases (therapeutic use)
Not possible to assess w ith the ESAC-Net data, based on Global PPS: 80.7% in 2015, 81.7% in 2017, 83.7% in 2019
packages/1000 inhabitants in 2019 (734) estimated at steady improvement, but target not yet reached
±700 prescriptions/1000 inhabitants/year
target not yet reached
Reduction in % fluoroquinolones from 10% in 2014 to Indication of the antim icrobial noted in the m edical file in ≥90%
5% in 2018 of the cases
Estimated at 6.7% in 2019 (taking non-reimbursed Global-PPS 2015: 79.9%, ECDC/Global- PPS 2017: 81.9%, Global-
consumption (estimation) into account) PPS 2019: 85.2%
improvement, but target not yet reached steady improvement, but target not yet reached
Ratio am oxicillin/am oxicillin + clavulanic acid from 1 Choice of the antibiotic for surgical prophylaxis (SP) in line
(50/50) in 2014 to 4 (80/20) in 2018 w ith the local guidelines in ≥90% of the cases
Still 1.04 (51/49) in 2019 Global PPS: 70.8% in 2015, 73.8% in 2017, 79.8% in 2019
target not yet reached steady improvement, but target not yet reached
Duration of the surgical prophylaxis (SP) treatm ent in line w ith
the local guidelines in ≥90% of the cases
Global PPS: 28.1% of SP >1 day in 2015, 25.3% in 2017, 18.9% in
2019 steady improvement
a. DID: Defined daily doses (DDDs)/1000 inhabitants/day
b. total DDDs J01(CR+DC+DD+(F-FA01)+MA)/J01(CA+CE+CF+DB+FA01)
c. % DDDs J01(CR05+DD+DE+DF+DH+MA+XA+XB+XX08+XX09+XX11)/J01
$ inpatient wards include surgery, internal medicine, geriatrics, pediatrics, intensive and non -intensive neonatology, maternity, infectious
disease, burn unit, intensive care (ICU), specialized care and psychiatry (outpatient wards and day hospitalizations excluded)
* Values underlined & in bold: significant trend as obtained by linear regression (p-v aluesA significant decrease/improvement is seen in the (reimbursed) antibiotic consumption in the community, but the
Belgian consumption (expressed in DDDs/1000 inhabitants/day) is still high in comparison with other EU/EEA
countries. The ratio amoxicillin / amoxicillin+clavulanic acid only slightly improved over time. Based on total sales
data, we estimate that the total consumption of fluoroquinolones in 2019 is still responsible for 6.7% of the total
antibiotic consumption (-37% in comparison with 2017 and -16% in comparison with 2018). Worrisome, following
the more strict reimbursement criteria for fluoroquinolones, the consumption of fluoroquinolones without
reimbursement has strongly increased. The use of antimycotics and antifungals in the community in Belgium is
among the highest of all participating EU/EEA countries in ESAC-Net. Although a significant decrease over time
is seen, the antimycotic consumption in Belgium is still 3 to 6 times higher than our neighboring countries.
In hospitals, the antibiotic and antimycotic/antifungal consumption is in line with the EU/EEA mean if expressed in
DDDs/1000 inhabitants/day. In acute hospitals, expressed in DDDs/1000 patient days, there was a significant
increase in antibiotic consumption between 2010 and 2019 (probably explained by the evolution towards shorter
hospital stays with a more intensive antibiotic treatment on less patient days). The percentage of broad-spectrum
use (±31%) did only slightly improve over the last decennium (not significant). For several results (total antibiotic
consumption, antibiotic consumption on ICU, % broad-spectrum use, % IV use) a high variation was found
between acute hospitals, also when compared per type of hospital (primary, secondary, tertiary). High outliers
should be further targeted to understand the reasons behind these outlying results and identify possible points for
improvement. Strikingly, only half of antimicrobial prescriptions in 2019 had a stop/review date documented in the
medical record (Global-PPS). It is advised that a legal framework is provided requiring prescribers to document a
stop/review date. Preferably, this would be integrated in the hospital’s electronic systems to enable information
exchange with the hospital pharmacy.
Although improvement is seen over the last few years, none of the targets of the quality indicators set up by
BAPCOC in their 2014-2019 action plan were reached based on 2019 data, indicating that the efforts need to be
pursued. Actions are planned to further sensibilize prescribers to use antibiotics in a prudent way, with special
attention for the use of broad-spectrum antibiotics. Antimicrobial consumption data linked with indications would
help to evaluate this consumption in a more thorough way and to provide more detailed feedback to prescribers.
Certain agents have been shown to be (temporary) unavailable from the Belgian market, and often this is the case
for older small-spectrum agents (out of patent). This scenario promotes the irrational use of more last line agents
and should be avoided to decrease the resistance selection for these newer compounds. Data on shortages of
antimicrobial agents in Belgium over the last five years (January 2015 - January 2020) were collected from the
PharmaStatus database from the Federal agency for medicines and health product (FAMHP). In this period, 44
antibiotic products (ATC codes) were implicated. Especially when only one alternative exists, a shortage can have
a substantial impact. FAMHP is consulting several companies to find sustainable solutions to bring unavailable
antimicrobial agents on the Belgian market again.
A new national One Health action plan against antimicrobial resistance (2020-2024) is currently being finalized.
This action plan contains different approaches to improve the prudent use of antimicrobial consumption and new
indicators to follow-up the impact of these approaches on antimicrobial consumption and resistance. It also
planned to publish a One Health national report over all sectors (human and animals) in the coming years with
combined results on antimicrobial consumption and resistance.
10SAMENVATTING
-
Antimicrobiële consumptie wordt in België gemonitord volgens nationale en internationale protocollen door middel
van longitudinale en cross-sectionele studies. Longitudinale studies zijn gebaseerd op beschikbare
administratieve data met weinig details die continue verzameld kunnen worden, terwijl cross -sectionele studies
details verzamelen over de toegepaste preventieve en curatieve behandelingen op één punt in de tijd
(puntprevalentiestudie).
Het objectief van dit nationaal rapport is om een overzicht te presenteren van de trends in antimicrobiële
consumptie in het laatste decennium (2010-2019) voor de verschillende humane settings (ambulante zorg,
woonzorgcentra, ziekenhuizen), op basis van de resultaten van de volgende surveillances en studies:
- Europese Surveillance van Antimicrobiële Consumptie Netwerk (ESAC-Net)
- Belgische ziekenhuizen – Surveillance van Antimicrobiële Consumptie (BeH-SAC)
- Puntprevalentiestudie van zorggerelateerde infecties en antimicrobieel gebruik in chronische zorginstellingen
(HALT) en psychiatrische instellingen (HALT-PSY)
- Global (https://www.global-pps.com/) and Europese (ECDC-PPS) puntprevalentiestudies van antimicrobiële
consumptie, resistentie en zorggerelateerde infecties in acute ziekenhuizen
ESAC-Net BeH-SAC HALT / ECDC-EPP Global-EPP
HALT-PSY
Databron Terugbetalings- Terugbetalings- Data lokaal Data lokaal Data lokaal
data data verzameld verzameld verzameld
Type van studie Surveillance Surveillance Puntprevalentie- Puntprevalentie- Puntprevalentie-
studie studie studie
Setting Ambulante zorg Acute, HALT: chronische Acute Acute
(inclusief categorische en zorginstellingen (vnl. ziekenhuizen ziekenhuizen
w oonzorgcentra) psychiatrische w oonzorgcentra), (intramurale (intramurale
en ziekenhuizen ziekenhuizen HALT-PSY: afdelingen) afdelingen)
(geaggregeerde (data per psychiatrische
data) ziekenhuis) ziekenhuizen en
psychiatrische
afdelingen in acute
ziekenhuizen
Belangrijkste Dagdosissen DDD's/1000 Prevalentie (%) van Prevalentie (%) Prevalentie (%)
indicator (DDD's)/1000 ligdagen, residenten met van patiënten met van patiënten met
inw oners/dag DDD's/1000 minstens één minstens één minstens één
antimicrobieel antimicrobieel
(DID) opnames antimicrobieel
voorschrift op de voorschrift op de
voorschrift op de dag dag van de PPS dag van de PPS
van de PPS
Startjaar in 1997 2003 2010 2011 2015
België
Geïncludeerde 2010-2019 2010-2019 HALT: 2010, 2013, Studies in 2011 Studies in 2015,
jaren in het 2016; HALT-PSY: en 2017 2017, 2019
huidige rapport 2017
Antimicrobiële middelen worden geclassificeerd volgens de Anatomische Therapeutische Chemische (ATC)
classificatie van de Wereldgezondheidsorganisatie (WHO). De volgende ATC-codes worden geïncludeerd als
antimicrobiële middelen: A07AA (intestinale anti-infectie middelen), D01BA (antifungale middelen voor systemisch
gebruik), J01 (antibiotica voor systemisch gebruik), J02 (antimycotica voor systemisch gebruik), J04A
(geneesmiddelen voor de behandeling van tuberculose), J05 (antivirale middelen), P01AB (antiparasitaire
middelen: nitroimidazole-derivaten). Verbruikte eenheden/verpakkingen per geneesmiddel worden vertaald in
dagdosissen (DDD's: defined daily doses) gebaseerd op de DDD classificatie van het WHO (versie december
112020). De volgende routes van toediening worden geïncludeerd: per os (PO), intraveneus (IV), intramusculair (IM), subcutaan (SC), inhalatie en rectaal. Ander topisch gebruik (bvb. transdermaal via zalven) werd niet meegenomen in het huidige rapport. Trendanalyses van de totale consumptie over 10 jaar (2010-2019) werden uitgevoerd met behulp van lineaire regressie. P-waardes
Ratio am oxicilline/am oxicilline + clavulaanzuur van 1 Keuze van het antibioticum voor chirurgische profylaxe in lijn
(50/50) in 2014 naar 4 (80/20) in 2018 m et de lokale richtlijnen in ≥90% van de gevallen
Nog steeds 1.04 (51/49) in 2019 Global PPS: 70.8% in 2015, 73.8% in 2017, 79.8% in 2019
doelstelling nog niet behaald geleidelijke verbetering, maar doelstelling nog niet behaald
Duur van de chirurgis che profylaxe behandeling in lijn m et de
lokale richtlijnen in ≥90% van de gevallen
Global PPS: 28.1% van de chirurgische behandelingen >1 dag in
2015, 25.3% in 2017, 18.9% in 2019
geleidelijke verbetering
a. DID: Defined daily doses (DDD's)/1000 inwoners/dag
b. totaal DDD's J01(CR+DC+DD+(F-FA01)+MA)/J01(CA+CE+CF+DB+FA01)
c. % DDD's J01(CR05+DD+DE+DF+DH+MA+XA+XB+XX08+XX09+XX11)/J01
$ intramurale afdelingen: chirurgie, interne geneeskunde, geriatrie, pediatrie, intensieve en niet -intensieve neonatologie, materniteit,
infectieuze ziektes, intensieve zorgen (ICU), gespecialiseerde zorg en psychiatrie (poliklinische afdelingen en daghospitalisaties
geëxcludeerd)
* Waardes onderlij nd en in het v et: significante trend geanalyseerd met lineaire regressie (p-w aardesonbeschikbaarheden van antimicrobiële middelen in de laatste 5 jaar (januari 2015 - januari 2020) uit de
FarmaStatus databank van het Federaal Agentschap voor Geneesmiddelen en Gezondheidsproducten (FAGG).
Er waren in deze periode 44 verschillende antibiotica (ATC-codes) onbeschikbaar. Vooral in de gevallen dat er
maar één alternatief voorradig is, kan een tekort een belangrijke impact hebben. Het FAGG consulteert
verschillende bedrijven om duurzame oplossingen te vinden om onbeschikbare antimicrobiële middelen terug op
de Belgische markt te brengen.
Op dit moment wordt er een nieuw nationaal One Health actieplan tegen antimicrobiële resistentie (2020-2024)
gefinaliseerd. Dit actieplan bevat verschillende strategieën om het voorzichtig gebruik van antimicrobiële middelen
te verbeteren en nieuwe indicatoren om de impact van deze strategieën op antimicrobiële consumptie en
resistentie op te volgen. Er zijn eveneens plannen om in de komende jaren een nationaal One Health rapport te
publiceren over alle sectoren (humaan en dieren) met gecombineerde resultaten over antimicrobiële consumptie
en resistentie.
14RESUME
-
En Belgique, la consommation d’antimicrobiens est surveillée selon des protocoles nationaux et internationaux
au moyen d’études longitudinales et cross-sectionnelles. Les études longitudinales sont basées sur les données
administratives disponibles avec le peu de détails qui peuvent être collectés, alors que les études cross-
sectionnelles collectent des détails sur les traitements préventifs et curatifs appliqués à un point donné dans le
temps (étude de prévalence ponctuelle).
L’objectif de ce rapport national est de présenter un aperçu des tendances dans la consommation d’antimicrobiens
au cours de la dernière décennie (2010-2019) pour les différents cadres humains (soins ambulatoires, maisons
de repos et de soins (MRS), hôpitaux), sur la base des résultats des surveillances et études suivantes:
- Surveillance européenne du réseau de consommation d’antimicrobiens (ESAC-Net)
- Hôpitaux belges – Surveillance de la consommation d’antimicrobiens (BeH-SAC)
- Etude de prévalence ponctuelle (EPP) des infections associées aux soins et de l’usage des antibiotiques dans
les institutions de soins chronique (HALT) et dans les institutions psychiatriques (HALT-PSY)
- Etudes de prévalence ponctuelles globales (https://www.global-pps.com/) et européennes (ECDC-EPP) de la
consommation d’antimicrobiens, de la résistance antimicrobienne et des infections liées aux soins dans les
hôpitaux aigus.
ESAC-Net BeH-SAC HALT / ECDC-EPP Global-EPP
HALT-PSY
Source des Données de Données de Données collectées Données Données
données remboursement remboursement localement collectées collectées
localement localement
Type d’étude Surveillance Surveillance Etude de prévalence Etude de Etude de
ponctuelle prévalence prévalence
ponctuelle ponctuelle
Cadre Soins Hôpitaux aigus, HALT: institutions de Hôpitaux aigus Hôpitaux aigus
ambulatoires (y catégoriques et soins chroniques (unités (unités
compris les MRS) psychiatriques (principalement: intramuros) intramuros)
et les hôpitaux (données par MRS); HALT-PSY:
(données hôpital) hôpitaux
agrégées) psychiatriques et
unités psychiatriques
d’hôpitaux aigus
Indicateur Doses DDD/1000 Prévalence (%) de Prévalence (%) Prévalence (%)
principal quotidiennes journées résidents recevant de résidents de résidents
(DDD)/1000 d’hospitalisation, au moins une recevant au recevant au
résidents/jour DDD/1000 prescription moins une moins une
(DID) admissions d’antimicrobien le prescription prescription
jour de l’EPP d’antimicrobien le d’antimicrobien le
jour de l’EPP jour de l’EPP
Année de 1997 2003 2010 2011 2015
lancem ent en
Belgique
Années 2010-2019 2010-2019 HALT: 2010, 2013, Les études de Les études de
incluses dans le 2016; HALT-PSY: 2011 et 2017 2015, 2017 et
présent rapport 2017 2019
Les antimicrobiens sont classifiés selon la classification anatomique, thérapeutique et chimique (ATC) de
l’Organisation mondiale de la santé (OMS). Les codes ATC suivants sont inclus comme antimicrobiens: A07AA
15(agents d’anti-infection intestinale), D01BA (antifongiques à usage systémique), J01 (antibiotiques à usage systémique), J02 (antimycotiques à usage systémique), J04A (médicaments destinés au traitement de la tuberculose), J05 (antiviraux), P01AB (antiparasitaires: dérivés des nitroimidazoles). Les unités/emballages utilisés par médicament sont traduits en doses quotidiennes (DDD: defined daily doses) basées sur la classification DDD de l’OMS (version décembre 2020). Les voies d’administration suivantes sont incluses: per os (PO), intraveineuse (IV), intramusculaire (IM), sous-cutanée (SC), inhalation et rectale. Un autre usage topique (p. ex. transdermique via des pommades) n’a pas été repris dans le présent rapport. Des analyses de tendances de la consommation totale sur 10 ans (2010-2019) ont été réalisées à l’aide de la régression linéaire. Les valeurs P
Réduction en % des fluoroquinolones de 10% en Indication de l’antim icrobien notée dans le dossier m édical
2014 à 5% en 2018 dans ≥90% des cas
Estimé à 6.7% en 2019 (consommation non remboursée Global-EPP 2015: 79.9%, ECDC/Global- EPS 2017: 81.9%, Global-
(estimation) prise en compte) EPP 2019: 85.2%
amélioration, mais l'objectif pas encore atteint amélioration constante, mais l'objectif pas encore atteint
Ratio am oxicilline/am oxicilline + acide clavulanique Choix de l’antibiotique pour la prophylaxie chirurgicale
de 1 (50/50) en 2014 à 4 (80/20) en 2018 conform e aux directives locales dans ≥90% des cas
Toujours 1.04 (51/49) en 2019 Global-EPP: 70.8% en 2015, 73.8% en 2017, 79.8% en 2019
l'objectif pas encore atteint amélioration constante, mais l'objectif pas encore atteint
Durée de la prophylaxie chirurgicale conform e aux directives
locales dans ≥90% des cas
Global-EPP: 28.1% des traitements chirurgicaux >1 jour en 2015,
25.3% en 2017, 18.9% en 2019
amélioration constante
a. DID: Defined daily doses (DDD)/1000 résidents/jour
b. Total DDD J01(CR+DC+DD+(F-FA01)+MA)/J01(CA+CE+CF+DB+FA01)
c. % DDD J01(CR05+DD+DE+DF+DH+MA+XA+XB+XX08+XX09+XX11)/J01
$ Unités intramuros: chirurgie, médecine interne, gériatrie, pédiatrie, néonatologie intensive et non intensive, maternité, maladies infectieuses,
soins intensifs (ICU), soins spécialisés et psychiatrie (unités polycliniques et hospitalisations de jour exclues)
* Valeurs soulignées et en gras: tendance significative analysée avec régression linéaire (v aleurs paider à évaluer la consommation de manière plus approfondie et à fournir un feed-back plus détaillé aux
prescripteurs.
Il a été démontré que plusieurs antimicrobiens étaient temporairement indisponibles sur le marché belge. La
plupart d'entre eux étaient des médicaments plus anciens à spectre étroit (dont le brevet avait expiré). Ce scénario
favorise la consommation irrationnelle de produits de dernière ligne et doit être évité afin de réduire la pression
de résistance pour ces produits plus récents. Des données ont été recueillies sur l'indisponibilité des agents
antimicrobiens au cours des 5 dernières années (janvier 2015 - janvier 2020) dans la base de données
PharmaStatut de l'Agence fédérale des médicaments et des produits de santé (AFMPS). Il y avait 44 antibiotiques
différents (codes ATC) non disponibles pendant cette période. Une pénurie peut avoir un impact important, en
particulier dans les cas où il n'y a qu'une seule alternative disponible. L'AFMPS consulte plusieurs entreprises
pour trouver des solutions durables afin d'apporter des agents antimicrobiens non disponibles sur le marché belge
à nouveau.
Actuellement, un nouveau plan d'action national "One Health" contre l’antibiorésistance (2020-2024) est en cours
de finalisation. Ce plan d'action comprend plusieurs stratégies visant à améliorer l'utilisation prudente des agents
antimicrobiens et de nouveaux indicateurs pour surveiller l'impact de ces stratégies sur la consommation
d'antimicrobiens et la résistance aux antimicrobiens. Il est également prévu de publier dans les prochaines années
un rapport national "One Health" couvrant tous les secteurs (humain et animal) avec des résultats combinés sur
la consommation d'antimicrobiens et la résistance.
18BACKGROUND
-
The emerge of micro-organisms that are resistant to the action of one or more antimicrobial agents, referred to as
antimicrobial resistance (AMR), is a worldwide threat that requires immediate attention. Although the incidence of
resistant bacteria on the skin (e.g. methicillin resistant Staphylococcus aureus) is decreasing, the incidence of
other resistant bacteria especially found in the gut is clearly increasing (3). AMR leads to an increased burden in
terms of morbidity and mortality, also in Belgium (4,5). Cassini et al. calculated that each year in Europe 33000
persons die due to an infection with a resistant micro-organism. Most of these infections are associated with
healthcare. In Belgium, the number of deaths attributed to AMR was estimated at 530 per year (6). This number
is an underestimation, since only the most prominent resistant bacteria and predominant type of infections were
taken into account. Moreover, the costs of AMR to the Belgian health system are approximately 24 million euros
each year (7).
There is a link between the level of antimicrobial consumption, especially inappropriate consumption, and the level
of AMR (8–10). Therefore the responsible and prudent use of antimicrobials should be encouraged. The ‘One
Health Action Plan against Antimicrobial Resistance’ of the European Commission (June 2017) underlines the
importance of surveillance of antimicrobial use in the member states (11). A recent study of the European Centre
for Disease Prevention and Control (ECDC) indicated that recent efforts in antibiotic stewardship and infection
prevention and control are slowing down (rather than decreasing) the emerge of resistant bacteria, so further
investment in these efforts is needed (12).
Specifically in Belgium, the Belgian Antibiotic Policy Coordination Commission (BAPCOC) was launched in 1999
at a federal level to follow-up the AMR threat and to set up actions to improve antimicrobial use and infection
prevention and control in the different settings (community, hospitals, nursing homes and animal sector) (1). In
the last two decades, several actions were successfully implemented (e.g. public awareness campaigns, antibiotic
management teams in hospitals, hand hygiene campaigns, outbreak support team for multidrug resistant
organisms (MDRO)). Nevertheless, a country visit of ECDC and the European Commission in 2017 made clear
that a revised and more coordinated One Health approach is needed to combat this complex AMR threat with also
attention for the environmental aspects (13). In addition, the Belgian Health Care Knowledge Centre (KCE,
https://kce.fgov.be/) performed an elaborated review of the current antibiotic policy in Belgium and listed several
recommendations for improvement (14). Based on these recommendations, a One Health National AMR Action
Plan (NAP, 2020-2024) was compiled and the final version is currently being validated at political level.
Antimicrobial consumption data are monitored following national and international protocols through longitudinal
or cross-sectional studies. Longitudinal studies rely on administrative data with few details but continuously
collected, whereas cross-sectional studies collect very detailed data at a given point in time (point prevalence
study). Several systems are already in place (e.g. European Surveillance of Antimicrobial Consumption Network
(ESAC-Net, ECDC), Belgian Hospitals – Surveillance of Antimicrobial Consumption (BeH-SAC), Belgian
Veterinary Surveillance of Antibacterial Consumption (BelVet -SAC)) (15–17). So far, the results have been
published in different places. An overall report for the different settings is a target in the new NAP (2020-2024).
The objective of this national report is to present an overview of the trends in antimicrobial consumption in the last
decade (2010-2019) for the different human settings (the community, nursing homes, hospitals), based on the
results of several surveillances and studies. In addition, references to more detailed data related to antimicrobial
consumption are provided.
19METHODS
-
DATA COLLECTIONS
In this national report, the results of the following surveillances/studies are presented:
- European Surveillance of Antimicrobial Consumption Network (ESAC-Net)
- Belgian Hospitals – Surveillance of Antimicrobial Consumption (BeH-SAC)
- Point prevalence survey of healthcare-associated infections and antimicrobial use in long-term care facilities
(HALT) and in psychiatric institutions (HALT-PSY)
- Global and ECDC Point Prevalence Studies (PPS) of antimicrobial consumption, resistance and healthcare-
associated infections in acute hospitals
Below, each methodology is discussed more in detail. An overview of the different Belgian databases is presented
in Table 1.
ESAC-NET
ESAC-Net is the European network of national surveillance systems of antimicrobial consumption, organized by
ECDC (follow-up of the ESAC project, previously coordinated at the University of Antwerp till 2011 (18)). Using a
shared methodology, different European countries are collecting antimicrobial consumption data in the community
and/or hospital sector. The database contains aggregated data, meaning consumption in the whole community
sector and consumption in all hospitals without further specification. In ESAC-Net, the consumption is expressed
in Defined Daily Doses (DDDs) per 1000 inhabitants per day (DID) or packages per 1000 inhabitants per day
(PID), using the country population (Eurostat data (19)) as a denominator for both the community and the hospital
sector. More information on the methodology can be found in the ESAC-Net protocol (15).
Specifically for Belgium, reimbursement data from the National Institute for Health and Disability Insurance (NIHDI)
are used to send Belgian data to ECDC. Each year in July, NIHDI transfers the database (data received from the
insurance companies, Farmanet data for the community, PH data for the hospitals) to Sciensano. Sciensano is
responsible for the data validation and the transferal to ECDC. The data for the community include all antimicrobial
packages delivered in community pharmacies (including all nursing homes who receive their medication from a
community pharmacy, which is the majority in Belgium). Hospital data include all deliveries in hospital pharmacies.
A consequence of using NIHDI data is that only reimbursed consumption is included. As approximately 99% of
the Belgian population has a health insurance, an extrapolation from 99% to 100% is performed to correct for this.
Nevertheless, a small underestimation, especially for certain products with limited reimbursement (e.g.
fluoroquinolones since May 2018, products that are imported from other countries) should be taken into account.
For the community sector, the consumption is besides DID also expressed in PID. The tarification per unit in
Belgian nursing homes (delivery per unit and no longer per package), introduced in the second half of 2015,
cannot be taken into account with this indicator. Consequently, starting from 2015, the consumption in PID is
slightly underestimated (in 2015 ±2% of the total DDDs of antibiotics in the community were delivered per unit).
The estimation of non-reimbursed consumption of fluoroquinolones in 2018 and 2019 is based on a comparison
between total sales data (IQVIA, previously known as IMS, includes reimbursed and non-reimbursed
consumption) and NIHDI data (Farmanet, only reimbursed consumption), with 2017 used as reference year
[personal communication from NIHDI to Sciensano].
For the hospital sector, there is a larger delay in the NIHDI data with an underestimation of approximately 15% for
the last reported year (in the database that is requested in July for the previous year). Therefore, an extra
20extrapolation of 15% is performed for the consumption in hospitals for the last reported year. In the following data
delivery, the data are retrospectively corrected with the exact consumption. Consequently, the antimicrobial
consumption in hospitals in ESAC-Net for the last reported year (2019) is still an estimation. The ESAC-Net
database of November 2020 was used for the analyses in this national report.
BEH-SAC
Since 2007 a national surveillance of antimicrobial consumption has been set up in Belgian hospitals with - in
comparison with ESAC-Net - more detailed data per hospital, making benchmarking possible. Between 2007 and
2014, in the ABUH (Antibiotic Use in Hospitals) project, acute and large (≥150 beds) chronic hospitals were
obligated to annually upload their consumption data on a web-based data collection application of Sciensano
(formerly WIV-ISP) called NSIHweb (20). In 2018, BeH-SAC was introduced with a revised methodology. In line
with the ‘only collect data once’ principle (Royal Decree May 5, 2014), reimbursement data of NIHDI are used in
combination with a new reporting system on Healthstat. The objectives of BeH-SAC are:
- To develop and offer a scientifically standardized methodology to Belgian hospitals, to follow-up their
antimicrobial consumption in a quantitative way through time (in complement to their own local and in-depth
monitoring).
- To give Belgian hospitals the opportunity to benchmark, based on their antimicrobial consumption, with similar
hospitals.
- To provide national and regional data (with an acceptable delay in time) to be able to evaluate the antimicrobial
consumption in Belgian hospitals.
The reimbursement data collected from NIHDI consist of consumption (PH database) and denominator data
(number of patient days (H database) and admissions (SHA database)), collected per year/trimester and per
hospital/unit. In BeH-SAC, the antimicrobial consumption is expressed in DDDs/1000 patient days and DDDs/1000
admissions. The same limitations as for ESAC-Net apply: only reimbursed use is taken into account. Non-
reimbursed off-label use or imported antimicrobials agents are not considered, leading to a small underestimation.
No extrapolations are performed in BeH-SAC and only complete data are presented. More details on the
methodology can be found in the protocol (16). The BeH-SAC database of January 2021 was used for the
analyses in this national report. For the analyses of 2018 and 2019, the data of one tertiary hospital (total number
of tertiary hospitals in 2010-2019: n=7) were excluded because a significant underestimation in the reimbursement
data of this hospital was discovered for these years (technical problem at level of the hospital that is currently
being solved).
The methodology and preliminary results of a validation study of BeH-SAC are presented in Appendix 1.
HALT
HALT is a European PPS (cross-sectional) of healthcare-associated infections and antimicrobial consumption in
long-term facilities, coordinated by ECDC (follow-up of the ESAC project, previously coordinated at the University
of Antwerp (18)). In Belgium, three HALT studies have taken place so far (HALT-1: May-September 2010, HALT-
2: April-May 2013, HALT-3: September-November 2016). In this report, the Belgian results for nursing homes
(HALT-1 to 3) and the European results (HALT-3) for all included long-term care facilities (nursing homes,
residential homes and mixed facilities) are presented. The participation is Belgium was voluntary, all interested
facilities could participate (convenience sample). The data were collected from each facility on one single day by
a local data collector. Data on both institutional and resident level (including antimicrobial use) were collected.
More information on the methodology is available in the HALT protocol (21).
In addition, the HALT-PSY protocol was designed for a psychiatric setting (psychiatric hospitals and psychiatric
wards in acute hospitals) (22). The set-up is similar as the HALT studies, but customized to this specific patient
21population. The first Belgian HALT-PSY study took place in October-November 2017. A summary of the results is
presented in this report.
GLOBAL- AND ECDC-PPS
Similar as the HALT study in long-term care facilities, PPS (cross-sectional) are organized in acute hospitals. In
2011 and 2016-2017, ECDC organized a European PPS in acute hospitals focused on the prevalence of
healthcare-associated infections and antimicrobial consumption. The Global-PPS on antimicrobial consumption
and resistance, organized in 2015, 2017 and 2019 by BAPCOC/the University of Antwerp, has a similar approach.
Detailed information on the methodology of each study can be found in the protocols of the ECDC-PPS (23) and
Global-PPS (24).
In 2017, the ECDC- and Global-PPS were simultaneously organized in Belgian acute care hospitals. A random
selection was made for the ECDC-PPS. In addition, other hospitals could voluntary participate in either the ECDC-
PPS or the Global-PPS. Data had to be collected on one single day for each ward in the participating hospitals.
All patients present at the ward at 8h00 a.m. and not discharged from the ward at the time of the survey had to be
included. Data were collected on the hospital/ward (including the full-time equivalent (FTE) antimicrobial
stewardship consultants, interpreted as the time that a consultant/pharmacist is specifically employed and paid
for antimicrobial stewardship tasks) and patient level (including the consumption of antimicrobial agents). Several
quality indicators were registered, e.g. if the reason of antimicrobial treatment was documented in the patient’s
notes, if a stop/review date was documented, and if the antibiotic prescription was being compliant with the local
guidelines.
In this report, the Belgian results for the ECDC-PPS 2011, the Global-PPS 2015, the combined results of the
ECDC-PPS and Global-PPS 2017, the Global-PPS 2019, and the European results of the ECDC-PPS 2017 are
presented.
Table 1: Overview of the data sources used in this national report
ESAC-Net BeH-SAC HALT/HALT-PSY ECDC-PPS Global-PPS
Data source Reimbursement Reimbursement Data collected locally Data collected locally Data collected locally
data data
Type of study Surveillance Surveillance Point prevalence study Point prevalence study Point prevalence study
Setting Community Acute, specialised Long-term care facilities Acute hospitals Acute hospitals
(including nursing and psychiatric (mainly nursing homes), (inpatient wards) (inpatient wards)
homes) and hospitals (data per HALT-PSY: psychiatric
hospitals hospital) hospitals and psychiatric
(aggregated data) wards in acute hospitals
Main indicator DDDs/1000 DDDs/1000 patient Prevalence (%) of Prevalence (%) of Prevalence (%) of patients
inhabitants/day days, DDDs/1000 residents with at least one patients with at least with at least one
(DID) admissions antimicrobial prescription one antimicrobial antimicrobial prescription
prescription on the day on the day of the PPS
on the day of the PPS
of the PPS
Included A07AA, D01BA, A07AA, D01BA, A07AA, D01BA, J01, J02, A07AA, D01BA, J01, A07AA, D01BA, J01, J02,
antimicrobial J01, J02, J04A, J05, J01, J02, J04A, J05, J04, P01AB J02, J04 (excluding J04A, J05, P01AB, P01B
P01AB P01AB treatment of
agents (ATC)
mycobacteria), P01AB
Start year in 1997 2003 2010 2011 2015
Belgium
Included years 2010-2019 2010-2019 HALT: 2010, 2013, 2016, Surveys in 2011 and Surveys in 2015, 2017 and
in the present HALT-PSY: 2017 2017 2019
report
Reporting ESAC-Net Healthstat: national ECDC and national ECDC and national National/EU reporting
interactive database and hospital reports (28–30) reports (31,32), (32,33); raw data in excel;
(25), ESAC-Net feedback reports hospital feedback one point, longitudinal and
report (26) (27) reports merged feedback reports
ATC = Anatomical Therapeutic Chemical classification; BeH-SAC = Belgian Hospitals - Surveillance of Antimicrobial Consumption; DDD =
Defined Daily Dose; ECDC = European Center for Disease Prevention and Control; ESAC-Net = European Surveillance of Antimicrobial
Consumption Network; Global/ECDC-PPS = Point Prevalence Study of antimicrobial consumption, resistance and healthcare-associated
infections in acute hospitals; HALT = Point prevalence survey of Healthcare-associated infections and Antimicrobial use in Long-Term care
facilities (HALT-PSY: in psychiatric institutions)
22A07AA (intestinal anti-infectives), D01BA (antifungals for systemic use), J01 (antibacterials for syste mic use), J02 (antimycotics for systemic
use), J04 (antimycobacterials), J04A (drugs for treatment of tuberculosis), J05 (antivirals), P01AB (nitroimidazole -derived antiprotozoals),
P01B (antimalarials)
DATA DEFINITIONS AND ANALYSIS
Antimicrobial agents are classified using the Anatomical Therapeutic Chemical (ATC) classification of the World
Health Organization (WHO) Collaborating Centre for Drugs Statistics and Methodology, version December 2020
(2). Table 1 presents the included ATC codes per study. Administration routes that are included are oral (PO),
intravenous (IV), intramuscular (IM), subcutaneous (SC), inhalation and rectal. Other topical use (e.g. transdermal
via ointments) were excluded in the present report.
The indicators for broad-spectrum use were calculated in line with the outcome indicators jointly proposed by
ECDC, the European Food Safety Authority (EFSA) and the European Medicines Agency (EMA) (34).
- For the community: the total DDDs of broad-spectrum penicillins, cephalosporins, macrolides and
fluoroquinolones divided by the total DDDs of narrow-spectrum penicillins, cephalosporins and macrolides
(J01(CR+DC+DD+(F-FA01)+MA) / J01(CA+CE+CF+DB+FA01))
- For hospitals: the percentage of consumed DDDs of broad-spectrum antibacterials among all antibacterials
for systemic use (J01). The following products were included as broad-spectrum: piperacillin in combination
with a beta-lactamase inhibitor (J01CR05), third- and fourth-generation cephalosporins (J01DD and J01DE),
monobactams (J01DF), carbapenems (J01DH), fluoroquinolones (J01MA), glycopeptides (J01XA),
polymyxins (J01XB), daptomycin (J01XX09) and oxazolidinones: linezolid (J01XX08) and tedizolid
(J01XX11).
The Access, Watch and Reserve antibiotic classes are defined in accordance with the AWaRe classification of
the WHO (version December 2019) (35). This antibiotic classification identifies three stewardship groups for
optimal use and potential for antimicrobial resistance selection pressure: Access, Watch and Reserve.
Consumed units/packages per drug were translated in defined daily doses (DDDs) based on the DDD
classification of WHO (version December 2020) (2). Because the list of DDDs is updated every year and the
calculations are retrospectively adjusted, this can lead to a variation in the published results over time. In 2019,
there was an important adjustment in the DDD for several antibiotics (including amoxicillin, amoxicillin + clavulanic
acid, meropenem, ciprofloxacin) which had an important impact on the Belgian results (based on the total antibiotic
consumption in the community in 2017: 25.9 DID before the DDD adjustments and 21.1 DID after applying the
new DDDs).
In addition, a national list of daily dose administrated (DDA) was used for BeH-SAC (version May 2019, validated
by the working group Hospital Medicine of BAPCOC) (36). Compared to DDDs, DDAs are more in line with the
actual doses administrated in Belgian acute hospitals.
Hospitals were classified in accordance with the list of hospitals of the Belgian Ministry of Health (Dienst
Datamanagement - Directoraat-Generaal Gezondheidszorg, version December 2020) and in line with the
definitions of ECDC (23,37). Hospitals in Belgium are divided in general and categorical hospitals (in the past
indicated as chronic hospitals, n=8 in 2019). General hospitals are further classified in acute (n=104 in 2019) and
psychiatric hospitals (n=59 in 2019). Furthermore, acute hospitals can be divided per type: primary (general, n=80
in 2019), secondary (general with a university character, n=17 in 2019) and tertiary (university, n=7 in 2019)
hospitals.
In BeH-SAC, data presented for all inpatient wards include surgery, internal medicine, geriatrics, pediatrics,
intensive and non-intensive neonatology, maternity, infectious disease, burn unit, intensive care (ICU), specialized
care and psychiatry. Outpatient wards and day hospitalizations were excluded. In some chapters, where indicated,
psychiatry units and neonatology/pediatric units were also excluded from the results.
23You can also read